

Athletics vs Reds Live Score (5 Aug, 2026)
Game Information
Stage
Standard
Season
2026
First Pitch
Wed, Aug 5, 6:40 pm
Venue
Great American Ball Park
Location
Cincinnati, Ohio
Attendance
16,544
Live Situation
0Balls
3Strikes
0Outs
—Pitcher
—At Bat
Pitch Sequence
1
STRIKE LOOKING
Cutter
86 MPH
2
STRIKE SWINGING
Four-seam FB
95 MPH
3
STRIKE FOUL
Four-seam FB
96 MPH
4
STRIKE SWINGING
Four-seam FB
95 MPH
Injury Report
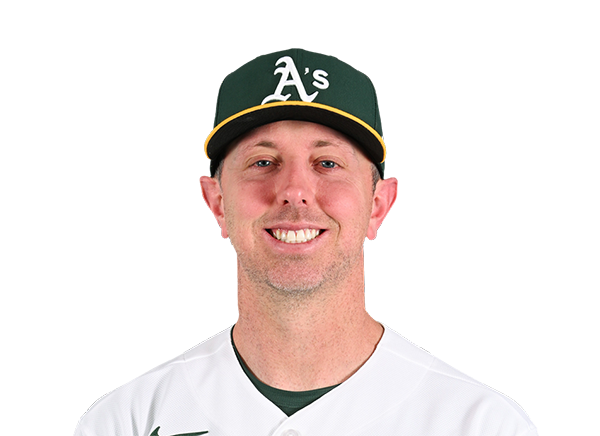
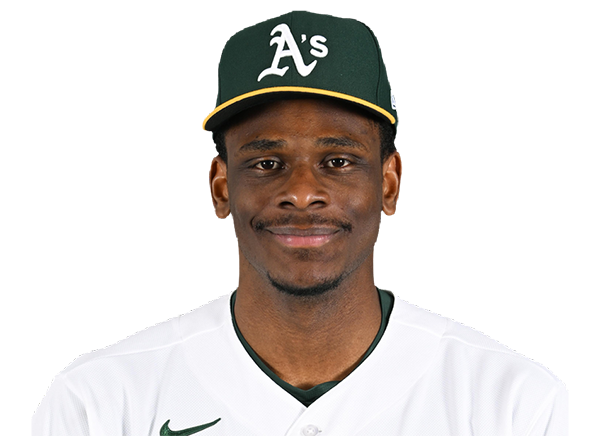
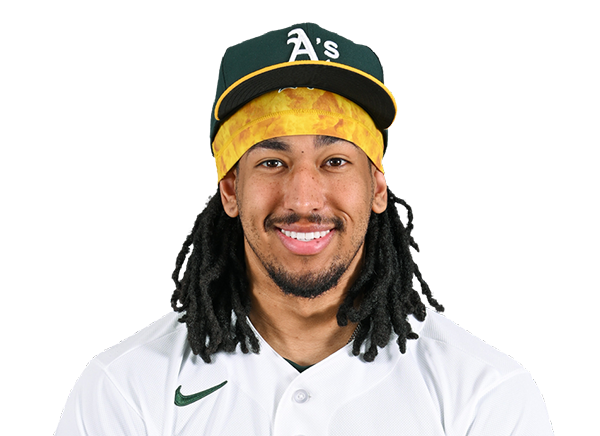
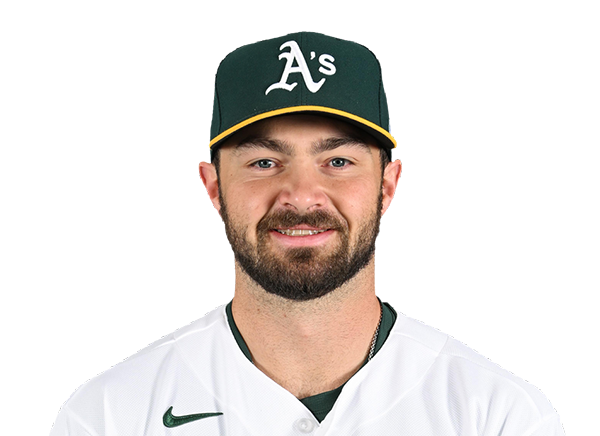



Team Stats
 ATH
CIN


2
Runs
3
4
Hits
6
0
Errors
0
1
Home Runs
1
2
Walks
1
7
Strikeouts
11
Player Box Score
Athletics
| Player | H-AB | AB | R | H | RBI | HR | BB | K | #P | AVG | OBP | SLG |
|---|---|---|---|---|---|---|---|---|---|---|---|---|
 Lawrence Butler | 1-4 | 4 | 1 | 1 | 1 | 1 | 0 | 1 | 18 | .208 | .304 | .331 |
 Jacob Wilson | 0-4 | 4 | 0 | 0 | 0 | 0 | 0 | 0 | 16 | .270 | .302 | .392 |
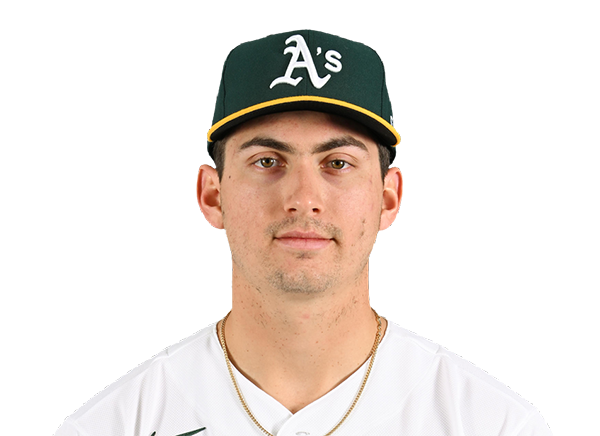 Tyler Soderstrom | 1-2 | 2 | 1 | 1 | 0 | 0 | 2 | 0 | 16 | .245 | .340 | .462 |
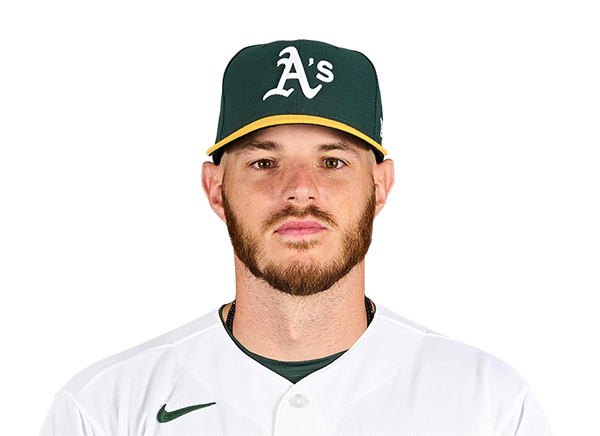 Jonah Heim | 1-4 | 4 | 0 | 1 | 1 | 0 | 0 | 1 | 15 | .228 | .275 | .434 |
 Jeff McNeil | 0-4 | 4 | 0 | 0 | 0 | 0 | 0 | 1 | 11 | .251 | .307 | .330 |
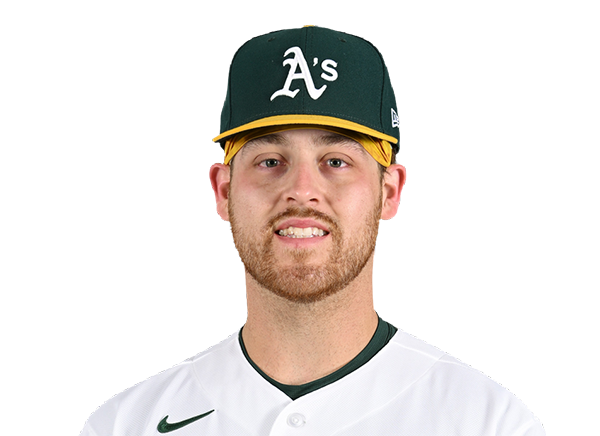 Tommy White | 1-4 | 4 | 0 | 1 | 0 | 0 | 0 | 1 | 12 | .265 | .286 | .294 |
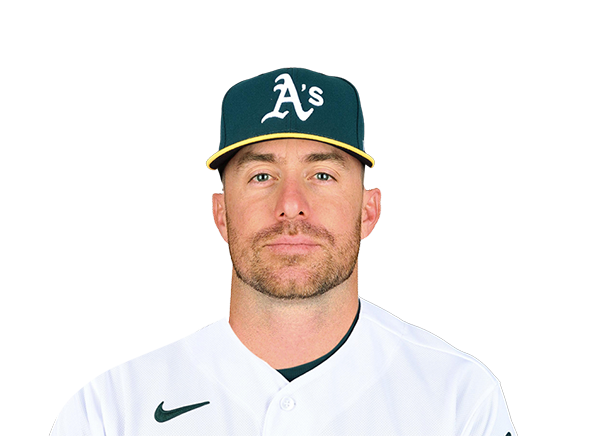 Donovan Walton | 0-2 | 2 | 0 | 0 | 0 | 0 | 0 | 0 | 12 | .167 | .375 | .267 |
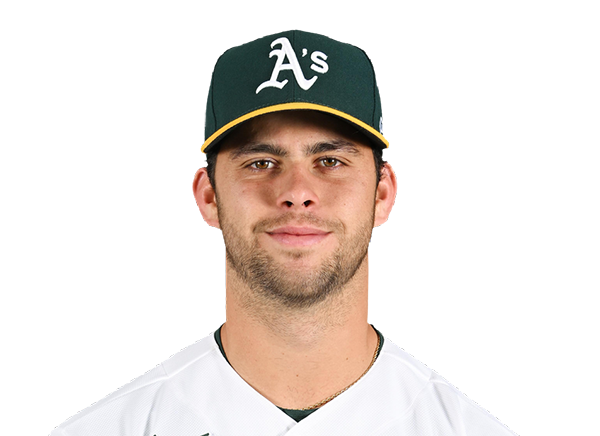 Max Muncy | 0-1 | 1 | 0 | 0 | 0 | 0 | 0 | 1 | 7 | .219 | .293 | .381 |
 Henry Bolte | 0-3 | 3 | 0 | 0 | 0 | 0 | 0 | 2 | 15 | .259 | .341 | .348 |
 Alika Williams | 0-3 | 3 | 0 | 0 | 0 | 0 | 0 | 0 | 8 | .263 | .290 | .398 |
Cincinnati Reds
| Player | H-AB | AB | R | H | RBI | HR | BB | K | #P | AVG | OBP | SLG |
|---|---|---|---|---|---|---|---|---|---|---|---|---|
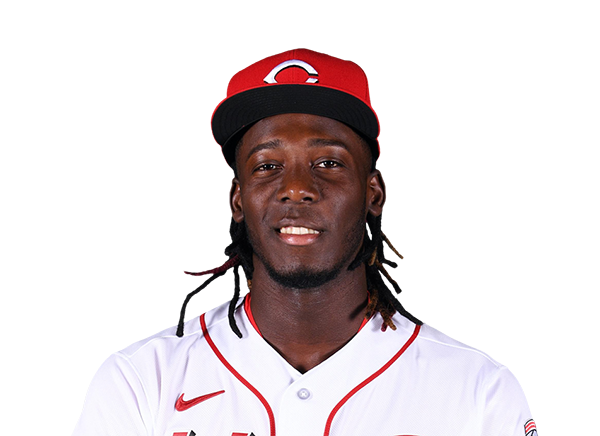 Elly De La Cruz | 1-3 | 3 | 0 | 1 | 0 | 0 | 1 | 1 | 17 | .277 | .358 | .497 |
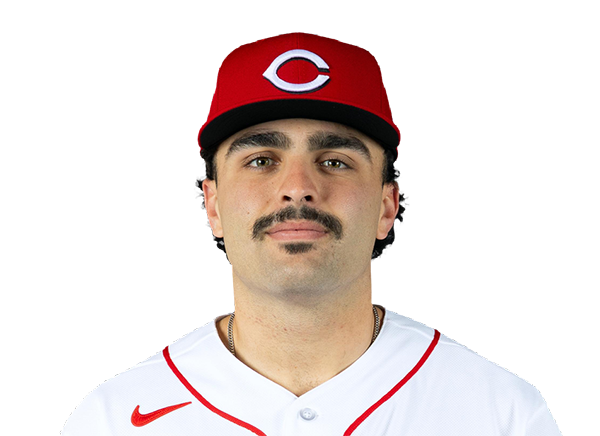 Sal Stewart | 1-4 | 4 | 1 | 1 | 0 | 0 | 0 | 2 | 22 | .255 | .335 | .477 |
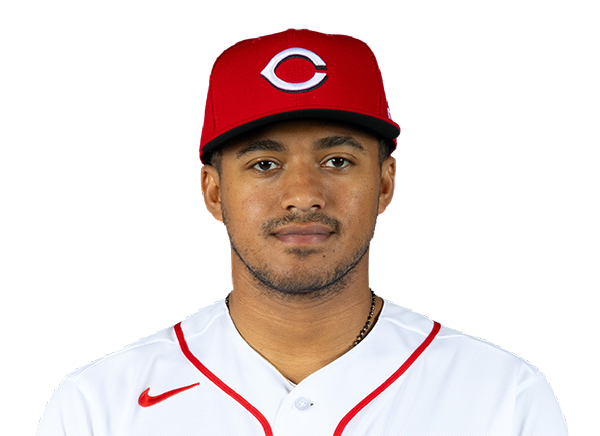 Dane Myers | 1-4 | 4 | 0 | 1 | 0 | 0 | 0 | 1 | 14 | .268 | .364 | .369 |
 Eugenio Suarez | 0-3 | 3 | 0 | 0 | 0 | 0 | 0 | 3 | 21 | .200 | .275 | .383 |
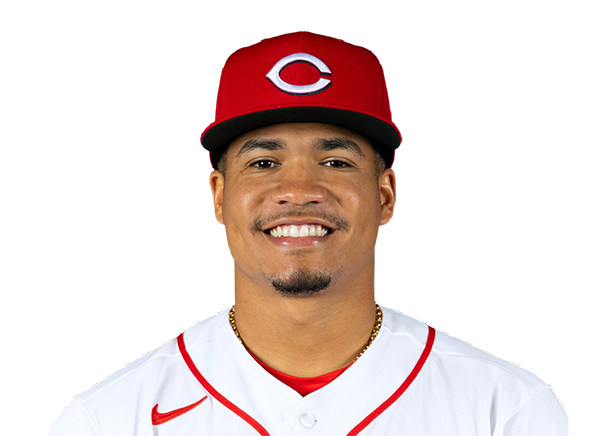 Noelvi Marte | 1-2 | 2 | 1 | 1 | 1 | 0 | 0 | 0 | 7 | .195 | .239 | .343 |
 JJ Bleday | 0-3 | 3 | 0 | 0 | 0 | 0 | 0 | 1 | 7 | .226 | .340 | .458 |
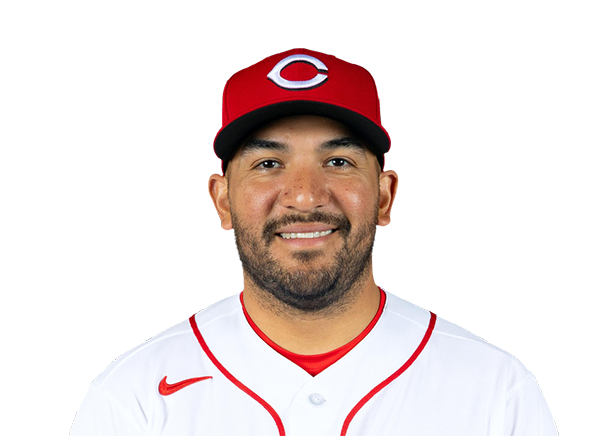 Jose Trevino | 1-3 | 3 | 0 | 1 | 1 | 0 | 0 | 1 | 17 | .253 | .261 | .425 |
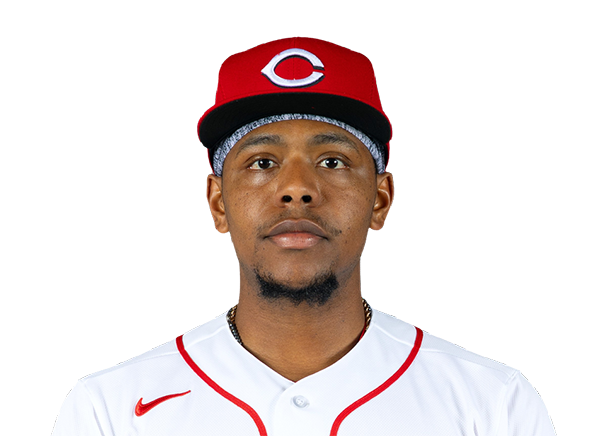 Ke'Bryan Hayes | 0-3 | 3 | 0 | 0 | 0 | 0 | 0 | 1 | 12 | .139 | .195 | .241 |
 Matt McLain | 1-3 | 3 | 1 | 1 | 1 | 1 | 0 | 1 | 12 | .192 | .290 | .334 |
Athletics
| Player | IP | H | R | ER | BB | K | HR | PC-ST | ERA | PC |
|---|---|---|---|---|---|---|---|---|---|---|
 Jacob Lopez | 5.0 | 4 | 2 | 2 | 1 | 9 | 1 | 87-57 | 5.64 | 87 |
 Hayden Juenger | 0.2 | 2 | 1 | 1 | 0 | 1 | 0 | 15-10 | 4.35 | 15 |
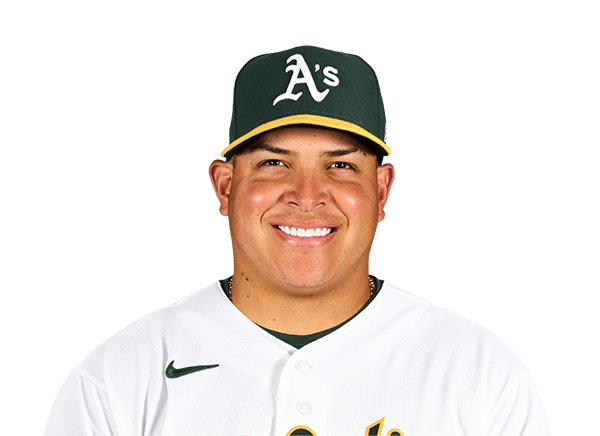 Jose Suarez | 0.1 | 0 | 0 | 0 | 0 | 0 | 0 | 3-1 | 4.66 | 3 |
 Scott Blewett | 2.0 | 0 | 0 | 0 | 0 | 1 | 0 | 24-16 | 1.23 | 24 |
Cincinnati Reds
| Player | IP | H | R | ER | BB | K | HR | PC-ST | ERA | PC |
|---|---|---|---|---|---|---|---|---|---|---|
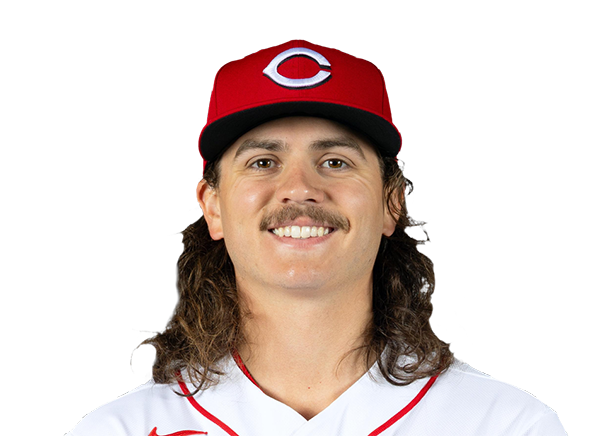 Rhett Lowder | 6.0 | 4 | 2 | 2 | 2 | 3 | 1 | 95-62 | 5.26 | 95 |
 Brock Burke | 1.1 | 0 | 0 | 0 | 0 | 3 | 0 | 18-13 | 2.45 | 18 |
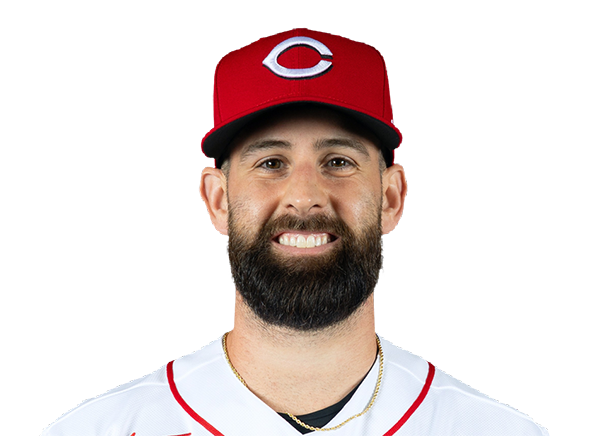 Tejay Antone | 0.2 | 0 | 0 | 0 | 0 | 0 | 0 | 6-4 | 2.25 | 6 |
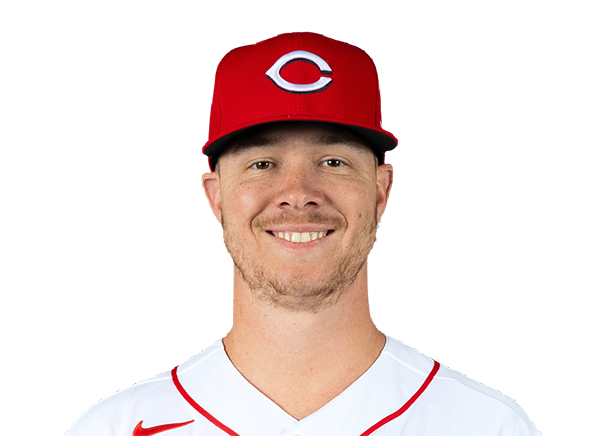 Emilio Pagan | 1.0 | 0 | 0 | 0 | 0 | 1 | 0 | 11-8 | 4.26 | 11 |
H2H / Season Series
CIN6–5
ATH
CIN3–2
ATH
CIN5–4
ATH
CIN7–9
ATH
ATH12–4
CIN
Last 5 Games
| Date | Opponent | Result |
|---|---|---|
| Aug 22 |  @ HOU | W4–3 |
| Aug 21 | @ HOU | L0–4 |
| Aug 20 |  @ KC | L2–6 |
| Aug 19 | @ KC | L7–9 |
| Aug 18 | @ KC | L3–4 |
| Date | Opponent | Result |
|---|---|---|
| Aug 22 |  @ ARI | W11–5 |
| Aug 21 | @ ARI | L0–9 |
| Aug 20 |  vs STL | L9–10 |
| Aug 19 | vs STL | W5–4 |
| Aug 18 | vs STL | L0–3 |
Standings
American League
| Team | W | L | PCT | GB | DIFF | STRK |
|---|---|---|---|---|---|---|
1 Rays | 76 | 53 | .589 | - | +42 | L3 |
2 White Sox | 67 | 62 | .519 | 9 | +42 | L1 |
| 3Astros | 65 | 65 | .500 | 11.5 | -43 | L1 |
4 Yankees | 73 | 56 | .566 | 3 | +95 | L1 |
5 Red Sox | 70 | 59 | .543 | 6 | +98 | W2 |
6 Rangers | 64 | 66 | .492 | 12.5 | -48 | L1 |
7 Guardians | 64 | 66 | .492 | 12.5 | -14 | W3 |
8 Blue Jays | 64 | 67 | .489 | 13 | -50 | W1 |
9 Twins | 63 | 67 | .485 | 13.5 | -47 | L2 |
10 Orioles | 63 | 67 | .485 | 13.5 | -33 | W2 |
11 Mariners | 62 | 68 | .477 | 14.5 | -44 | W2 |
12 Tigers | 61 | 68 | .473 | 15 | +77 | L4 |
| 13Royals | 57 | 74 | .435 | 20 | -95 | W7 |
14 Angels | 52 | 78 | .400 | 24.5 | -68 | W1 |
| 15Athletics | 50 | 80 | .385 | 26.5 | -188 | W1 |
National League
| Team | W | L | PCT | GB | DIFF | STRK |
|---|---|---|---|---|---|---|
1 Brewers | 81 | 49 | .623 | - | +163 | W3 |
2 Dodgers | 79 | 51 | .608 | 2 | +147 | W5 |
3 Braves | 75 | 55 | .577 | 6 | +108 | L2 |
4 Cubs | 74 | 56 | .569 | 7 | +98 | L3 |
5 Phillies | 72 | 58 | .554 | 9 | +25 | W8 |
6 Padres | 70 | 60 | .538 | 11 | +9 | W2 |
| 7Diamondbacks | 68 | 62 | .523 | 13 | +7 | L1 |
8 Marlins | 66 | 64 | .508 | 15 | +17 | W2 |
| 9Cardinals | 66 | 65 | .504 | 15.5 | 0 | L2 |
10 Pirates | 63 | 68 | .481 | 18.5 | +29 | L2 |
| 11Reds | 62 | 68 | .477 | 19 | -92 | W1 |
12 Nationals | 61 | 70 | .466 | 20.5 | +14 | L3 |
13 Mets | 59 | 71 | .454 | 22 | -39 | W1 |
14 Giants | 52 | 77 | .403 | 28.5 | -79 | L3 |
15 Rockies | 50 | 79 | .388 | 30.5 | -131 | L5 |
ATH
VS
CIN
Pitchers
Jacob Lopez
Catchers
Jonah Heim
Infielders
Jeff McNeil
Tommy White
Donovan Walton
Alika Williams
Outfielders
Lawrence Butler
Tyler Soderstrom
Henry Bolte
Designated Hitters
Jacob Wilson
Pitchers
Rhett Lowder
Catchers
Jose Trevino
Infielders
Elly De La Cruz
Sal Stewart
Ke'Bryan Hayes
Matt McLain
Outfielders
Dane Myers
Noelvi Marte
JJ Bleday
Designated Hitters
Eugenio Suarez
Athletics
VS
Reds
Batting
114
Team Games Played
113
3874
At Bats
3769
946
Hits
866
473
Runs Batted In
447
135
Home Runs
146
57
Stolen Bases
83
.244
Batting Average
.230
493
Runs
470
176
Doubles
168
10
Triples
11
1547
Total Bases
1494
386
Walks
413
988
Strikeouts
1075
.319
On Base Percentage
.310
.399
Slugging Percentage
.396
.719
OBP Pct + SLG Pct
.706
114
Games Played
113
114
Games Started
113
51
Hit By Pitch
35
0.0
Wins Above Replacement
0.0
0.0
Offensive Wins Above Replacement
0.0
23
Caught Stealing
25
1
Is Qualified
1
494.0
Runs Created
476.1
4.3
Runs Created Per 27 Outs
4.2
.089
Walks Per Plate Appearance
.097
0.39
Walk To Strikeout Ratio
0.38
.155
Isolated Power
.167
.264
Secondary Average
.292
3.81
Pitches Per Plate Appearance
3.93
321
Extra Base Hits
325
4350
Plate Appearances
4258
28.7
At Bats Per Home Run
25.8
17
Sacrifice Hit
14
21
Sacrifice Flies
24
Pitching
114
Team Games Played
113
22
Quality Starts
38
45
Wins
55
69
Losses
58
27
Saves
28
62
Holds
64
1055
Hits
932
607
Earned runs
493
177
Home Runs
142
455
Walks
480
971
Strikeouts
906
8.6
Strikeouts Per 9 Innings
8.1
154.1
Pitches Per Start
153.1
1.49
Walks Plus Hits Per Inning Pitched
1.40
5.40
Earned Run Average
4.41
69
Losses
58
1011.1
Innings pitched
1006.0
.395
Win Percentage
.487
50
Save Opportunities
46
.268
Opponent Batting Average
.244
.349
Opponent's On-base pct.
.334
.465
Opponent's Slugging pct.
.408
.813
Opponent's OPB Pct + SLG Pct
.742
3938
At Bats
3818
206
Doubles
160
19
Triples
20
56
Batters Hit
54
74
Stolen Bases
108
114
Games Played
113
1
Complete Games
0
6
Shutouts
7
32
Wild Pitches
29
630
Runs Batted In
514
7
Balks
2
1011.1
Innings pitched
1006.0
8.6
Strikeouts Per 9 Innings
8.1
27
Caught Stealing
23
114
Games Started
113
0.0
Wins Above Replacement
0.0
1
Is Qualified
1
649
Runs
531
607
Earned Runs
493
1830
Total Bases
1558
Fielding
114
Team Games Played
113
1011
Full Innings
1006
3935
Total Chances
3996
3034
Putouts
3018
852
Assists
918
49
Errors
60
176
Double Plays
168
0.988
Fielding Percentage
0.985
34.6
Range Factor
35.2
0.0
Zone Rating
0.0
114
Games Played
113
0
Games Started
0
0.0
Defensive Wins Above Replacement
0.0
1
Qualified
1