

Athletics vs Royals Live Score (20 Aug, 2026)
Game Information
Stage
Standard
Season
2026
First Pitch
Thu, Aug 20, 2:10 pm
Venue
Kauffman Stadium
Location
Kansas City, Missouri
Attendance
0
Live Situation
0Balls
0Strikes
0Outs
—Pitcher
—At Bat
Home Runs
Shea Langeliers
23 HR
.263 AVG
51 RBI

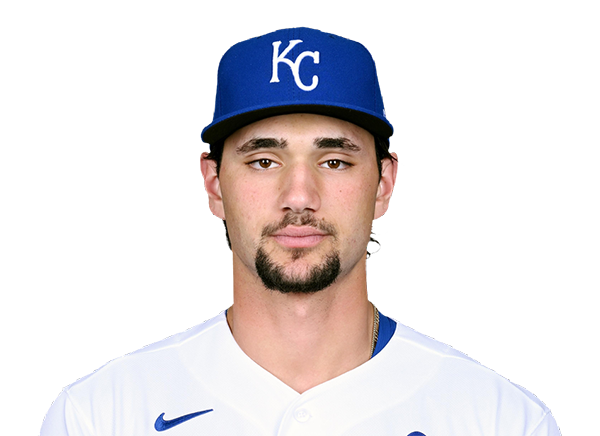
Jac Caglianone
22 HR
.279 AVG
60 RBI
Batting Average
Shea Langeliers
.263 AVG
.332 OBP
.497 SLG
Bobby Witt Jr.
.284 AVG
.360 OBP
.455 SLG

Runs Batted In
Nick Kurtz
69 RBI
21 HR
.256 AVG

Jac Caglianone
60 RBI
22 HR
.279 AVG
Earned Run Average
J.T. Ginn
3.53 ERA
8 W
114 K

Michael Wacha
3.58 ERA
6 W
120 K

Wins
J.T. Ginn
8 W
3.53 ERA
114 K
Noah Cameron
7 W
4.16 ERA
126 K

Strikeouts
J.T. Ginn
114 K
8 W
3.53 ERA
Noah Cameron
126 K
7 W
4.16 ERA
Injury Report



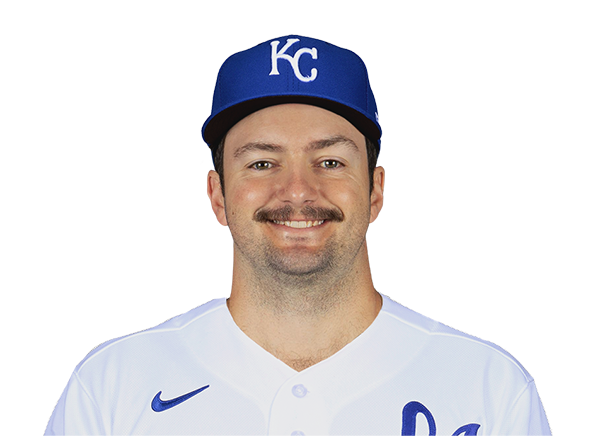
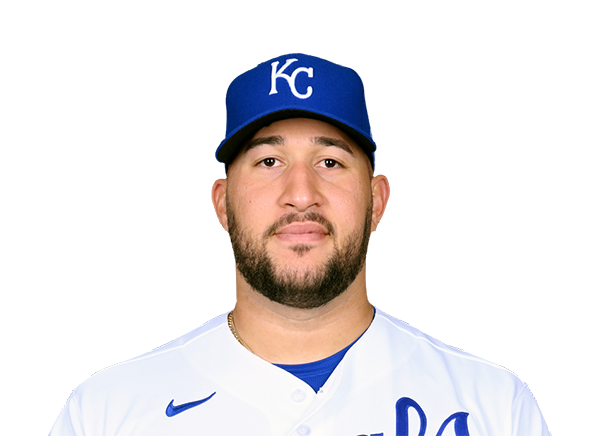
Team Stats
 ATH
KC


555
Runs
535
1053
Hits
1047
60
Errors
56
153
Home Runs
128
417
Walks
397
1081
Strikeouts
1008
Player Box Score
Athletics
| Player | H-AB | AB | H | RBI | HR | SB | K | AVG |
|---|---|---|---|---|---|---|---|---|
 Henry Bolte | 75-278 | 278 | 75 | 26 | 6 | 14 | 84 | .270 |
 Jeff McNeil | 92-348 | 348 | 92 | 43 | 6 | 6 | 44 | .264 |
 Zack Gelof | 71-260 | 260 | 71 | 36 | 14 | 9 | 70 | .273 |
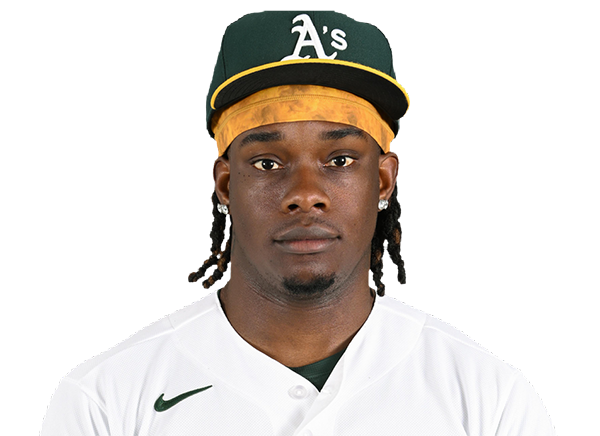 Lawrence Butler | 73-341 | 341 | 73 | 36 | 11 | 9 | 98 | .214 |
 Max Muncy | 42-192 | 192 | 42 | 24 | 6 | 3 | 71 | .219 |
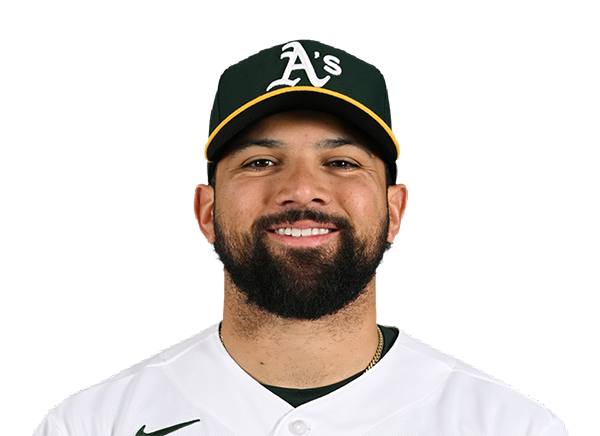 Carlos Cortes | 65-255 | 255 | 65 | 35 | 7 | 2 | 43 | .255 |
 Brian Serven | 7-35 | 35 | 7 | 7 | 3 | 0 | 7 | .200 |
 Donovan Walton | 40-143 | 143 | 40 | 16 | 3 | 1 | 28 | .280 |
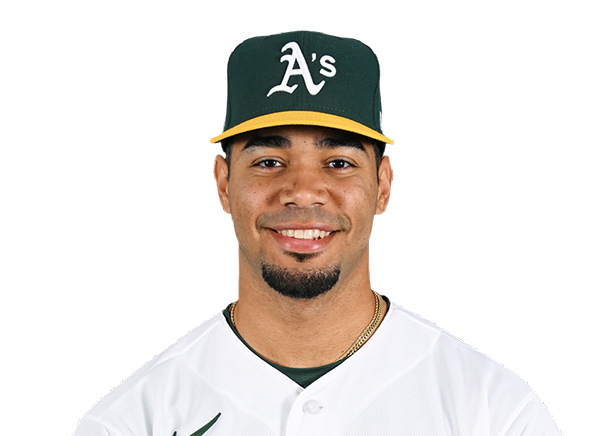 Darell Hernaiz | 29-124 | 124 | 29 | 7 | 1 | 3 | 24 | .234 |
Kansas City Royals
| Player | H-AB | AB | H | RBI | HR | SB | K | AVG |
|---|---|---|---|---|---|---|---|---|
 Nick Loftin | 62-269 | 269 | 62 | 35 | 5 | 2 | 49 | .230 |
|
Bobby Witt Jr. | 121-426 | 426 | 121 | 47 | 15 | 33 | 84 | .284 |
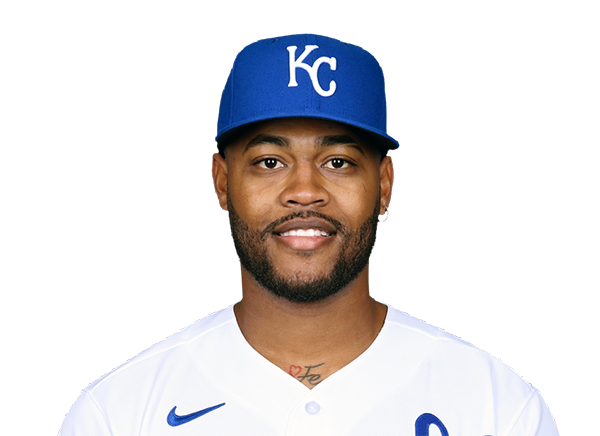 Maikel Garcia | 75-282 | 282 | 75 | 32 | 3 | 5 | 47 | .266 |
 Salvador Perez | 97-452 | 452 | 97 | 55 | 16 | 0 | 97 | .215 |
 Vinnie Pasquantino | 74-305 | 305 | 74 | 36 | 7 | 4 | 60 | .243 |
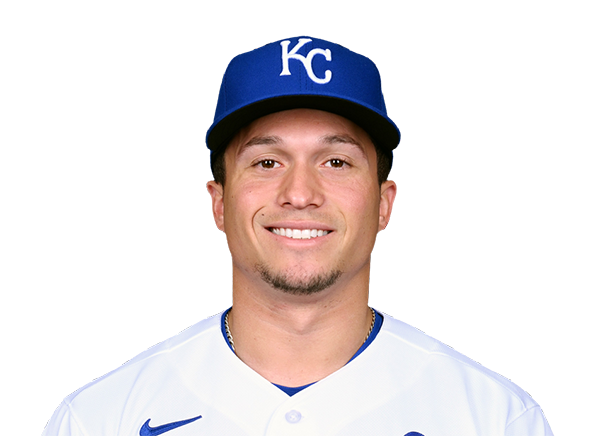 Isaac Collins | 81-359 | 359 | 81 | 36 | 6 | 6 | 93 | .226 |
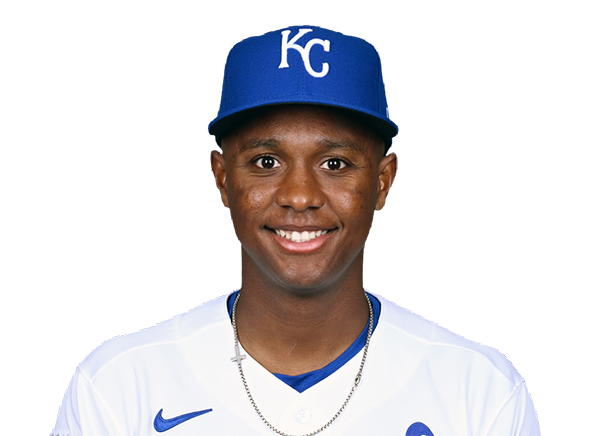 Tyler Tolbert | 30-96 | 96 | 30 | 8 | 3 | 17 | 19 | .313 |
 Michael Massey | 89-327 | 327 | 89 | 42 | 11 | 2 | 62 | .272 |
 Luke Maile | 5-21 | 21 | 5 | 5 | 1 | 0 | 8 | .238 |
Athletics
| Player | IP | H | R | ER | BB | K | HR | PC-ST | ERA | PC |
|---|---|---|---|---|---|---|---|---|---|---|
 Gage Jump | --.-- | -- | -- | -- | -- | -- | -- | ----- | 4.50 | -- |
Kansas City Royals
| Player | IP | H | R | ER | BB | K | HR | PC-ST | ERA | PC |
|---|---|---|---|---|---|---|---|---|---|---|
 Randy Dobnak | --.-- | -- | -- | -- | -- | -- | -- | ----- | 1.73 | -- |
H2H / Season Series
KC9–7
ATH
KC4–3
ATH
KC9–5
ATH
ATH6–3
KC
ATH5–2
KC
ATH1–4
KC
ATH12–1
KC
KC7–6
ATH
Last 5 Games
| Date | Opponent | Result |
|---|---|---|
| Aug 19 | @ KC | L7–9 |
| Aug 18 | @ KC | L3–4 |
| Aug 17 | @ KC | L5–9 |
| Aug 16 |  vs TEX | W5–2 |
| Aug 15 | vs TEX | L3–5 |
| Date | Opponent | Result |
|---|---|---|
| Aug 19 | vs ATH | W9–7 |
| Aug 18 | vs ATH | W4–3 |
| Aug 17 | vs ATH | W9–5 |
| Aug 16 |  @ LAA | W3–0 |
| Aug 15 | @ LAA | L0–1 |
Standings
American League
| Team | W | L | PCT | GB | DIFF | STRK |
|---|---|---|---|---|---|---|
1 Rays | 76 | 53 | .589 | - | +42 | L3 |
2 White Sox | 67 | 62 | .519 | 9 | +42 | L1 |
3 Astros | 65 | 65 | .500 | 11.5 | -43 | L1 |
4 Yankees | 73 | 56 | .566 | 3 | +95 | L1 |
5 Red Sox | 70 | 59 | .543 | 6 | +98 | W2 |
| 6Rangers | 64 | 66 | .492 | 12.5 | -48 | L1 |
7 Guardians | 64 | 66 | .492 | 12.5 | -14 | W3 |
8 Blue Jays | 64 | 67 | .489 | 13 | -50 | W1 |
9 Twins | 63 | 67 | .485 | 13.5 | -47 | L2 |
10 Orioles | 63 | 67 | .485 | 13.5 | -33 | W2 |
11 Mariners | 62 | 68 | .477 | 14.5 | -44 | W2 |
12 Tigers | 61 | 68 | .473 | 15 | +77 | L4 |
| 13Royals | 57 | 74 | .435 | 20 | -95 | W7 |
| 14Angels | 52 | 78 | .400 | 24.5 | -68 | W1 |
| 15Athletics | 50 | 80 | .385 | 26.5 | -188 | W1 |
National League
| Team | W | L | PCT | GB | DIFF | STRK |
|---|---|---|---|---|---|---|
1 Brewers | 81 | 49 | .623 | - | +163 | W3 |
2 Dodgers | 79 | 51 | .608 | 2 | +147 | W5 |
3 Braves | 75 | 55 | .577 | 6 | +108 | L2 |
4 Cubs | 74 | 56 | .569 | 7 | +98 | L3 |
5 Phillies | 72 | 58 | .554 | 9 | +25 | W8 |
6 Padres | 70 | 60 | .538 | 11 | +9 | W2 |
7 Diamondbacks | 68 | 62 | .523 | 13 | +7 | L1 |
8 Marlins | 66 | 64 | .508 | 15 | +17 | W2 |
9 Cardinals | 66 | 65 | .504 | 15.5 | 0 | L2 |
10 Pirates | 63 | 68 | .481 | 18.5 | +29 | L2 |
11 Reds | 62 | 68 | .477 | 19 | -92 | W1 |
12 Nationals | 61 | 70 | .466 | 20.5 | +14 | L3 |
13 Mets | 59 | 71 | .454 | 22 | -39 | W1 |
14 Giants | 52 | 77 | .403 | 28.5 | -79 | L3 |
15 Rockies | 50 | 79 | .388 | 30.5 | -131 | L5 |
ATH
VS
KC
Pitchers
Gage Jump
Catchers
Brian Serven
Infielders
Jeff McNeil
Max Muncy
Donovan Walton
Darell Hernaiz
Outfielders
Henry Bolte
Zack Gelof
Carlos Cortes
Designated Hitters
Lawrence Butler
Pitchers
Randy Dobnak
Catchers
Luke Maile
Infielders
Bobby Witt Jr.
Maikel Garcia
Salvador Perez
Michael Massey
Outfielders
Nick Loftin
Isaac Collins
Tyler Tolbert
Designated Hitters
Vinnie Pasquantino
Athletics
VS
Royals
Batting
127
Team Games Played
128
4311
At Bats
4282
1053
Hits
1047
531
Runs Batted In
511
153
Home Runs
128
67
Stolen Bases
97
.244
Batting Average
.245
555
Runs
535
198
Doubles
227
11
Triples
17
1732
Total Bases
1692
417
Walks
397
1081
Strikeouts
1008
.318
On Base Percentage
.313
.402
Slugging Percentage
.395
.719
OBP Pct + SLG Pct
.708
127
Games Played
128
127
Games Started
128
56
Hit By Pitch
46
0.0
Wins Above Replacement
0.0
0.0
Offensive Wins Above Replacement
0.0
26
Caught Stealing
28
1
Is Qualified
1
548.9
Runs Created
541.2
4.3
Runs Created Per 27 Outs
4.3
.086
Walks Per Plate Appearance
.083
0.39
Walk To Strikeout Ratio
0.39
.158
Isolated Power
.151
.264
Secondary Average
.259
3.80
Pitches Per Plate Appearance
3.81
362
Extra Base Hits
372
4825
Plate Appearances
4790
28.2
At Bats Per Home Run
33.5
17
Sacrifice Hit
22
22
Sacrifice Flies
41
Pitching
127
Team Games Played
128
26
Quality Starts
52
49
Wins
54
78
Losses
74
30
Saves
31
70
Holds
59
1187
Hits
1113
687
Earned runs
598
196
Home Runs
161
506
Walks
469
1065
Strikeouts
938
8.5
Strikeouts Per 9 Innings
7.5
154.0
Pitches Per Start
147.0
1.51
Walks Plus Hits Per Inning Pitched
1.41
5.50
Earned Run Average
4.79
78
Losses
74
1124.0
Innings pitched
1124.1
.386
Win Percentage
.422
56
Save Opportunities
54
.270
Opponent Batting Average
.259
.351
Opponent's On-base pct.
.337
.467
Opponent's Slugging pct.
.435
.817
Opponent's OPB Pct + SLG Pct
.772
4389
At Bats
4294
234
Doubles
232
20
Triples
20
62
Batters Hit
48
85
Stolen Bases
64
127
Games Played
128
1
Complete Games
2
6
Shutouts
7
38
Wild Pitches
46
714
Runs Batted In
608
8
Balks
2
1124.0
Innings pitched
1124.1
8.5
Strikeouts Per 9 Innings
7.5
32
Caught Stealing
32
127
Games Started
128
0.0
Wins Above Replacement
0.0
1
Is Qualified
1
736
Runs
639
687
Earned Runs
598
2049
Total Bases
1868
Fielding
127
Team Games Played
128
1124
Full Innings
1124
4386
Total Chances
4593
3372
Putouts
3373
954
Assists
1164
60
Errors
56
198
Double Plays
227
0.986
Fielding Percentage
0.988
34.6
Range Factor
36.3
0.0
Zone Rating
0.0
127
Games Played
128
0
Games Started
0
0.0
Defensive Wins Above Replacement
0.0
1
Qualified
1