

Blue Jays vs Athletics Live Score (8 Sep, 2026)
Game Information
Stage
STD
Season
2026
First Pitch
Mon, Sep 7, 10:05 pm
Venue
Sutter Health Park
Location
Sacramento, California
Venue Type
Outdoor
Broadcast
MLB.TV
Attendance
7,467
Live Situation
0Balls
1Strikes
0Outs
—Pitcher
—At Bat
Pitch Sequence
1
STRIKE FOUL
Four-seam FB
98 MPH
2
BALL IN PLAY
Four-seam FB
99 MPH
Injury Report




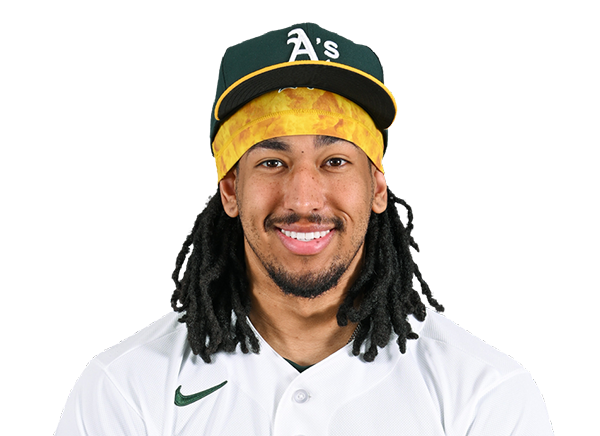
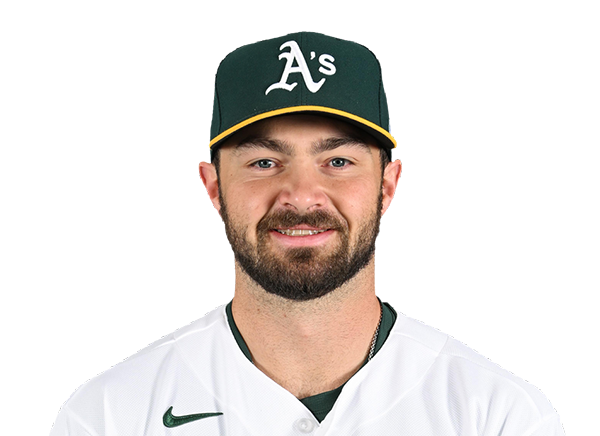
Team Stats
 TOR
ATH


5
Runs
6
9
Hits
6
3
Errors
0
3
Home Runs
1
3
Walks
4
4
Strikeouts
10
Player Box Score
Toronto Blue Jays
| Player | H-AB | AB | R | H | RBI | HR | BB | K | #P | AVG | OBP | SLG |
|---|---|---|---|---|---|---|---|---|---|---|---|---|
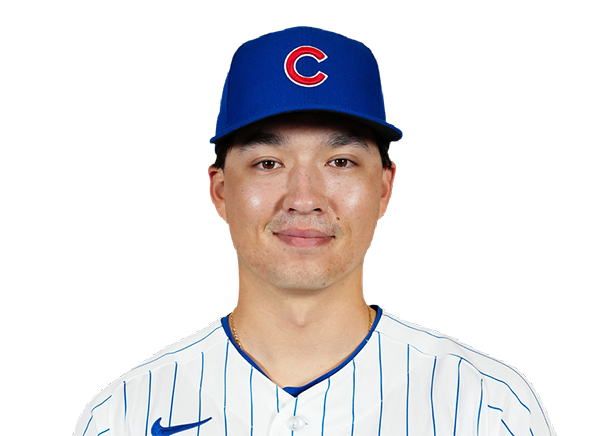 Brett Bateman | 0-4 | 4 | 0 | 0 | 0 | 0 | 1 | 1 | 23 | .333 | .403 | .390 |
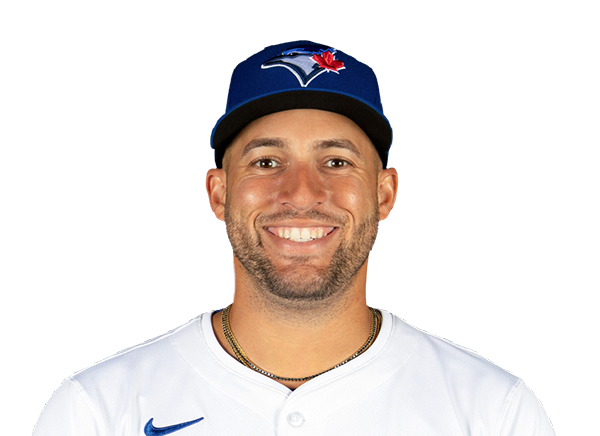 George Springer | 0-5 | 5 | 0 | 0 | 0 | 0 | 0 | 2 | 20 | .247 | .321 | .409 |
 Vladimir Guerrero Jr. | 1-4 | 4 | 0 | 1 | 0 | 0 | 0 | 1 | 16 | .259 | .329 | .353 |
 Alejandro Kirk | 2-4 | 4 | 1 | 2 | 1 | 1 | 0 | 0 | 11 | .276 | .345 | .422 |
 Charles McAdoo | 0-0 | 0 | 0 | 0 | 0 | 0 | 0 | 0 | 0 | .244 | .294 | .346 |
 Brandon Valenzuela | 0-0 | 0 | 0 | 0 | 0 | 0 | 0 | 0 | 0 | .218 | .302 | .368 |
 Kazuma Okamoto | 1-2 | 2 | 1 | 1 | 1 | 1 | 2 | 0 | 15 | .232 | .306 | .448 |
 Nathan Lukes | 2-4 | 4 | 1 | 2 | 0 | 0 | 0 | 0 | 15 | .272 | .321 | .392 |
 Ernie Clement | 1-4 | 4 | 1 | 1 | 0 | 0 | 0 | 0 | 16 | .275 | .301 | .385 |
 Andres Gimenez | 2-4 | 4 | 1 | 2 | 2 | 1 | 0 | 0 | 12 | .244 | .289 | .363 |
 Myles Straw | 0-2 | 2 | 0 | 0 | 0 | 0 | 0 | 0 | 8 | .238 | .301 | .349 |
 Josh Smith | 0-1 | 1 | 0 | 0 | 1 | 0 | 0 | 0 | 7 | .221 | .313 | .337 |
Athletics
| Player | H-AB | AB | R | H | RBI | HR | BB | K | #P | AVG | OBP | SLG |
|---|---|---|---|---|---|---|---|---|---|---|---|---|
 Henry Bolte | 1-2 | 2 | 3 | 1 | 1 | 1 | 3 | 0 | 27 | .275 | .358 | .395 |
 Jeff McNeil | 1-5 | 5 | 0 | 1 | 1 | 0 | 0 | 0 | 14 | .268 | .317 | .372 |
 Zack Gelof | 1-4 | 4 | 2 | 1 | 2 | 0 | 0 | 0 | 16 | .257 | .320 | .468 |
 Lawrence Butler | 0-4 | 4 | 0 | 0 | 0 | 0 | 0 | 3 | 21 | .229 | .321 | .369 |
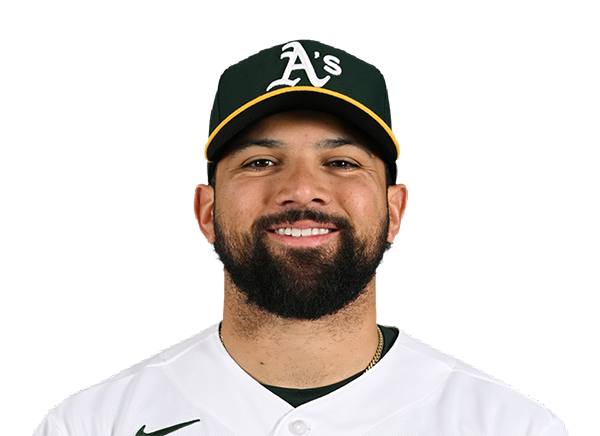 Carlos Cortes | 2-2 | 2 | 0 | 2 | 1 | 0 | 0 | 0 | 8 | .262 | .329 | .397 |
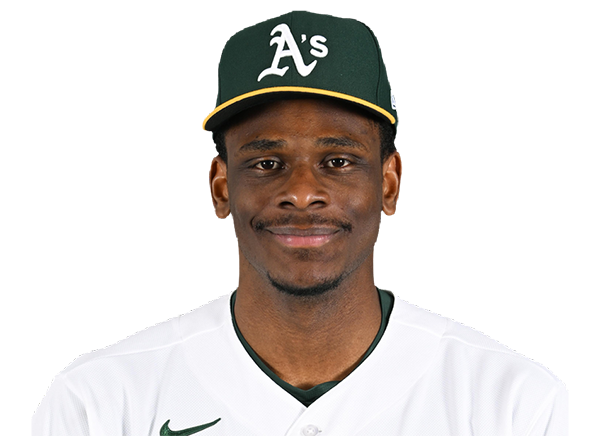 Denzel Clarke | 0-2 | 2 | 0 | 0 | 0 | 0 | 0 | 2 | 10 | .154 | .214 | .169 |
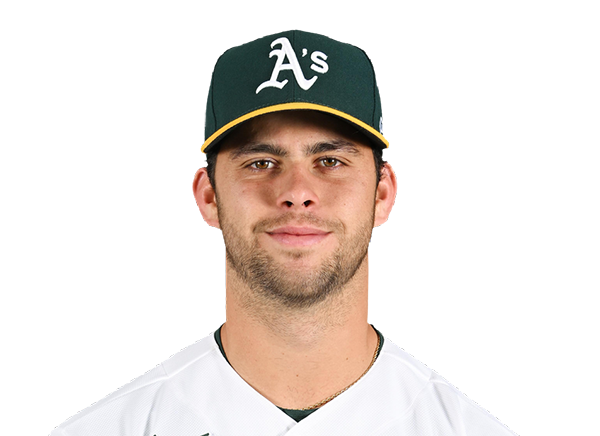 Max Muncy | 1-4 | 4 | 0 | 1 | 0 | 0 | 0 | 3 | 20 | .226 | .293 | .391 |
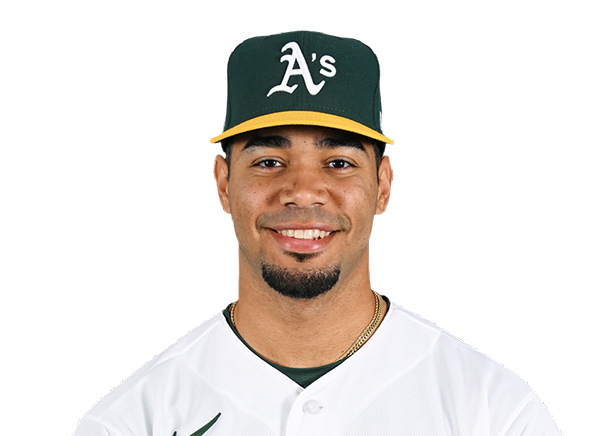 Darell Hernaiz | 0-0 | 0 | 0 | 0 | 0 | 0 | 0 | 0 | 0 | .234 | .316 | .277 |
 Donovan Walton | 0-3 | 3 | 1 | 0 | 0 | 0 | 1 | 0 | 14 | .265 | .376 | .431 |
 Alika Williams | 0-4 | 4 | 0 | 0 | 0 | 0 | 0 | 0 | 14 | .267 | .304 | .428 |
 Jonah Heim | 0-4 | 4 | 0 | 0 | 0 | 0 | 0 | 2 | 12 | .210 | .269 | .386 |
Toronto Blue Jays
| Player | IP | H | R | ER | BB | K | HR | PC-ST | ERA | PC |
|---|---|---|---|---|---|---|---|---|---|---|
 Dylan Cease | 5.0 | 4 | 5 | 4 | 2 | 6 | 1 | 94-55 | 2.40 | 94 |
 Brendon Little | 1.0 | 0 | 0 | 0 | 0 | 2 | 0 | 12-8 | 7.23 | 12 |
 Paul Sewald | 0.2 | 0 | 0 | 0 | 0 | 1 | 0 | 11-9 | 5.21 | 11 |
 Mason Fluharty | 0.1 | 0 | 0 | 0 | 0 | 0 | 0 | 2-1 | 3.30 | 2 |
 Tyler Rogers | 1.0 | 0 | 0 | 0 | 0 | 1 | 0 | 13-8 | 1.81 | 13 |
 Louis Varland | 0.2 | 2 | 1 | 1 | 2 | 0 | 0 | 24-14 | 1.26 | 24 |
Athletics
| Player | IP | H | R | ER | BB | K | HR | PC-ST | ERA | PC |
|---|---|---|---|---|---|---|---|---|---|---|
 Jacob Lopez | 6.0 | 7 | 4 | 4 | 1 | 1 | 2 | 93-63 | 4.78 | 93 |
 Luis Medina | 1.2 | 1 | 0 | 0 | 1 | 2 | 0 | 25-14 | 3.44 | 25 |
 Hogan Harris | 1.1 | 1 | 1 | 1 | 1 | 1 | 1 | 25-19 | 3.45 | 25 |
H2H / Season Series
ATH6–5
TOR
TOR5–2
ATH
TOR8–7
ATH
TOR3–2
ATH
Last 5 Games
| Date | Opponent | Result |
|---|---|---|
| Sep 7 | @ ATH | L5–6 |
| Sep 6 |  @ KC | L1–6 |
| Sep 5 | @ KC | W4–3 |
| Sep 4 | @ KC | W9–2 |
| Sep 3 |  @ CLE | W6–3 |
| Date | Opponent | Result |
|---|---|---|
| Sep 7 | vs TOR | W6–5 |
| Sep 6 |  @ SEA | L0–2 |
| Sep 5 | @ SEA | W6–2 |
| Sep 4 | @ SEA | W7–6 |
| Sep 3 | @ SEA | W7–4 |
Standings
American League
| Team | W | L | PCT | GB | DIFF | STRK |
|---|---|---|---|---|---|---|
1 Rays | 85 | 58 | .594 | - | +47 | L1 |
2 White Sox | 75 | 68 | .524 | 10 | +49 | W1 |
3 Astros | 73 | 71 | .507 | 12.5 | -38 | L2 |
4 Yankees | 81 | 62 | .566 | 4 | +117 | L1 |
5 Red Sox | 80 | 65 | .552 | 6 | +89 | W5 |
| 6Guardians | 73 | 72 | .503 | 13 | -16 | L1 |
| 7Blue Jays | 72 | 73 | .497 | 14 | -39 | L2 |
8 Rangers | 71 | 73 | .493 | 14.5 | -44 | W1 |
9 Orioles | 70 | 75 | .483 | 16 | -27 | W1 |
10 Twins | 68 | 76 | .472 | 17.5 | -49 | L2 |
| 11Mariners | 67 | 77 | .465 | 18.5 | -71 | W1 |
12 Tigers | 66 | 78 | .458 | 19.5 | +51 | W1 |
| 13Royals | 64 | 81 | .441 | 22 | -89 | L1 |
| 14Athletics | 58 | 87 | .400 | 28 | -187 | W1 |
15 Angels | 54 | 90 | .375 | 31.5 | -80 | L2 |
National League
| Team | W | L | PCT | GB | DIFF | STRK |
|---|---|---|---|---|---|---|
1 Brewers | 89 | 56 | .614 | - | +169 | W1 |
2 Dodgers | 87 | 57 | .604 | 1.5 | +155 | W5 |
3 Braves | 85 | 59 | .590 | 3.5 | +119 | L1 |
4 Phillies | 81 | 63 | .563 | 7.5 | +35 | W1 |
5 Cubs | 81 | 64 | .559 | 8 | +131 | L2 |
6 Diamondbacks | 77 | 68 | .531 | 12 | 0 | W3 |
7 Padres | 76 | 68 | .528 | 12.5 | +9 | W2 |
8 Marlins | 72 | 73 | .497 | 17 | +10 | L1 |
9 Cardinals | 72 | 73 | .497 | 17 | -10 | L1 |
10 Pirates | 71 | 73 | .493 | 17.5 | +26 | W1 |
11 Reds | 69 | 75 | .479 | 19.5 | -108 | L1 |
12 Nationals | 67 | 79 | .459 | 22.5 | +8 | L5 |
13 Mets | 66 | 78 | .458 | 22.5 | -43 | W2 |
14 Giants | 60 | 85 | .414 | 29 | -74 | W1 |
15 Rockies | 55 | 88 | .385 | 33 | -140 | L1 |
TOR
VS
ATH
Pitchers
Dylan Cease
Catchers
Alejandro Kirk
Infielders
Vladimir Guerrero Jr.
Kazuma Okamoto
Ernie Clement
Andres Gimenez
Outfielders
Brett Bateman
Nathan Lukes
Myles Straw
Designated Hitters
George Springer
Pitchers
Jacob Lopez
Catchers
Jonah Heim
Infielders
Jeff McNeil
Zack Gelof
Donovan Walton
Alika Williams
Outfielders
Henry Bolte
Lawrence Butler
Carlos Cortes
Designated Hitters
Max Muncy
Blue Jays
VS
Athletics
Batting
145
Team Games Played
145
4894
At Bats
4925
1212
Hits
1212
557
Runs Batted In
610
138
Home Runs
175
72
Stolen Bases
82
.248
Batting Average
.246
585
Runs
637
232
Doubles
223
8
Triples
14
1874
Total Bases
1988
403
Walks
477
1038
Strikeouts
1245
.309
On Base Percentage
.319
.383
Slugging Percentage
.404
.692
OBP Pct + SLG Pct
.723
145
Games Played
145
145
Games Started
145
53
Hit By Pitch
65
0.0
Wins Above Replacement
0.0
0.0
Offensive Wins Above Replacement
0.0
15
Caught Stealing
28
1
Is Qualified
1
583.6
Runs Created
633.5
4.1
Runs Created Per 27 Outs
4.4
.074
Walks Per Plate Appearance
.087
0.39
Walk To Strikeout Ratio
0.38
.135
Isolated Power
.158
.229
Secondary Average
.265
3.80
Pitches Per Plate Appearance
3.81
378
Extra Base Hits
412
5421
Plate Appearances
5513
35.5
At Bats Per Home Run
28.1
23
Sacrifice Hit
19
45
Sacrifice Flies
25
Pitching
145
Team Games Played
145
44
Quality Starts
30
72
Wins
58
73
Losses
87
49
Saves
36
93
Holds
81
1142
Hits
1341
563
Earned runs
769
150
Home Runs
215
532
Walks
573
1257
Strikeouts
1224
8.8
Strikeouts Per 9 Innings
8.6
148.9
Pitches Per Start
153.2
1.30
Walks Plus Hits Per Inning Pitched
1.49
3.93
Earned Run Average
5.40
73
Losses
87
1289.0
Innings pitched
1282.0
.497
Win Percentage
.400
64
Save Opportunities
63
.236
Opponent Batting Average
.268
.315
Opponent's On-base pct.
.348
.373
Opponent's Slugging pct.
.460
.688
Opponent's OPB Pct + SLG Pct
.808
4830
At Bats
4995
190
Doubles
266
9
Triples
22
40
Batters Hit
69
136
Stolen Bases
95
145
Games Played
145
1
Complete Games
1
11
Shutouts
6
46
Wild Pitches
45
592
Runs Batted In
799
8
Balks
8
1289.0
Innings pitched
1282.0
8.8
Strikeouts Per 9 Innings
8.6
42
Caught Stealing
37
145
Games Started
145
0.0
Wins Above Replacement
0.0
1
Is Qualified
1
624
Runs
824
563
Earned Runs
769
1800
Total Bases
2296
Fielding
145
Team Games Played
145
1289
Full Innings
1282
5172
Total Chances
5010
3867
Putouts
3846
1219
Assists
1095
86
Errors
69
232
Double Plays
223
0.983
Fielding Percentage
0.986
35.5
Range Factor
34.7
0.0
Zone Rating
0.0
145
Games Played
145
0
Games Started
0
0.0
Defensive Wins Above Replacement
0.0
1
Qualified
1