

Blue Jays vs Athletics Live Score (9 Sep, 2026)
Game Information
Stage
STD
Season
2026
First Pitch
Tue, Sep 8, 9:40 pm
Venue
Sutter Health Park
Location
Sacramento, California
Venue Type
Outdoor
Broadcast
MLB.TV
Attendance
7,632
Live Situation
0Balls
3Strikes
0Outs
—Pitcher
—At Bat
Pitch Sequence
1
STRIKE FOUL
Sinker
96 MPH
2
STRIKE FOUL
Sinker
95 MPH
3
STRIKE SWINGING
Four-seam FB
96 MPH
Injury Report
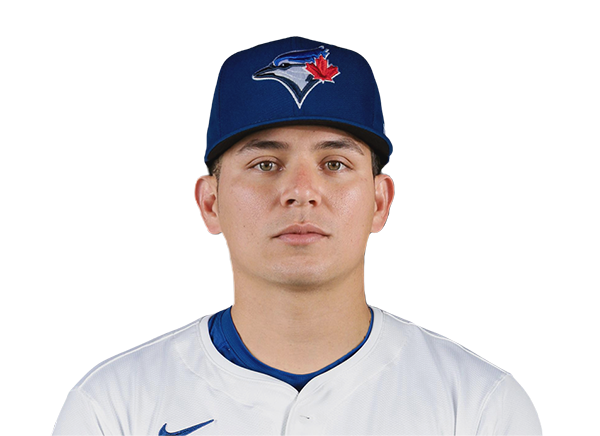



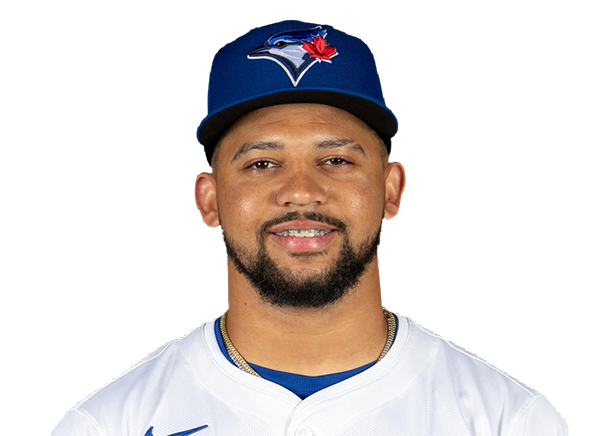
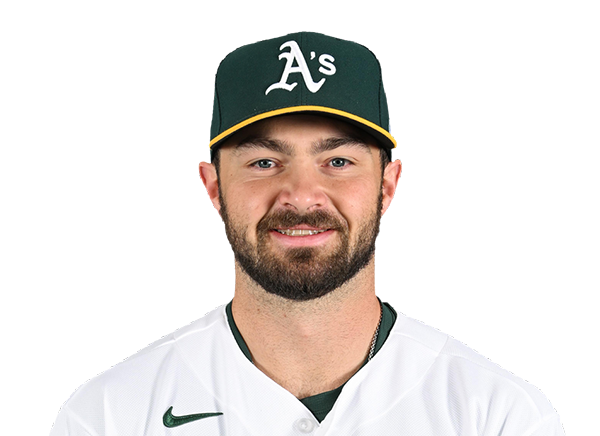
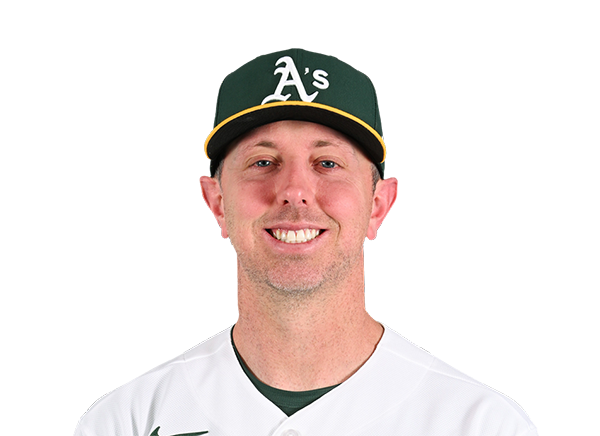

Team Stats
 TOR
ATH


4
Runs
2
11
Hits
6
0
Errors
0
2
Home Runs
2
1
Walks
1
6
Strikeouts
6
Player Box Score
Toronto Blue Jays
| Player | H-AB | AB | R | H | RBI | HR | BB | K | #P | AVG | OBP | SLG |
|---|---|---|---|---|---|---|---|---|---|---|---|---|
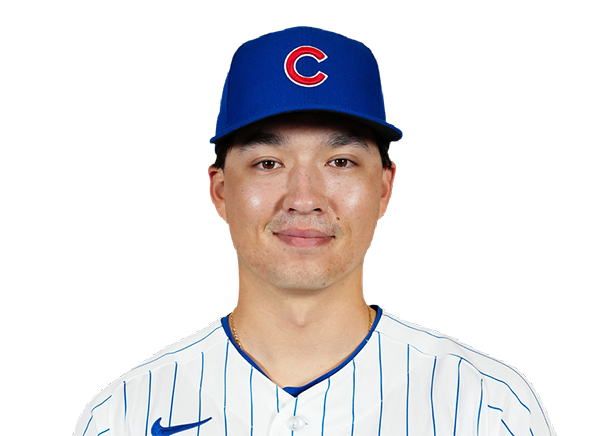 Brett Bateman | 1-4 | 4 | 0 | 1 | 0 | 0 | 0 | 1 | 18 | .330 | .398 | .385 |
 Nathan Lukes | 1-4 | 4 | 1 | 1 | 0 | 0 | 0 | 0 | 13 | .272 | .321 | .390 |
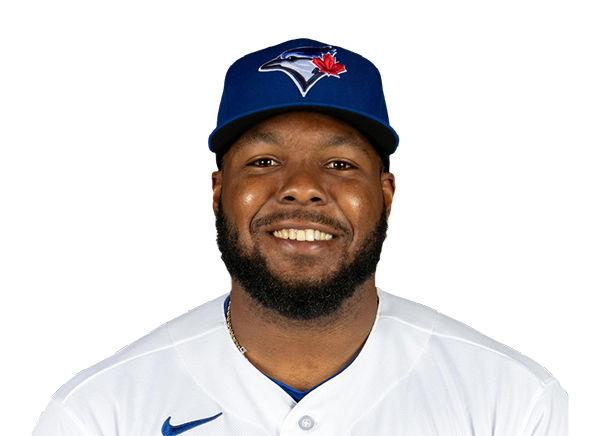 Vladimir Guerrero Jr. | 2-4 | 4 | 1 | 2 | 0 | 0 | 0 | 1 | 13 | .261 | .330 | .354 |
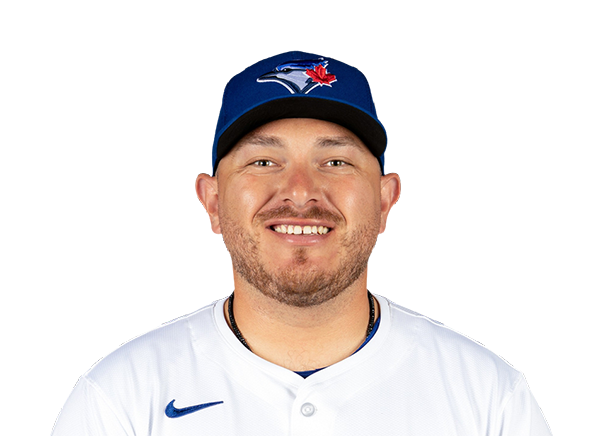 Alejandro Kirk | 1-4 | 4 | 0 | 1 | 1 | 0 | 0 | 1 | 18 | .275 | .343 | .419 |
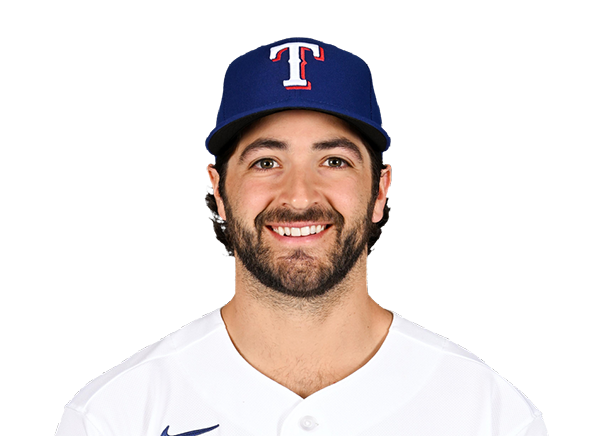 Josh Smith | 2-4 | 4 | 1 | 2 | 1 | 1 | 0 | 1 | 19 | .227 | .317 | .358 |
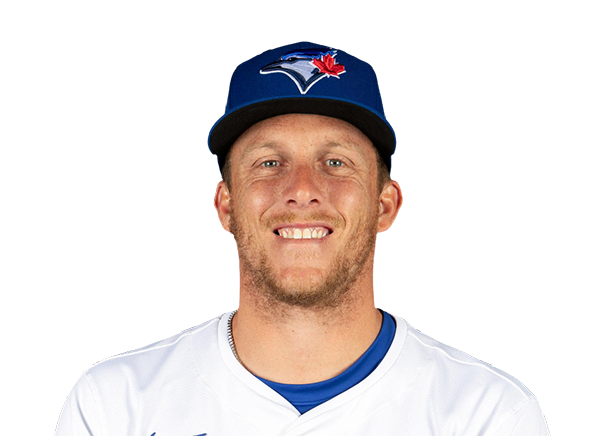 Myles Straw | 0-0 | 0 | 0 | 0 | 0 | 0 | 0 | 0 | 0 | .238 | .301 | .349 |
 Kazuma Okamoto | 2-4 | 4 | 1 | 2 | 1 | 1 | 0 | 0 | 18 | .234 | .308 | .454 |
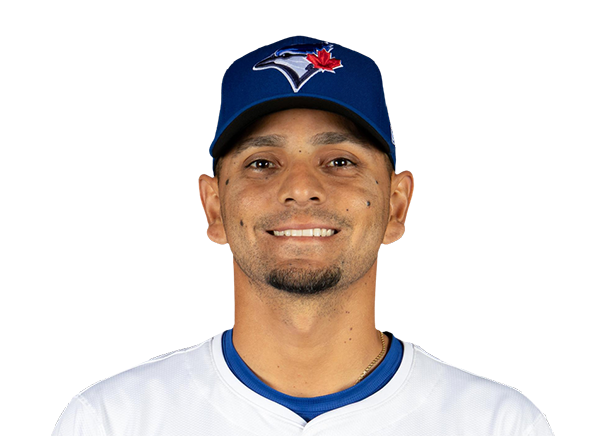 Andres Gimenez | 1-3 | 3 | 0 | 1 | 0 | 0 | 1 | 0 | 18 | .245 | .291 | .362 |
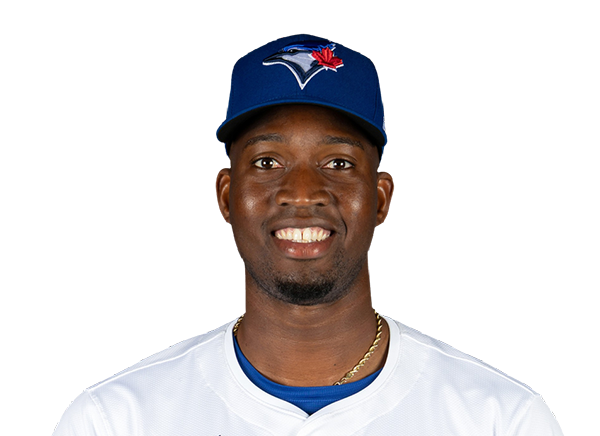 Jesus Sanchez | 1-4 | 4 | 0 | 1 | 0 | 0 | 0 | 2 | 21 | .260 | .318 | .416 |
 Ernie Clement | 0-4 | 4 | 0 | 0 | 0 | 0 | 0 | 0 | 12 | .273 | .299 | .382 |
Athletics
| Player | H-AB | AB | R | H | RBI | HR | BB | K | #P | AVG | OBP | SLG |
|---|---|---|---|---|---|---|---|---|---|---|---|---|
 Henry Bolte | 2-4 | 4 | 0 | 2 | 0 | 0 | 0 | 2 | 14 | .278 | .359 | .397 |
 Jeff McNeil | 1-4 | 4 | 0 | 1 | 0 | 0 | 0 | 0 | 15 | .268 | .316 | .371 |
 Zack Gelof | 0-3 | 3 | 0 | 0 | 0 | 0 | 1 | 2 | 16 | .254 | .320 | .464 |
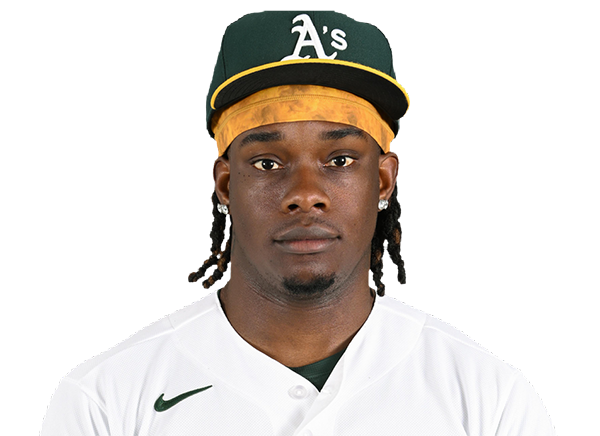 Lawrence Butler | 0-4 | 4 | 0 | 0 | 0 | 0 | 0 | 1 | 17 | .227 | .318 | .366 |
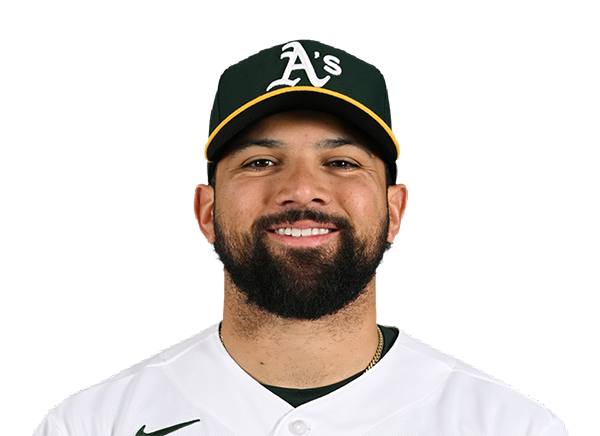 Carlos Cortes | 1-4 | 4 | 1 | 1 | 1 | 1 | 0 | 0 | 10 | .261 | .328 | .405 |
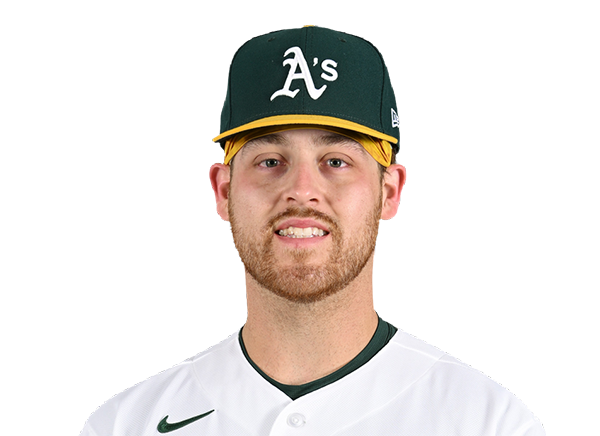 Tommy White | 0-4 | 4 | 0 | 0 | 0 | 0 | 0 | 1 | 10 | .248 | .266 | .320 |
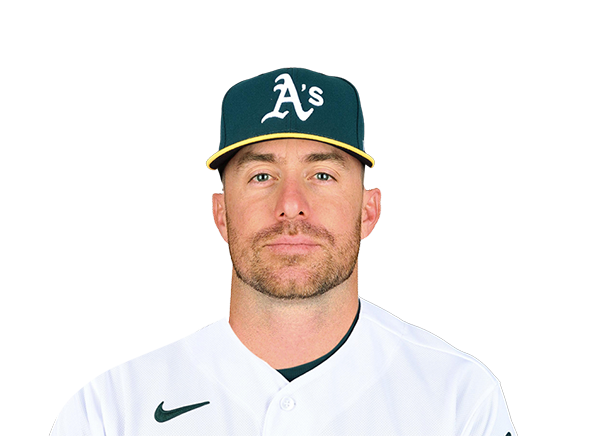 Donovan Walton | 2-3 | 3 | 1 | 2 | 1 | 1 | 0 | 0 | 8 | .272 | .380 | .451 |
 Alika Williams | 0-3 | 3 | 0 | 0 | 0 | 0 | 0 | 0 | 14 | .262 | .299 | .421 |
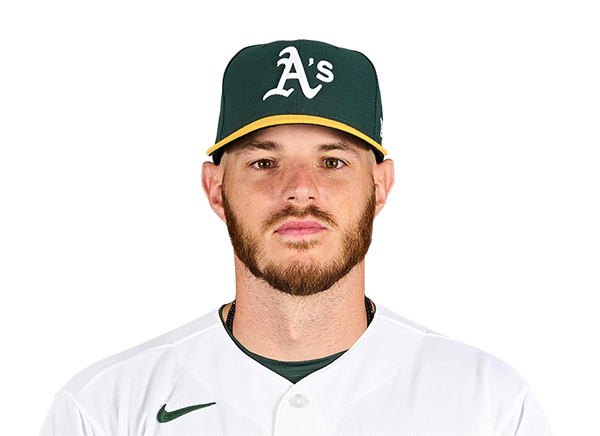 Jonah Heim | 0-3 | 3 | 0 | 0 | 0 | 0 | 0 | 0 | 7 | .208 | .267 | .382 |
Toronto Blue Jays
| Player | IP | H | R | ER | BB | K | HR | PC-ST | ERA | PC |
|---|---|---|---|---|---|---|---|---|---|---|
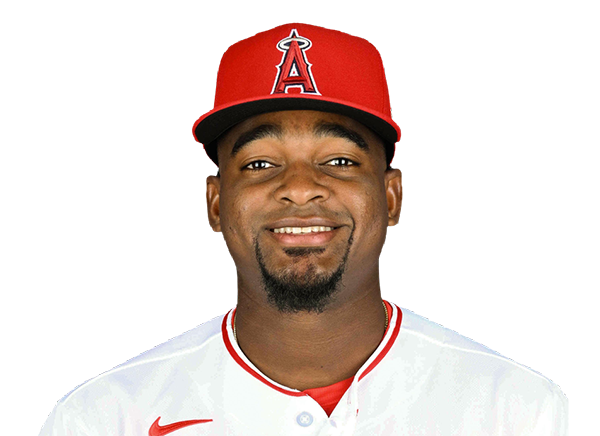 Jose Soriano | 7.0 | 6 | 2 | 2 | 1 | 3 | 2 | 89-60 | 3.48 | 89 |
 Spencer Miles | 2.0 | 0 | 0 | 0 | 0 | 3 | 0 | 22-19 | 2.77 | 22 |
Athletics
| Player | IP | H | R | ER | BB | K | HR | PC-ST | ERA | PC |
|---|---|---|---|---|---|---|---|---|---|---|
 Jack Perkins | 5.0 | 7 | 4 | 4 | 0 | 3 | 2 | 85-56 | 6.53 | 85 |
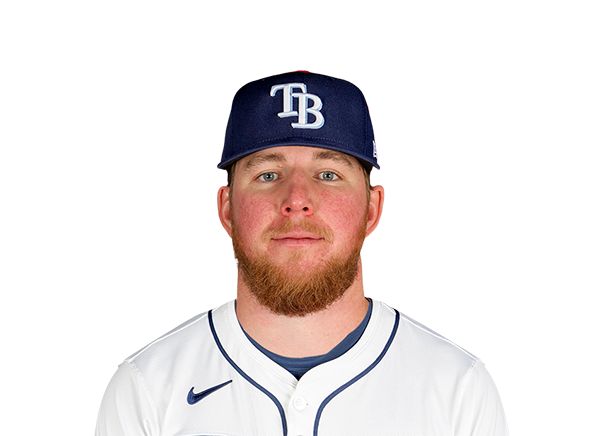 Chris Roycroft | 2.0 | 3 | 0 | 0 | 0 | 1 | 0 | 35-23 | 6.75 | 35 |
 Geoff Hartlieb | 2.0 | 1 | 0 | 0 | 1 | 2 | 0 | 30-18 | 4.58 | 30 |
H2H / Season Series
ATH2–4
TOR
ATH6–5
TOR
TOR5–2
ATH
TOR8–7
ATH
TOR3–2
ATH
Last 5 Games
| Date | Opponent | Result |
|---|---|---|
| Sep 8 | @ ATH | W4–2 |
| Sep 7 | @ ATH | L5–6 |
| Sep 6 |  @ KC | L1–6 |
| Sep 5 | @ KC | W4–3 |
| Sep 4 | @ KC | W9–2 |
| Date | Opponent | Result |
|---|---|---|
| Sep 8 | vs TOR | L2–4 |
| Sep 7 | vs TOR | W6–5 |
| Sep 6 |  @ SEA | L0–2 |
| Sep 5 | @ SEA | W6–2 |
| Sep 4 | @ SEA | W7–6 |
Standings
American League
| Team | W | L | PCT | GB | DIFF | STRK |
|---|---|---|---|---|---|---|
1 Rays | 86 | 58 | .597 | - | +53 | W1 |
2 White Sox | 75 | 69 | .521 | 11 | +43 | L1 |
3 Astros | 74 | 71 | .510 | 12.5 | -37 | W1 |
4 Yankees | 82 | 62 | .569 | 4 | +119 | W1 |
5 Red Sox | 80 | 66 | .548 | 7 | +84 | L1 |
6 Guardians | 74 | 72 | .507 | 13 | -12 | W1 |
| 7Blue Jays | 73 | 73 | .500 | 14 | -37 | W1 |
8 Rangers | 72 | 73 | .497 | 14.5 | -39 | W2 |
9 Orioles | 70 | 76 | .479 | 17 | -31 | L1 |
10 Twins | 69 | 76 | .476 | 17.5 | -48 | W1 |
| 11Mariners | 67 | 78 | .462 | 19.5 | -76 | L1 |
12 Tigers | 66 | 79 | .455 | 20.5 | +50 | L1 |
| 13Royals | 64 | 82 | .438 | 23 | -91 | L2 |
| 14Athletics | 58 | 88 | .397 | 29 | -189 | L1 |
15 Angels | 55 | 90 | .379 | 31.5 | -75 | W1 |
National League
| Team | W | L | PCT | GB | DIFF | STRK |
|---|---|---|---|---|---|---|
1 Brewers | 90 | 56 | .616 | - | +170 | W2 |
2 Dodgers | 88 | 57 | .607 | 1.5 | +156 | W6 |
3 Braves | 85 | 60 | .586 | 4.5 | +113 | L2 |
4 Phillies | 81 | 64 | .559 | 8.5 | +34 | L1 |
5 Cubs | 81 | 65 | .555 | 9 | +130 | L3 |
6 Diamondbacks | 78 | 68 | .534 | 12 | +2 | W4 |
7 Padres | 77 | 68 | .531 | 12.5 | +10 | W3 |
8 Pirates | 72 | 73 | .497 | 17.5 | +32 | W2 |
9 Marlins | 72 | 74 | .493 | 18 | +8 | L2 |
10 Cardinals | 72 | 74 | .493 | 18 | -11 | L2 |
11 Reds | 69 | 76 | .476 | 20.5 | -109 | L2 |
12 Mets | 67 | 78 | .462 | 22.5 | -41 | W3 |
13 Nationals | 67 | 80 | .456 | 23.5 | +7 | L6 |
14 Giants | 61 | 85 | .418 | 29 | -73 | W2 |
15 Rockies | 55 | 89 | .382 | 34 | -142 | L2 |
TOR
VS
ATH
Pitchers
Jose Soriano
Catchers
Alejandro Kirk
Infielders
Vladimir Guerrero Jr.
Kazuma Okamoto
Andres Gimenez
Ernie Clement
Outfielders
Brett Bateman
Nathan Lukes
Josh Smith
Designated Hitters
Jesus Sanchez
Pitchers
Jack Perkins
Catchers
Jonah Heim
Infielders
Jeff McNeil
Zack Gelof
Donovan Walton
Alika Williams
Outfielders
Henry Bolte
Lawrence Butler
Carlos Cortes
Designated Hitters
Tommy White
Blue Jays
VS
Athletics
Batting
146
Team Games Played
146
4929
At Bats
4957
1223
Hits
1218
560
Runs Batted In
612
140
Home Runs
177
72
Stolen Bases
82
.248
Batting Average
.246
589
Runs
639
232
Doubles
223
8
Triples
14
1891
Total Bases
2000
404
Walks
478
1044
Strikeouts
1251
.309
On Base Percentage
.319
.384
Slugging Percentage
.403
.693
OBP Pct + SLG Pct
.722
146
Games Played
146
146
Games Started
146
53
Hit By Pitch
65
0.0
Wins Above Replacement
0.0
0.0
Offensive Wins Above Replacement
0.0
16
Caught Stealing
28
1
Is Qualified
1
588.1
Runs Created
635.7
4.1
Runs Created Per 27 Outs
4.4
.074
Walks Per Plate Appearance
.086
0.39
Walk To Strikeout Ratio
0.38
.136
Isolated Power
.158
.229
Secondary Average
.265
3.80
Pitches Per Plate Appearance
3.81
380
Extra Base Hits
414
5457
Plate Appearances
5546
35.2
At Bats Per Home Run
28.0
23
Sacrifice Hit
19
45
Sacrifice Flies
25
Pitching
146
Team Games Played
146
45
Quality Starts
30
73
Wins
58
73
Losses
88
50
Saves
36
93
Holds
81
1148
Hits
1352
565
Earned runs
773
152
Home Runs
217
533
Walks
574
1263
Strikeouts
1230
8.8
Strikeouts Per 9 Innings
8.6
148.6
Pitches Per Start
153.1
1.30
Walks Plus Hits Per Inning Pitched
1.49
3.92
Earned Run Average
5.39
73
Losses
88
1298.0
Innings pitched
1291.0
.500
Win Percentage
.397
65
Save Opportunities
63
.236
Opponent Batting Average
.269
.314
Opponent's On-base pct.
.348
.373
Opponent's Slugging pct.
.460
.687
Opponent's OPB Pct + SLG Pct
.808
4862
At Bats
5030
190
Doubles
266
9
Triples
22
40
Batters Hit
69
136
Stolen Bases
95
146
Games Played
146
1
Complete Games
1
11
Shutouts
6
47
Wild Pitches
46
594
Runs Batted In
802
8
Balks
8
1298.0
Innings pitched
1291.0
8.8
Strikeouts Per 9 Innings
8.6
42
Caught Stealing
38
146
Games Started
146
0.0
Wins Above Replacement
0.0
1
Is Qualified
1
626
Runs
828
565
Earned Runs
773
1812
Total Bases
2313
Fielding
146
Team Games Played
146
1298
Full Innings
1291
5214
Total Chances
5049
3894
Putouts
3873
1234
Assists
1107
86
Errors
69
232
Double Plays
223
0.984
Fielding Percentage
0.986
35.6
Range Factor
34.7
0.0
Zone Rating
0.0
146
Games Played
146
0
Games Started
0
0.0
Defensive Wins Above Replacement
0.0
1
Qualified
1