

Blue Jays vs Guardians Live Score (2 Sep, 2026)
Game Information
Stage
STD
Season
2026
First Pitch
Wed, Sep 2, 6:40 pm
Venue
Progressive Field
Location
Cleveland, Ohio
Venue Type
Outdoor
Broadcast
MLB.TV
Attendance
17,248
Live Situation
2Balls
3Strikes
0Outs
—Pitcher
—At Bat
Pitch Sequence
1
STRIKE FOUL
Four-seam FB
93 MPH
2
STRIKE FOUL
Four-seam FB
93 MPH
3
BALL
Slider
86 MPH
4
BALL
Curve
82 MPH
5
STRIKE FOUL
Slider
87 MPH
6
STRIKE FOUL
Slider
85 MPH
7
STRIKE SWINGING
Four-seam FB
94 MPH
Injury Report



Team Stats
 TOR
CLE


11
Runs
0
15
Hits
6
1
Errors
1
2
Home Runs
0
2
Walks
0
8
Strikeouts
9
Player Box Score
Toronto Blue Jays
| Player | H-AB | AB | R | H | RBI | HR | BB | K | #P | AVG | OBP | SLG |
|---|---|---|---|---|---|---|---|---|---|---|---|---|
 Brett Bateman | 1-4 | 4 | 3 | 1 | 0 | 0 | 1 | 0 | 17 | .314 | .368 | .384 |
 George Springer | 1-4 | 4 | 1 | 1 | 1 | 0 | 0 | 1 | 12 | .251 | .326 | .417 |
 Jesus Sanchez | 0-1 | 1 | 0 | 0 | 0 | 0 | 0 | 0 | 2 | .262 | .321 | .423 |
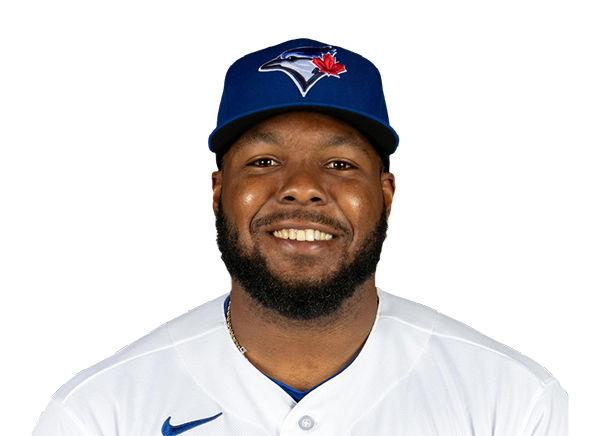 Vladimir Guerrero Jr. | 3-4 | 4 | 1 | 3 | 5 | 1 | 0 | 0 | 9 | .262 | .333 | .360 |
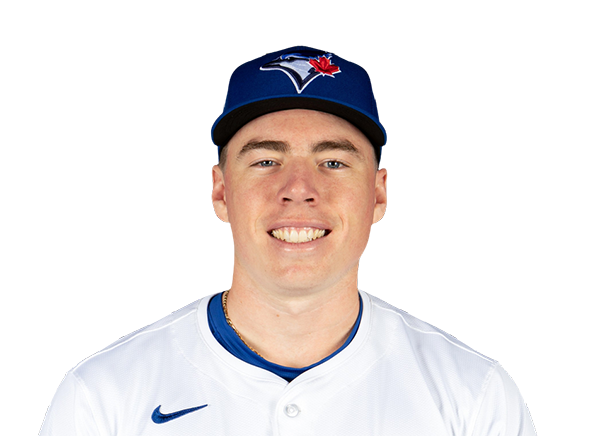 Sean Keys | 1-1 | 1 | 1 | 1 | 0 | 0 | 0 | 0 | 3 | .189 | .211 | .297 |
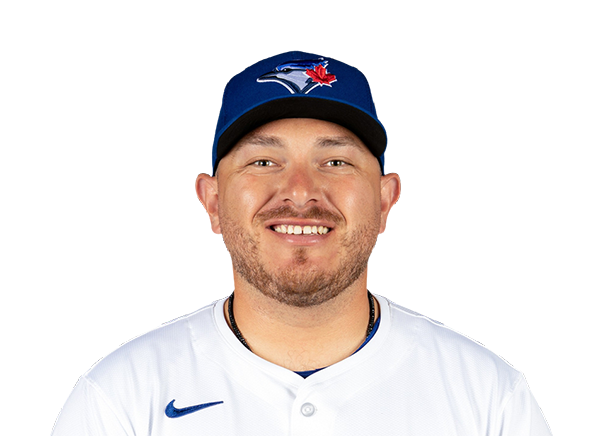 Alejandro Kirk | 0-5 | 5 | 0 | 0 | 0 | 0 | 0 | 2 | 23 | .271 | .344 | .408 |
 Kazuma Okamoto | 0-4 | 4 | 0 | 0 | 0 | 0 | 0 | 3 | 17 | .227 | .302 | .440 |
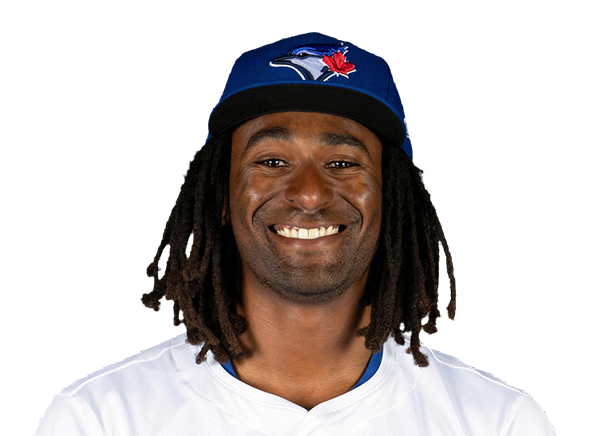 Charles McAdoo | 1-1 | 1 | 0 | 1 | 0 | 0 | 0 | 0 | 4 | .243 | .288 | .351 |
 Nathan Lukes | 2-5 | 5 | 0 | 2 | 1 | 0 | 0 | 1 | 15 | .263 | .316 | .385 |
 Ernie Clement | 1-5 | 5 | 1 | 1 | 0 | 0 | 0 | 0 | 12 | .275 | .300 | .387 |
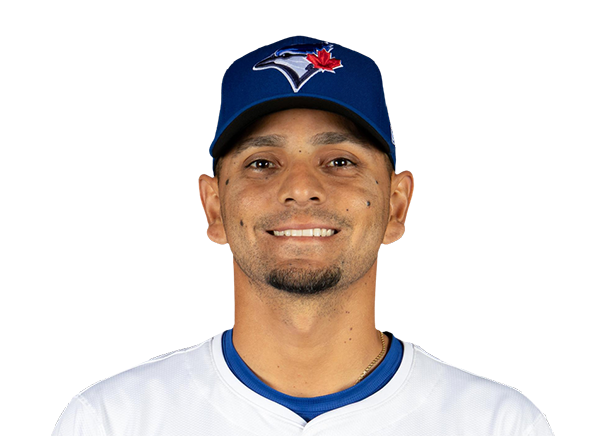 Andres Gimenez | 2-3 | 3 | 1 | 2 | 0 | 0 | 0 | 1 | 18 | .243 | .289 | .356 |
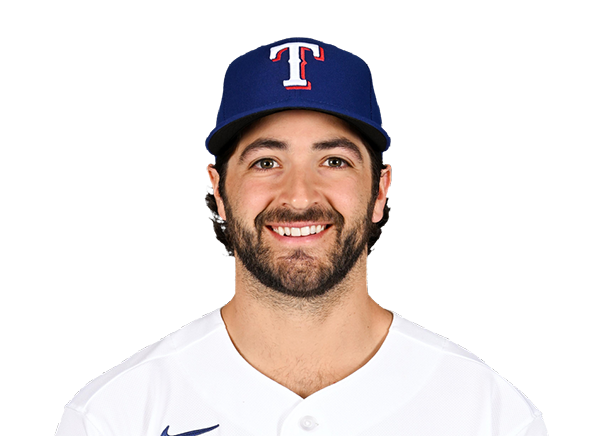 Josh Smith | 1-2 | 2 | 1 | 1 | 1 | 1 | 0 | 0 | 4 | .223 | .305 | .325 |
 Myles Straw | 2-3 | 3 | 2 | 2 | 1 | 0 | 1 | 0 | 16 | .232 | .293 | .348 |
Cleveland Guardians
| Player | H-AB | AB | R | H | RBI | HR | BB | K | #P | AVG | OBP | SLG |
|---|---|---|---|---|---|---|---|---|---|---|---|---|
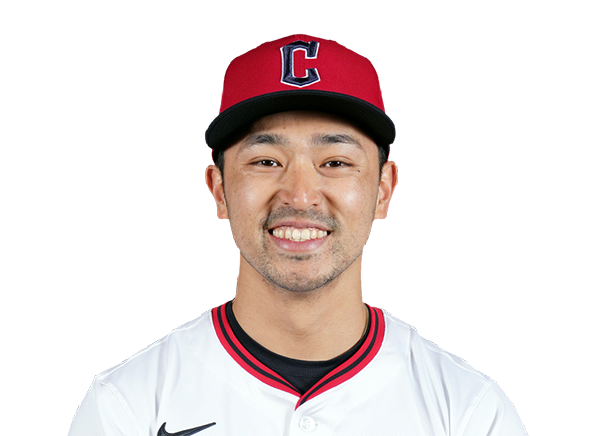 Steven Kwan | 0-3 | 3 | 0 | 0 | 0 | 0 | 0 | 0 | 11 | .273 | .374 | .333 |
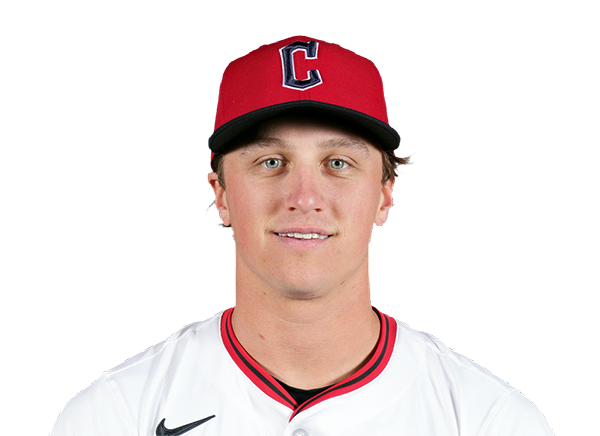 Petey Halpin | 0-1 | 1 | 0 | 0 | 0 | 0 | 0 | 0 | 2 | .218 | .256 | .320 |
 Chase DeLauter | 3-4 | 4 | 0 | 3 | 0 | 0 | 0 | 0 | 10 | .294 | .365 | .455 |
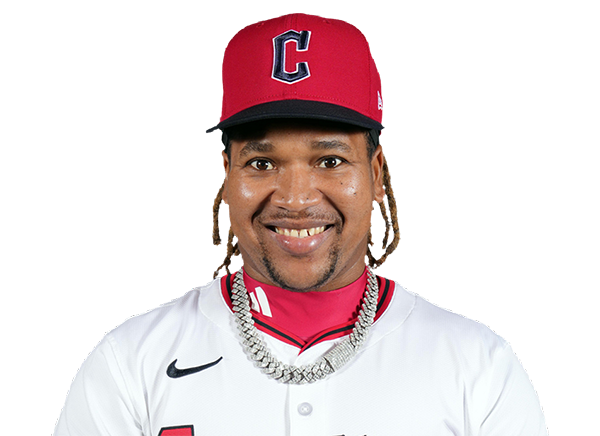 Jose Ramirez | 0-3 | 3 | 0 | 0 | 0 | 0 | 0 | 0 | 13 | .242 | .336 | .388 |
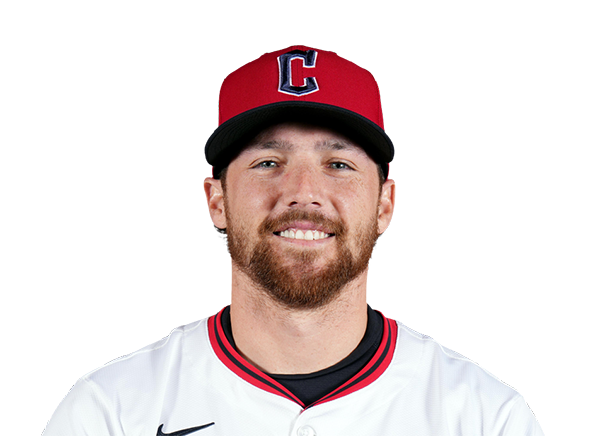 Daniel Schneemann | 0-1 | 1 | 0 | 0 | 0 | 0 | 0 | 1 | 5 | .206 | .274 | .320 |
 Jo Adell | 0-3 | 3 | 0 | 0 | 0 | 0 | 0 | 0 | 15 | .241 | .296 | .406 |
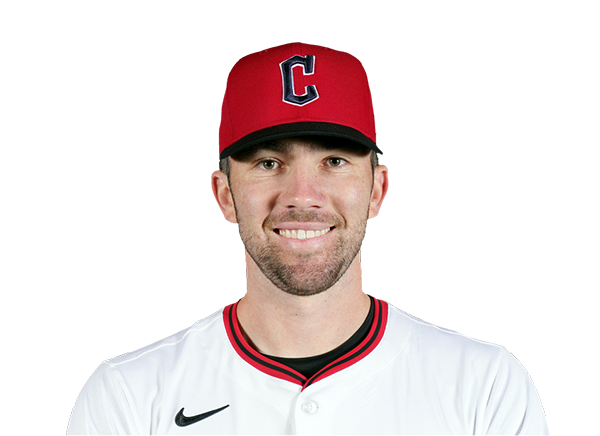 David Fry | 1-1 | 1 | 0 | 1 | 0 | 0 | 0 | 0 | 4 | .190 | .312 | .347 |
 Nathaniel Lowe | 0-4 | 4 | 0 | 0 | 0 | 0 | 0 | 2 | 19 | .254 | .318 | .453 |
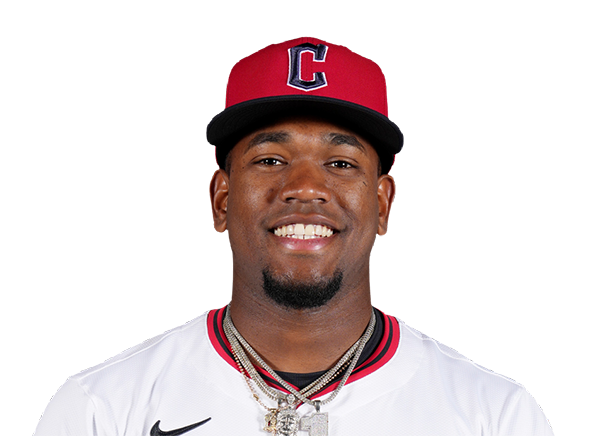 Angel Martinez | 0-3 | 3 | 0 | 0 | 0 | 0 | 0 | 2 | 22 | .247 | .286 | .438 |
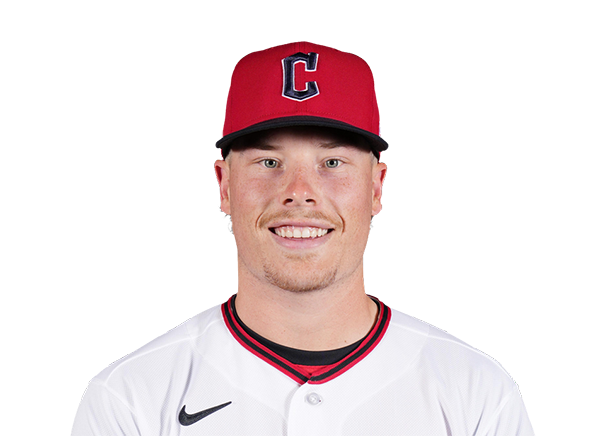 Travis Bazzana | 0-3 | 3 | 0 | 0 | 0 | 0 | 0 | 1 | 18 | .235 | .327 | .362 |
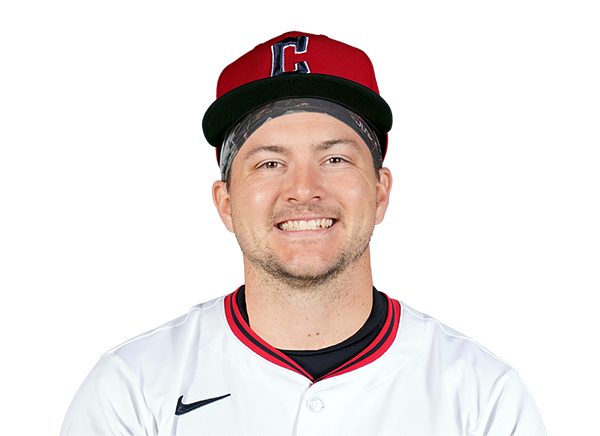 Patrick Bailey | 2-3 | 3 | 0 | 2 | 0 | 0 | 0 | 1 | 9 | .206 | .272 | .332 |
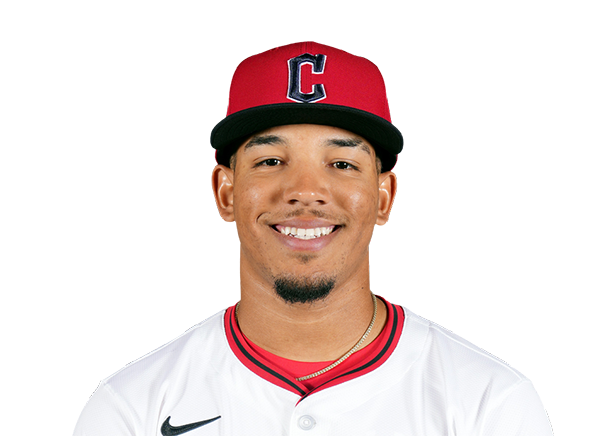 Angel Genao | 0-3 | 3 | 0 | 0 | 0 | 0 | 0 | 2 | 15 | .253 | .314 | .367 |
Toronto Blue Jays
| Player | IP | H | R | ER | BB | K | HR | PC-ST | ERA | PC |
|---|---|---|---|---|---|---|---|---|---|---|
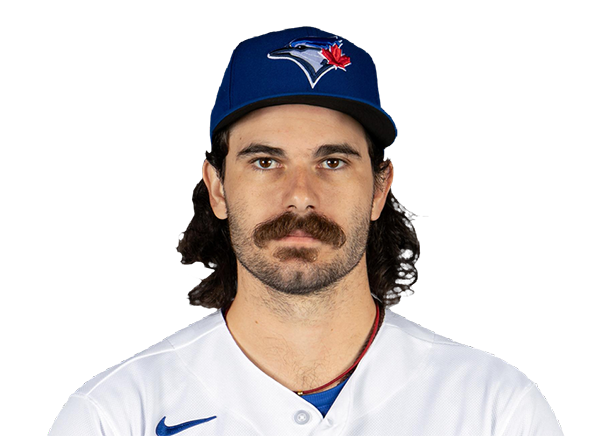 Dylan Cease | 6.0 | 4 | 0 | 0 | 0 | 4 | 0 | 83-56 | 2.25 | 83 |
 Paul Sewald | 1.0 | 0 | 0 | 0 | 0 | 1 | 0 | 18-12 | 5.32 | 18 |
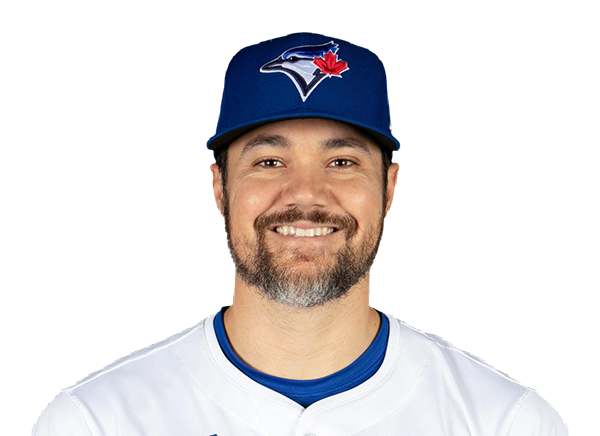 Brendon Little | 1.0 | 0 | 0 | 0 | 0 | 2 | 0 | 15-9 | 7.89 | 15 |
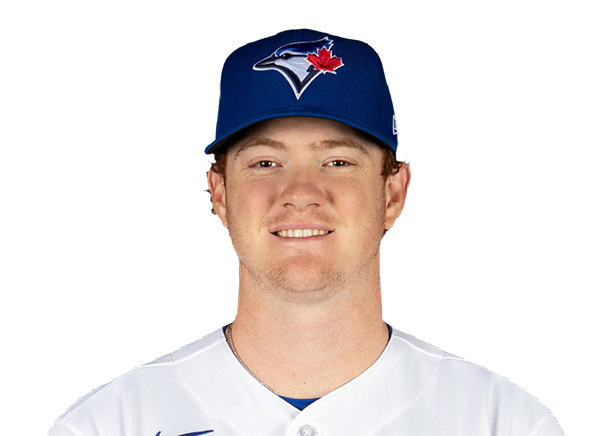 Braydon Fisher | 1.0 | 2 | 0 | 0 | 0 | 2 | 0 | 27-17 | 3.26 | 27 |
Cleveland Guardians
| Player | IP | H | R | ER | BB | K | HR | PC-ST | ERA | PC |
|---|---|---|---|---|---|---|---|---|---|---|
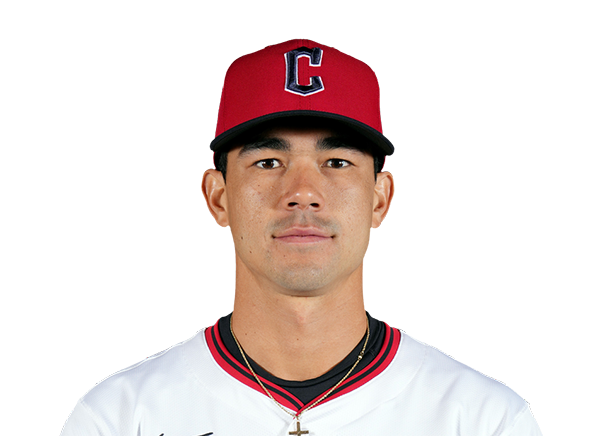 Joey Cantillo | 5.1 | 9 | 9 | 4 | 2 | 6 | 1 | 102-66 | 3.81 | 102 |
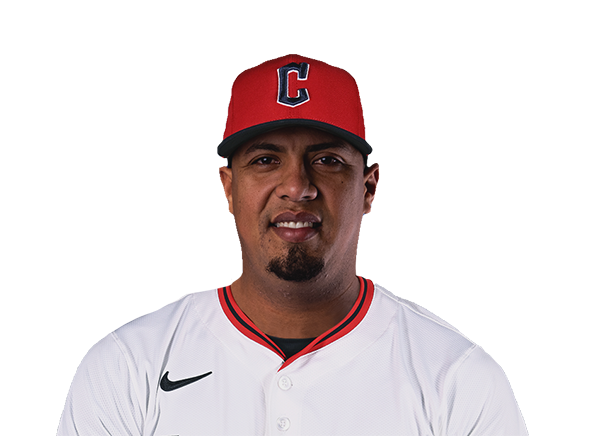 Carlos Hernandez | 2.0 | 3 | 1 | 1 | 0 | 2 | 1 | 25-16 | 4.50 | 25 |
 Austin Hedges | 1.2 | 3 | 1 | 1 | 0 | 0 | 0 | 25-17 | 6.23 | 25 |
H2H / Season Series
CLE0–11
TOR
CLE6–1
TOR
TOR4–2
CLE
TOR5–3
CLE
TOR6–8
CLE
Last 5 Games
| Date | Opponent | Result |
|---|---|---|
| Sep 2 | @ CLE | W11–0 |
| Sep 1 | @ CLE | L1–6 |
| Aug 30 |  vs SEA | W7–0 |
| Aug 29 | vs SEA | W4–3 |
| Aug 28 | vs SEA | W8–1 |
| Date | Opponent | Result |
|---|---|---|
| Sep 2 | vs TOR | L0–11 |
| Sep 1 | vs TOR | W6–1 |
| Aug 30 |  vs KC | W11–1 |
| Aug 29 | vs KC | L3–8 |
| Aug 28 | vs KC | L0–3 |
Standings
American League
| Team | W | L | PCT | GB | DIFF | STRK |
|---|---|---|---|---|---|---|
1 Rays | 83 | 56 | .597 | - | +51 | L1 |
2 White Sox | 73 | 65 | .529 | 9.5 | +45 | W1 |
3 Astros | 70 | 69 | .504 | 13 | -44 | L1 |
4 Yankees | 79 | 60 | .568 | 4 | +112 | W1 |
5 Red Sox | 75 | 65 | .536 | 8.5 | +77 | L2 |
| 6Guardians | 70 | 69 | .504 | 13 | -8 | L1 |
7 Rangers | 69 | 71 | .493 | 14.5 | -48 | L1 |
| 8Blue Jays | 69 | 71 | .493 | 14.5 | -44 | W1 |
9 Orioles | 69 | 71 | .493 | 14.5 | -20 | L2 |
10 Twins | 67 | 72 | .482 | 16 | -33 | W3 |
| 11Mariners | 66 | 74 | .471 | 17.5 | -65 | W2 |
12 Tigers | 63 | 75 | .457 | 19.5 | +42 | L3 |
| 13Royals | 62 | 77 | .446 | 21 | -86 | L2 |
14 Athletics | 54 | 86 | .386 | 29.5 | -194 | W1 |
15 Angels | 53 | 86 | .381 | 30 | -77 | L1 |
National League
| Team | W | L | PCT | GB | DIFF | STRK |
|---|---|---|---|---|---|---|
1 Brewers | 86 | 53 | .619 | - | +168 | W1 |
2 Dodgers | 82 | 56 | .594 | 3.5 | +148 | L1 |
3 Braves | 83 | 57 | .593 | 3.5 | +118 | W1 |
4 Phillies | 79 | 61 | .564 | 7.5 | +36 | L1 |
5 Cubs | 78 | 61 | .561 | 8 | +136 | L1 |
6 Diamondbacks | 74 | 67 | .525 | 13 | -1 | W1 |
7 Padres | 73 | 67 | .521 | 13.5 | +10 | L2 |
8 Marlins | 70 | 69 | .504 | 16 | +15 | W1 |
9 Cardinals | 69 | 70 | .496 | 17 | -10 | W1 |
10 Pirates | 68 | 72 | .486 | 18.5 | +26 | L1 |
11 Reds | 67 | 73 | .479 | 19.5 | -108 | W2 |
12 Nationals | 67 | 75 | .472 | 20.5 | +14 | L1 |
13 Mets | 63 | 77 | .450 | 23.5 | -50 | W1 |
14 Giants | 58 | 82 | .414 | 28.5 | -70 | W1 |
15 Rockies | 54 | 86 | .386 | 32.5 | -140 | W2 |
TOR
VS
CLE
Pitchers
Dylan Cease
Catchers
Alejandro Kirk
Infielders
Vladimir Guerrero Jr.
Kazuma Okamoto
Ernie Clement
Andres Gimenez
Outfielders
Brett Bateman
Nathan Lukes
Myles Straw
Designated Hitters
George Springer
Pitchers
Joey Cantillo
Catchers
Patrick Bailey
Infielders
Jose Ramirez
Nathaniel Lowe
Travis Bazzana
Angel Genao
Outfielders
Steven Kwan
Jo Adell
Angel Martinez
Designated Hitters
Chase DeLauter
Blue Jays
VS
Guardians
Batting
140
Team Games Played
139
4716
At Bats
4632
1160
Hits
1095
533
Runs Batted In
540
133
Home Runs
130
70
Stolen Bases
129
.246
Batting Average
.236
560
Runs
563
224
Doubles
210
8
Triples
13
1799
Total Bases
1721
384
Walks
498
1012
Strikeouts
1120
.307
On Base Percentage
.314
.381
Slugging Percentage
.372
.689
OBP Pct + SLG Pct
.686
140
Games Played
139
140
Games Started
139
51
Hit By Pitch
45
0.0
Wins Above Replacement
0.0
0.0
Offensive Wins Above Replacement
0.0
14
Caught Stealing
27
1
Is Qualified
1
556.1
Runs Created
569.0
4.0
Runs Created Per 27 Outs
4.1
.074
Walks Per Plate Appearance
.095
0.38
Walk To Strikeout Ratio
0.44
.135
Isolated Power
.135
.229
Secondary Average
.265
3.80
Pitches Per Plate Appearance
3.95
365
Extra Base Hits
353
5219
Plate Appearances
5240
35.5
At Bats Per Home Run
35.6
22
Sacrifice Hit
24
43
Sacrifice Flies
39
Pitching
140
Team Games Played
139
44
Quality Starts
51
69
Wins
70
71
Losses
69
46
Saves
40
90
Holds
101
1108
Hits
1098
544
Earned runs
510
144
Home Runs
156
512
Walks
453
1223
Strikeouts
1296
8.8
Strikeouts Per 9 Innings
9.5
149.0
Pitches Per Start
147.7
1.30
Walks Plus Hits Per Inning Pitched
1.26
3.93
Earned Run Average
3.72
71
Losses
69
1245.1
Innings pitched
1233.2
.493
Win Percentage
.504
61
Save Opportunities
54
.237
Opponent Batting Average
.236
.315
Opponent's On-base pct.
.310
.374
Opponent's Slugging pct.
.390
.688
Opponent's OPB Pct + SLG Pct
.700
4666
At Bats
4643
185
Doubles
215
9
Triples
15
35
Batters Hit
58
131
Stolen Bases
92
140
Games Played
139
1
Complete Games
0
11
Shutouts
4
44
Wild Pitches
53
573
Runs Batted In
541
6
Balks
2
1245.1
Innings pitched
1233.2
8.8
Strikeouts Per 9 Innings
9.5
41
Caught Stealing
19
140
Games Started
139
0.0
Wins Above Replacement
0.0
1
Is Qualified
1
604
Runs
571
544
Earned Runs
510
1743
Total Bases
1811
Fielding
140
Team Games Played
139
1245
Full Innings
1234
4995
Total Chances
4849
3736
Putouts
3701
1177
Assists
1075
82
Errors
73
224
Double Plays
210
0.984
Fielding Percentage
0.985
35.5
Range Factor
34.8
0.0
Zone Rating
0.0
140
Games Played
139
0
Games Started
0
0.0
Defensive Wins Above Replacement
0.0
1
Qualified
1