

Blue Jays vs Phillies Live Score (9 Aug, 2026)
Game Information
Stage
Standard
Season
2026
First Pitch
Sun, Aug 9, 1:35 pm
Venue
Citizens Bank Park
Location
Philadelphia, Pennsylvania
Attendance
40,398
Inning Scores
Home Runs
Kazuma Okamoto
24 HR
.225 AVG
70 RBI

Kyle Schwarber
33 HR
.244 AVG
64 RBI

Batting Average
Ernie Clement
.285 AVG
.309 OBP
.411 SLG

Brandon Marsh
.275 AVG
.315 OBP
.442 SLG

Runs Batted In
Kazuma Okamoto
70 RBI
24 HR
.225 AVG
Bryce Harper
71 RBI
25 HR
.257 AVG

Earned Run Average
Dylan Cease
2.28 ERA
7 W
184 K
Cristopher Sanchez
2.65 ERA
15 W
174 K

Wins
Dylan Cease
7 W
2.28 ERA
184 K
Cristopher Sanchez
15 W
2.65 ERA
174 K
Strikeouts
Dylan Cease
184 K
7 W
2.28 ERA
Cristopher Sanchez
174 K
15 W
2.65 ERA
Injury Report






Team Stats
 TOR
PHI

Array
Runs
Array
10
Hits
10
0
Errors
1
—
Home Runs
—
—
Walks
—
—
Strikeouts
—
Standings
American League
| Team | W | L | PCT | GB | DIFF | STRK |
|---|---|---|---|---|---|---|
1 Rays | 76 | 53 | .589 | - | +42 | L3 |
2 White Sox | 67 | 62 | .519 | 9 | +42 | L1 |
3 Astros | 65 | 65 | .500 | 11.5 | -43 | L1 |
4 Yankees | 73 | 56 | .566 | 3 | +95 | L1 |
5 Red Sox | 70 | 59 | .543 | 6 | +98 | W2 |
6 Rangers | 64 | 66 | .492 | 12.5 | -48 | L1 |
| 7Blue Jays | 64 | 67 | .489 | 13 | -50 | W1 |
8 Twins | 63 | 66 | .488 | 13 | -45 | L1 |
9 Guardians | 63 | 66 | .488 | 13 | -15 | W2 |
10 Orioles | 63 | 67 | .485 | 13.5 | -33 | W2 |
11 Mariners | 62 | 68 | .477 | 14.5 | -44 | W2 |
12 Tigers | 61 | 68 | .473 | 15 | +77 | L4 |
13 Royals | 57 | 74 | .435 | 20 | -95 | W7 |
14 Angels | 52 | 78 | .400 | 24.5 | -68 | W1 |
15 Athletics | 50 | 80 | .385 | 26.5 | -188 | W1 |
National League
| Team | W | L | PCT | GB | DIFF | STRK |
|---|---|---|---|---|---|---|
1 Brewers | 81 | 49 | .623 | - | +163 | W3 |
2 Dodgers | 79 | 51 | .608 | 2 | +147 | W5 |
3 Braves | 75 | 55 | .577 | 6 | +108 | L2 |
4 Cubs | 74 | 56 | .569 | 7 | +98 | L3 |
| 5Phillies | 72 | 58 | .554 | 9 | +25 | W8 |
6 Padres | 69 | 60 | .535 | 11.5 | +7 | W1 |
7 Diamondbacks | 68 | 61 | .527 | 12.5 | +13 | W2 |
8 Marlins | 66 | 64 | .508 | 15 | +17 | W2 |
9 Cardinals | 66 | 65 | .504 | 15.5 | 0 | L2 |
10 Pirates | 63 | 68 | .481 | 18.5 | +29 | L2 |
11 Reds | 61 | 68 | .473 | 19.5 | -98 | L2 |
12 Nationals | 61 | 70 | .466 | 20.5 | +14 | L3 |
13 Mets | 59 | 71 | .454 | 22 | -39 | W1 |
14 Giants | 52 | 77 | .403 | 28.5 | -79 | L3 |
15 Rockies | 50 | 78 | .391 | 30 | -130 | L4 |
TOR
VS
PHI
Pitchers
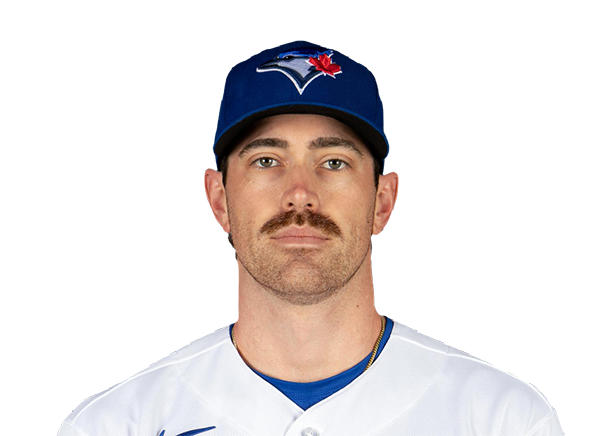
Shane Bieber
Catchers
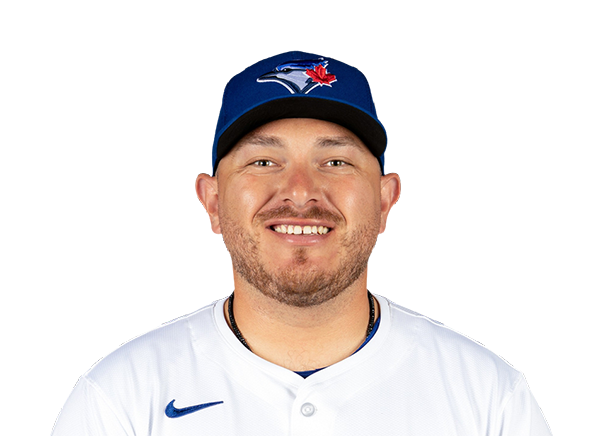
Alejandro Kirk
Infielders
Kazuma Okamoto
Ernie Clement
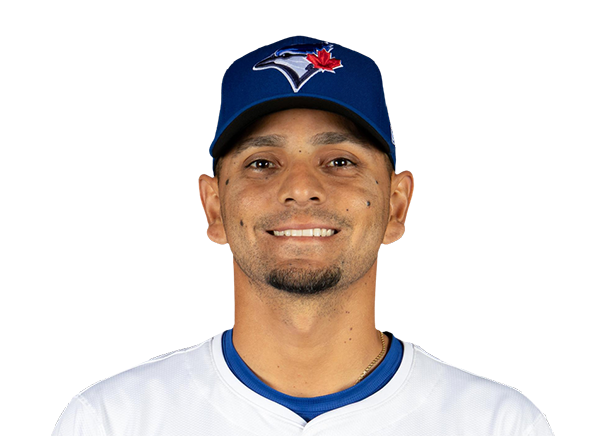
Andres Gimenez
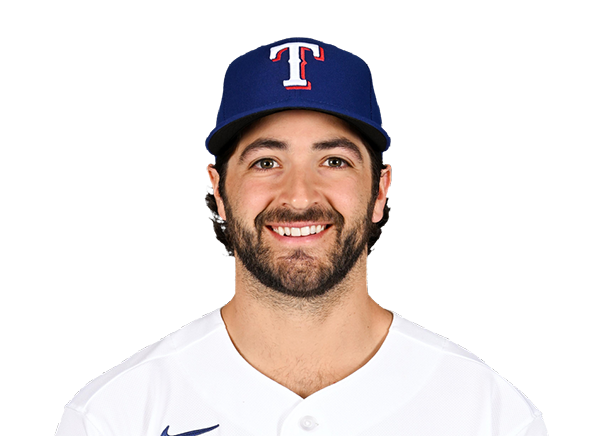
Josh Smith
Outfielders
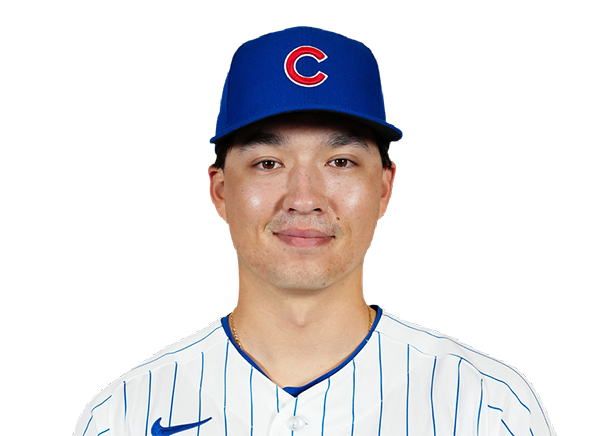
Brett Bateman

Myles Straw
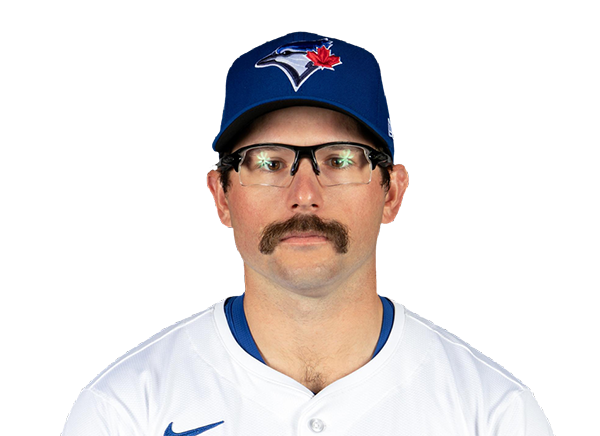
Davis Schneider
Designated Hitters
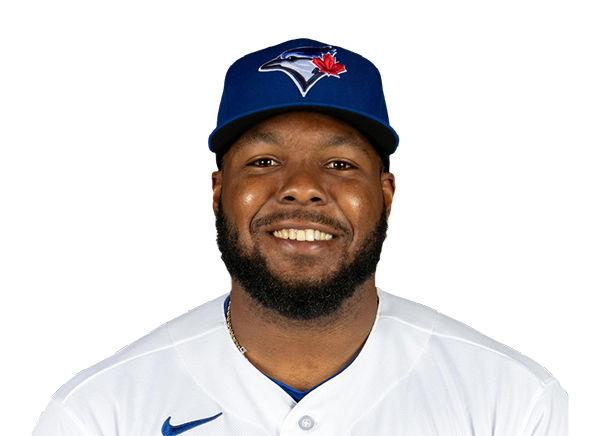
Vladimir Guerrero Jr.
Pitchers

Jesus Luzardo
Catchers

J.T. Realmuto
Infielders

Trea Turner
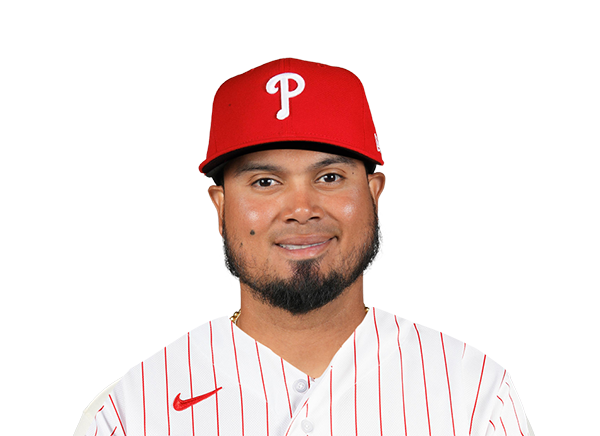
Luis Arraez

Bryson Stott

Alec Bohm
Outfielders
Bryce Harper
Brandon Marsh
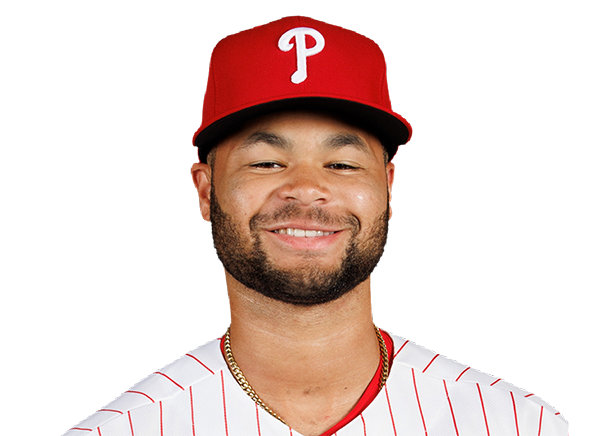
Justin Crawford
Designated Hitters
Kyle Schwarber
Blue Jays
VS
Phillies
Batting
119
Team Games Played
119
4012
At Bats
3988
969
Hits
949
448
Runs Batted In
511
114
Home Runs
149
56
Stolen Bases
92
.242
Batting Average
.238
469
Runs
528
185
Doubles
165
7
Triples
19
1510
Total Bases
1599
326
Walks
370
873
Strikeouts
1024
.303
On Base Percentage
.308
.376
Slugging Percentage
.401
.679
OBP Pct + SLG Pct
.709
119
Games Played
119
119
Games Started
119
43
Hit By Pitch
50
0.0
Wins Above Replacement
0.0
0.0
Offensive Wins Above Replacement
0.0
14
Caught Stealing
15
1
Is Qualified
1
459.2
Runs Created
507.9
3.9
Runs Created Per 27 Outs
4.3
.074
Walks Per Plate Appearance
.083
0.37
Walk To Strikeout Ratio
0.36
.135
Isolated Power
.163
.227
Secondary Average
.275
3.81
Pitches Per Plate Appearance
3.89
306
Extra Base Hits
333
4435
Plate Appearances
4459
35.2
At Bats Per Home Run
26.8
16
Sacrifice Hit
8
35
Sacrifice Flies
40
Pitching
119
Team Games Played
119
35
Quality Starts
51
56
Wins
63
63
Losses
56
38
Saves
30
77
Holds
48
960
Hits
1019
473
Earned runs
492
125
Home Runs
143
437
Walks
361
1047
Strikeouts
1168
8.9
Strikeouts Per 9 Innings
9.9
149.8
Pitches Per Start
149.3
1.32
Walks Plus Hits Per Inning Pitched
1.31
4.02
Earned Run Average
4.19
63
Losses
56
1059.1
Innings pitched
1056.2
.471
Win Percentage
.529
53
Save Opportunities
46
.241
Opponent Batting Average
.251
.318
Opponent's On-base pct.
.318
.380
Opponent's Slugging pct.
.409
.697
Opponent's OPB Pct + SLG Pct
.726
3991
At Bats
4066
163
Doubles
169
9
Triples
22
29
Batters Hit
53
113
Stolen Bases
70
119
Games Played
119
1
Complete Games
1
8
Shutouts
15
35
Wild Pitches
30
501
Runs Batted In
502
5
Balks
3
1059.1
Innings pitched
1056.2
8.9
Strikeouts Per 9 Innings
9.9
36
Caught Stealing
32
119
Games Started
119
0.0
Wins Above Replacement
0.0
1
Is Qualified
1
528
Runs
528
473
Earned Runs
492
1516
Total Bases
1661
Fielding
119
Team Games Played
119
1059
Full Innings
1057
4272
Total Chances
4209
3178
Putouts
3170
1017
Assists
978
77
Errors
61
185
Double Plays
165
0.982
Fielding Percentage
0.986
35.6
Range Factor
35.3
0.0
Zone Rating
0.0
119
Games Played
119
0
Games Started
0
0.0
Defensive Wins Above Replacement
0.0
1
Qualified
1