

Blue Jays vs Rangers Live Score (19 Sep, 2026)
Game Information
Stage
STD
Season
2026
First Pitch
Fri, Sep 18, 8:05 pm
Venue
Globe Life Field
Location
Arlington, Texas
Venue Type
Indoor
Broadcast
MLB.TV
Attendance
31,045
Live Situation
3Balls
2Strikes
0Outs
—Pitcher
—At Bat
Pitch Sequence
1
BALL
Changeup
81 MPH
2
BALL
Four-seam FB
88 MPH
3
STRIKE FOUL
Four-seam FB
88 MPH
4
STRIKE SWINGING
Four-seam FB
88 MPH
5
BALL
Four-seam FB
89 MPH
6
BALL IN PLAY
Four-seam FB
90 MPH
Injury Report





Team Stats
 TOR
TEX


1
Runs
7
5
Hits
8
3
Errors
0
0
Home Runs
0
2
Walks
10
7
Strikeouts
9
Player Box Score
Toronto Blue Jays
| Player | H-AB | AB | R | H | RBI | HR | BB | K | #P | AVG | OBP | SLG |
|---|---|---|---|---|---|---|---|---|---|---|---|---|
 Brett Bateman | 0-4 | 4 | 0 | 0 | 0 | 0 | 0 | 1 | 13 | .324 | .390 | .415 |
 Nathan Lukes | 0-2 | 2 | 0 | 0 | 0 | 0 | 0 | 0 | 10 | .273 | .320 | .387 |
 Davis Schneider | 0-1 | 1 | 0 | 0 | 0 | 0 | 0 | 0 | 7 | .139 | .291 | .270 |
 Sean Keys | 0-1 | 1 | 0 | 0 | 0 | 0 | 0 | 0 | 2 | .196 | .229 | .348 |
 Vladimir Guerrero Jr. | 1-4 | 4 | 0 | 1 | 0 | 0 | 0 | 1 | 10 | .261 | .334 | .359 |
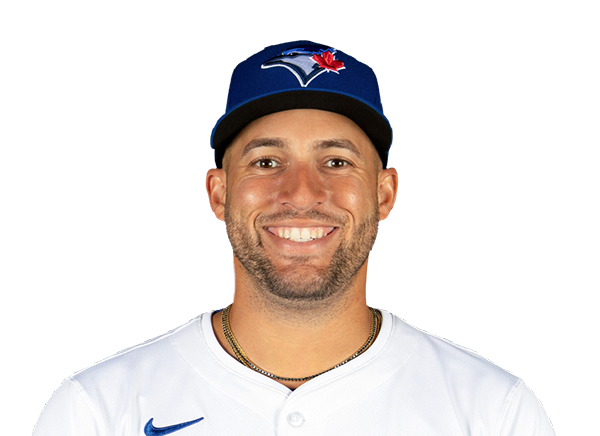 George Springer | 0-4 | 4 | 0 | 0 | 0 | 0 | 0 | 1 | 13 | .251 | .326 | .412 |
 Alejandro Kirk | 1-4 | 4 | 0 | 1 | 0 | 0 | 0 | 1 | 24 | .279 | .351 | .422 |
 Kazuma Okamoto | 1-3 | 3 | 0 | 1 | 0 | 0 | 1 | 1 | 16 | .235 | .311 | .463 |
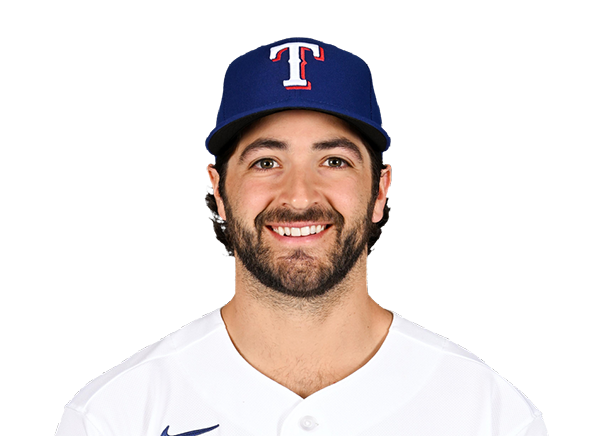 Josh Smith | 0-3 | 3 | 1 | 0 | 0 | 0 | 1 | 1 | 21 | .219 | .312 | .344 |
 Ernie Clement | 0-3 | 3 | 0 | 0 | 0 | 0 | 0 | 1 | 11 | .266 | .293 | .373 |
 Myles Straw | 2-3 | 3 | 0 | 2 | 1 | 0 | 0 | 0 | 8 | .239 | .304 | .348 |
Texas Rangers
| Player | H-AB | AB | R | H | RBI | HR | BB | K | #P | AVG | OBP | SLG |
|---|---|---|---|---|---|---|---|---|---|---|---|---|
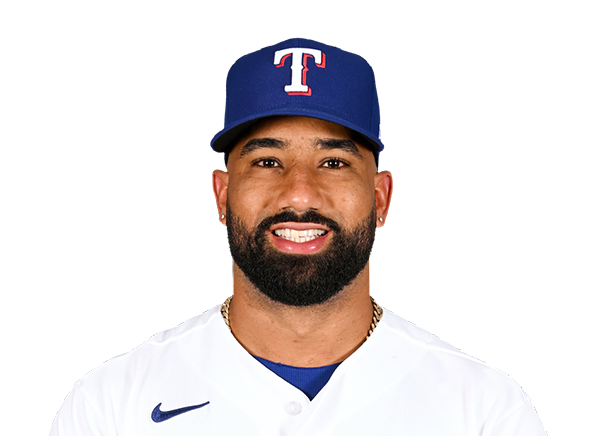 Ezequiel Duran | 1-4 | 4 | 1 | 1 | 1 | 0 | 0 | 0 | 16 | .268 | .327 | .436 |
 Corey Seager | 1-4 | 4 | 0 | 1 | 1 | 0 | 1 | 1 | 17 | .234 | .326 | .434 |
 Josh Jung | 1-4 | 4 | 0 | 1 | 0 | 0 | 1 | 1 | 20 | .297 | .362 | .447 |
 Brandon Nimmo | 0-3 | 3 | 1 | 0 | 0 | 0 | 2 | 1 | 22 | .260 | .325 | .408 |
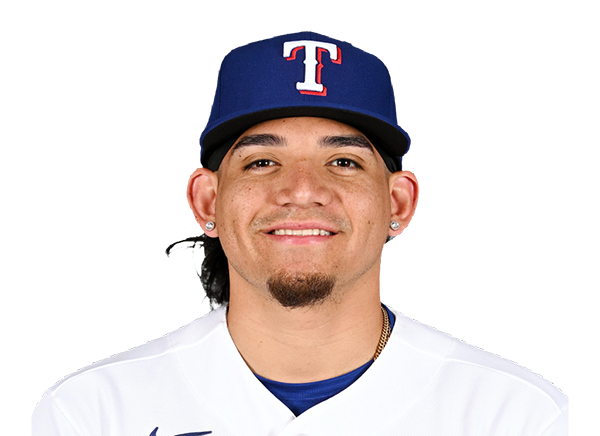 Alejandro Osuna | 0-0 | 0 | 0 | 0 | 0 | 0 | 0 | 0 | 0 | .254 | .345 | .295 |
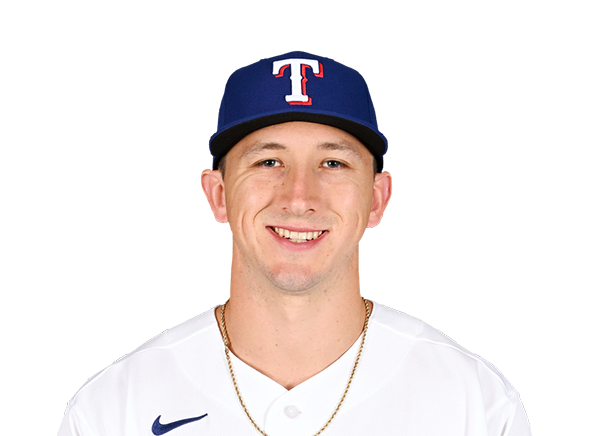 Wyatt Langford | 2-2 | 2 | 2 | 2 | 1 | 0 | 3 | 0 | 24 | .242 | .336 | .435 |
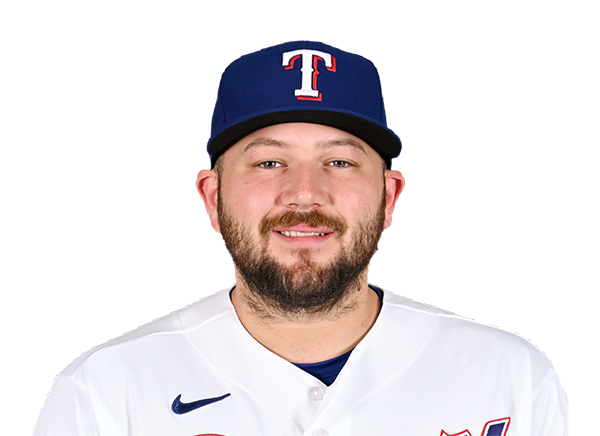 Jake Burger | 1-2 | 2 | 1 | 1 | 2 | 0 | 2 | 1 | 25 | .234 | .308 | .426 |
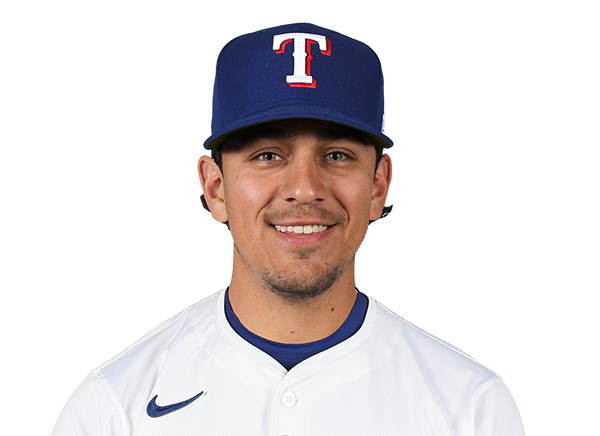 Nicky Lopez | 2-5 | 5 | 1 | 2 | 0 | 0 | 0 | 1 | 17 | .272 | .315 | .313 |
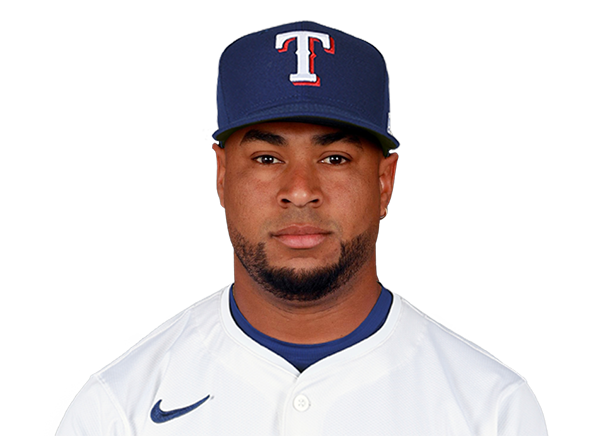 Elias Diaz | 0-3 | 3 | 0 | 0 | 0 | 0 | 1 | 2 | 22 | .236 | .270 | .396 |
 Evan Carter | 0-4 | 4 | 1 | 0 | 1 | 0 | 0 | 2 | 17 | .190 | .287 | .314 |
Toronto Blue Jays
| Player | IP | H | R | ER | BB | K | HR | PC-ST | ERA | PC |
|---|---|---|---|---|---|---|---|---|---|---|
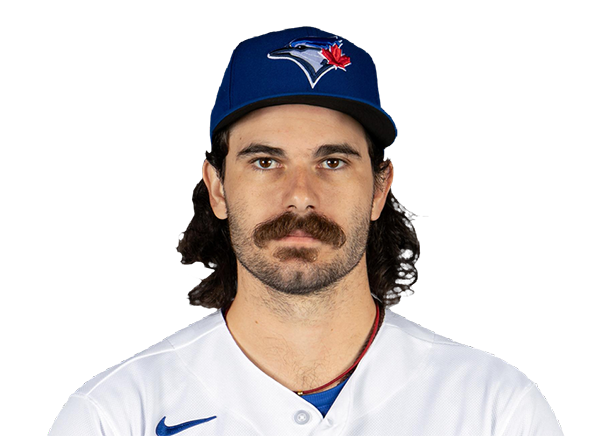 Dylan Cease | 2.2 | 3 | 4 | 1 | 6 | 3 | 0 | 74-36 | 2.40 | 74 |
 Brendan Cellucci | 1.1 | 0 | 0 | 0 | 0 | 1 | 0 | 13-10 | 0.00 | 13 |
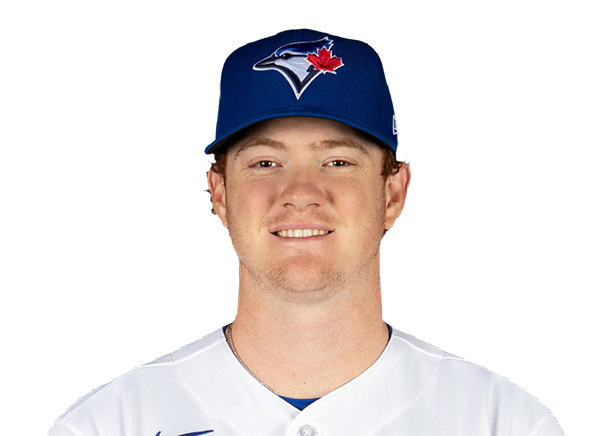 Braydon Fisher | 0.2 | 1 | 1 | 1 | 2 | 0 | 0 | 23-11 | 3.25 | 23 |
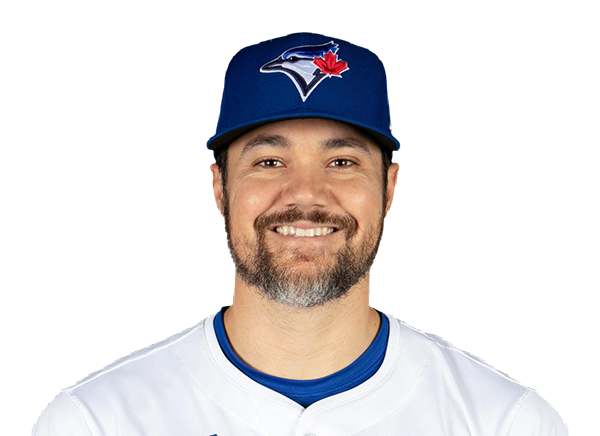 Brendon Little | 0.2 | 1 | 1 | 0 | 2 | 2 | 0 | 25-12 | 6.84 | 25 |
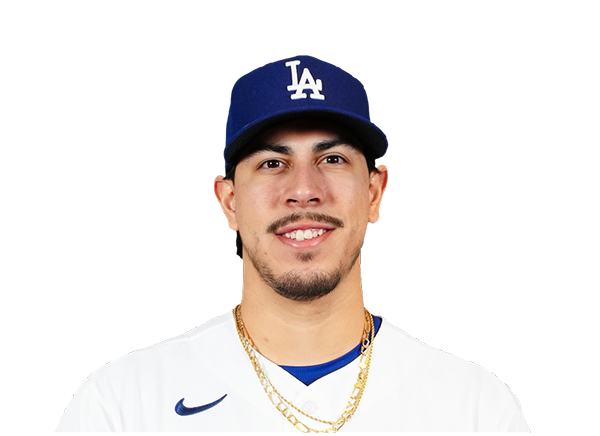 Jose Rodriguez | 1.2 | 1 | 0 | 0 | 0 | 2 | 0 | 24-16 | 0.00 | 24 |
 Joe Mantiply | 1.0 | 2 | 1 | 1 | 0 | 1 | 0 | 21-14 | 3.33 | 21 |
Texas Rangers
| Player | IP | H | R | ER | BB | K | HR | PC-ST | ERA | PC |
|---|---|---|---|---|---|---|---|---|---|---|
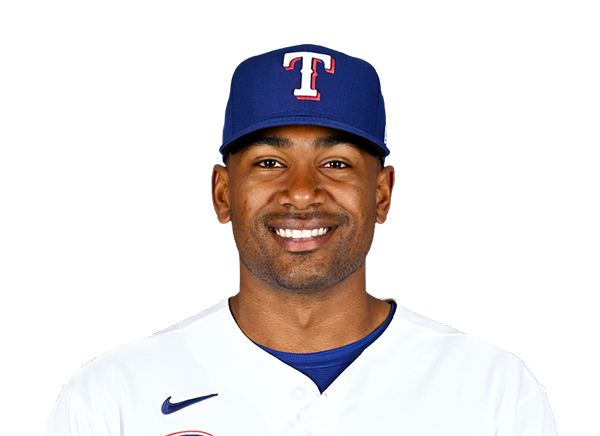 Kumar Rocker | 4.1 | 3 | 1 | 1 | 2 | 2 | 0 | 76-48 | 4.47 | 76 |
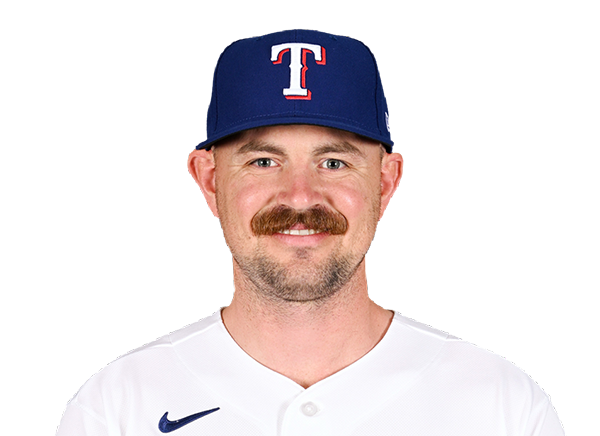 Tyler Alexander | 0.2 | 0 | 0 | 0 | 0 | 1 | 0 | 10-7 | 3.29 | 10 |
 Trevor Williams | 4.0 | 2 | 0 | 0 | 0 | 4 | 0 | 49-34 | 2.73 | 49 |
H2H / Season Series
TEX7–1
TOR
TOR2–3
TEX
TOR4–7
TEX
TOR4–5
TEX
TOR5–6
TEX
Last 5 Games
| Date | Opponent | Result |
|---|---|---|
| Sep 18 | @ TEX | L1–7 |
| Sep 16 |  vs DET | W5–1 |
| Sep 15 | vs DET | L1–10 |
| Sep 14 | vs DET | L5–6 |
| Sep 13 |  vs BAL | W8–1 |
| Date | Opponent | Result |
|---|---|---|
| Sep 18 | vs TOR | W7–1 |
| Sep 17 |  vs BOS | L3–4 |
| Sep 16 | vs BOS | W7–3 |
| Sep 15 | vs BOS | W4–2 |
| Sep 13 |  @ ARI | W7–6 |
Standings
American League
| Team | W | L | PCT | GB | DIFF | STRK |
|---|---|---|---|---|---|---|
1 Rays | 93 | 60 | .608 | - | +78 | L1 |
2 Guardians | 79 | 75 | .513 | 14.5 | -5 | W3 |
3 Astros | 77 | 77 | .500 | 16.5 | -54 | L1 |
4 Yankees | 89 | 64 | .582 | 4 | +143 | W1 |
| 5Red Sox | 84 | 70 | .545 | 9.5 | +85 | W2 |
6 White Sox | 78 | 76 | .506 | 15.5 | +33 | L1 |
| 7Rangers | 77 | 77 | .500 | 16.5 | -33 | W1 |
| 8Blue Jays | 76 | 78 | .494 | 17.5 | -43 | L1 |
| 9Orioles | 75 | 79 | .487 | 18.5 | -27 | L1 |
| 10Tigers | 73 | 81 | .474 | 20.5 | +77 | W1 |
11 Mariners | 72 | 82 | .468 | 21.5 | -55 | W2 |
12 Twins | 72 | 82 | .468 | 21.5 | -71 | W1 |
13 Royals | 67 | 87 | .435 | 26.5 | -100 | L2 |
14 Athletics | 61 | 93 | .396 | 32.5 | -216 | L4 |
15 Angels | 59 | 95 | .383 | 34.5 | -80 | L1 |
National League
| Team | W | L | PCT | GB | DIFF | STRK |
|---|---|---|---|---|---|---|
1 Brewers | 96 | 58 | .623 | - | +198 | W1 |
2 Dodgers | 94 | 60 | .610 | 2 | +185 | W2 |
3 Braves | 90 | 64 | .584 | 6 | +115 | W1 |
4 Phillies | 85 | 69 | .552 | 11 | +31 | L1 |
5 Cubs | 85 | 69 | .552 | 11 | +141 | L1 |
6 Padres | 85 | 69 | .552 | 11 | +36 | W3 |
| 7Diamondbacks | 80 | 74 | .519 | 16 | -7 | L3 |
8 Pirates | 77 | 77 | .500 | 19 | +27 | W2 |
9 Marlins | 76 | 78 | .494 | 20 | +2 | L1 |
10 Cardinals | 75 | 79 | .487 | 21 | -22 | L3 |
11 Nationals | 72 | 82 | .468 | 24 | +11 | W1 |
12 Reds | 72 | 82 | .468 | 24 | -152 | W1 |
13 Mets | 70 | 84 | .455 | 26 | -43 | W1 |
14 Giants | 64 | 90 | .416 | 32 | -76 | L1 |
15 Rockies | 56 | 98 | .364 | 40 | -178 | L3 |
TOR
VS
TEX
Pitchers
Dylan Cease
Catchers
Alejandro Kirk
Infielders
Vladimir Guerrero Jr.
Kazuma Okamoto
Josh Smith
Ernie Clement
Outfielders
Brett Bateman
Nathan Lukes
Myles Straw
Designated Hitters
George Springer
Pitchers
Kumar Rocker
Catchers
Elias Diaz
Infielders
Ezequiel Duran
Corey Seager
Jake Burger
Nicky Lopez
Outfielders
Brandon Nimmo
Wyatt Langford
Evan Carter
Designated Hitters
Josh Jung
Blue Jays
VS
Rangers
Batting
154
Team Games Played
154
5192
At Bats
5112
1288
Hits
1245
589
Runs Batted In
623
148
Home Runs
174
75
Stolen Bases
75
.248
Batting Average
.244
620
Runs
645
243
Doubles
226
8
Triples
22
1991
Total Bases
2037
434
Walks
507
1102
Strikeouts
1315
.310
On Base Percentage
.318
.383
Slugging Percentage
.398
.694
OBP Pct + SLG Pct
.717
154
Games Played
154
154
Games Started
154
55
Hit By Pitch
71
0.0
Wins Above Replacement
0.0
0.0
Offensive Wins Above Replacement
0.0
17
Caught Stealing
21
1
Is Qualified
1
620.2
Runs Created
657.5
4.1
Runs Created Per 27 Outs
4.4
.075
Walks Per Plate Appearance
.088
0.39
Walk To Strikeout Ratio
0.39
.135
Isolated Power
.155
.230
Secondary Average
.265
3.81
Pitches Per Plate Appearance
3.88
399
Extra Base Hits
422
5755
Plate Appearances
5762
35.1
At Bats Per Home Run
29.4
24
Sacrifice Hit
37
47
Sacrifice Flies
34
Pitching
154
Team Games Played
154
45
Quality Starts
49
76
Wins
77
78
Losses
77
51
Saves
42
99
Holds
79
1212
Hits
1285
595
Earned runs
641
158
Home Runs
183
571
Walks
468
1336
Strikeouts
1288
8.8
Strikeouts Per 9 Innings
8.6
148.9
Pitches Per Start
145.1
1.30
Walks Plus Hits Per Inning Pitched
1.30
3.91
Earned Run Average
4.28
78
Losses
77
1368.0
Innings pitched
1349.1
.494
Win Percentage
.500
67
Save Opportunities
61
.236
Opponent Batting Average
.247
.315
Opponent's On-base pct.
.316
.372
Opponent's Slugging pct.
.409
.686
Opponent's OPB Pct + SLG Pct
.725
5133
At Bats
5192
203
Doubles
244
9
Triples
23
40
Batters Hit
65
141
Stolen Bases
93
154
Games Played
154
1
Complete Games
0
11
Shutouts
13
48
Wild Pitches
43
625
Runs Batted In
658
8
Balks
2
1368.0
Innings pitched
1349.1
8.8
Strikeouts Per 9 Innings
8.6
43
Caught Stealing
24
154
Games Started
154
0.0
Wins Above Replacement
0.0
1
Is Qualified
1
663
Runs
678
595
Earned Runs
641
1907
Total Bases
2124
Fielding
154
Team Games Played
154
1368
Full Innings
1349
5498
Total Chances
5318
4104
Putouts
4048
1299
Assists
1204
95
Errors
66
243
Double Plays
226
0.983
Fielding Percentage
0.988
35.5
Range Factor
35.0
0.0
Zone Rating
0.0
154
Games Played
154
0
Games Started
0
0.0
Defensive Wins Above Replacement
0.0
1
Qualified
1