

Blue Jays vs Rangers Live Score (19 Sep, 2026)
Game Information
Stage
STD
Season
2026
First Pitch
Sat, Sep 19, 7:05 pm
Venue
Globe Life Field
Location
Arlington, Texas
Venue Type
Indoor
Broadcast
MLB.TV
Attendance
38,399
Live Situation
0Balls
1Strikes
0Outs
—Pitcher
—At Bat
Pitch Sequence
1
STRIKE SWINGING
Four-seam FB
96 MPH
2
BALL IN PLAY
Four-seam FB
96 MPH
Injury Report


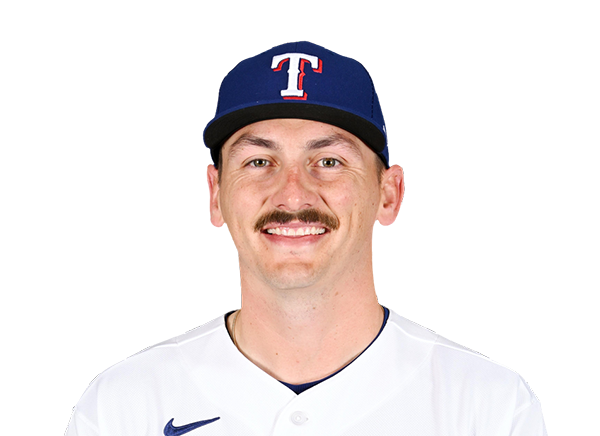

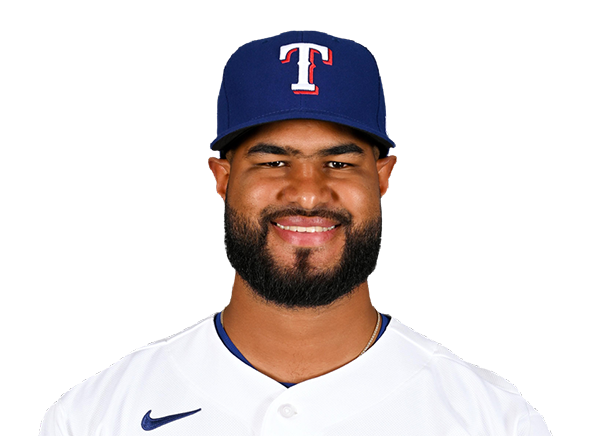
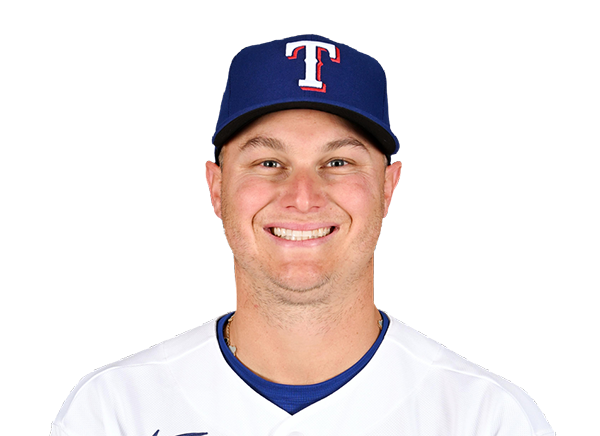
Team Stats
 TOR
TEX


2
Runs
6
6
Hits
5
1
Errors
0
1
Home Runs
1
1
Walks
4
4
Strikeouts
12
Player Box Score
Toronto Blue Jays
| Player | H-AB | AB | R | H | RBI | HR | BB | K | #P | AVG | OBP | SLG |
|---|---|---|---|---|---|---|---|---|---|---|---|---|
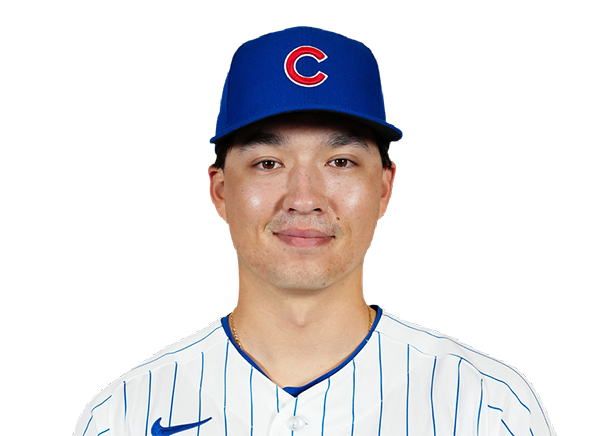 Brett Bateman | 1-4 | 4 | 0 | 1 | 0 | 0 | 0 | 0 | 17 | .322 | .387 | .411 |
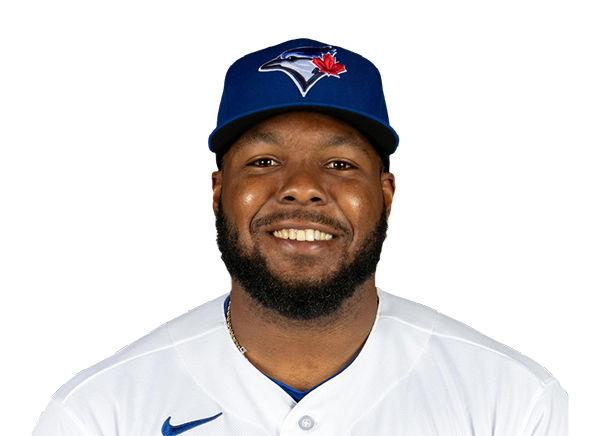 Vladimir Guerrero Jr. | 1-3 | 3 | 0 | 1 | 0 | 0 | 1 | 0 | 13 | .262 | .335 | .359 |
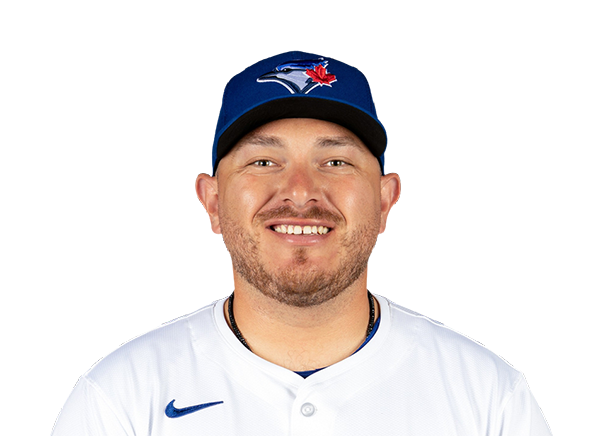 Alejandro Kirk | 2-4 | 4 | 0 | 2 | 1 | 0 | 0 | 0 | 12 | .282 | .353 | .424 |
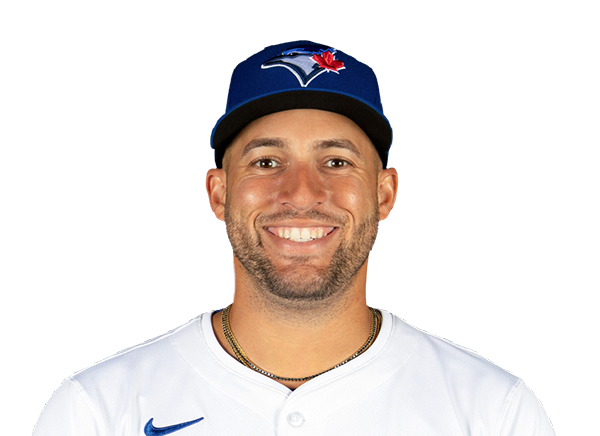 George Springer | 0-4 | 4 | 0 | 0 | 0 | 0 | 0 | 1 | 14 | .249 | .323 | .408 |
 Nathan Lukes | 0-2 | 2 | 0 | 0 | 0 | 0 | 0 | 0 | 8 | .271 | .319 | .385 |
 Davis Schneider | 1-2 | 2 | 1 | 1 | 1 | 1 | 0 | 1 | 6 | .145 | .294 | .299 |
 Kazuma Okamoto | 1-4 | 4 | 0 | 1 | 0 | 0 | 0 | 0 | 17 | .235 | .311 | .461 |
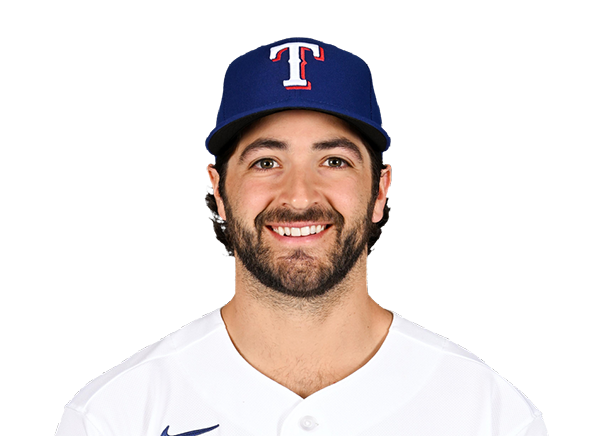 Josh Smith | 0-1 | 1 | 0 | 0 | 0 | 0 | 0 | 1 | 7 | .218 | .311 | .342 |
 Ernie Clement | 0-3 | 3 | 0 | 0 | 0 | 0 | 0 | 0 | 6 | .265 | .291 | .371 |
 Andres Gimenez | 0-2 | 2 | 1 | 0 | 0 | 0 | 0 | 0 | 12 | .242 | .288 | .358 |
 Myles Straw | 0-3 | 3 | 0 | 0 | 0 | 0 | 0 | 1 | 13 | .237 | .301 | .344 |
Texas Rangers
| Player | H-AB | AB | R | H | RBI | HR | BB | K | #P | AVG | OBP | SLG |
|---|---|---|---|---|---|---|---|---|---|---|---|---|
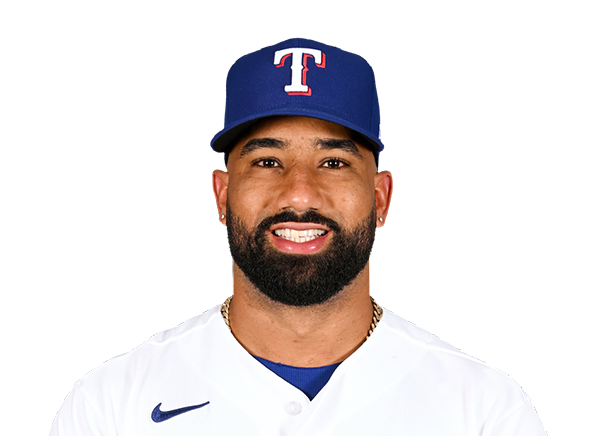 Ezequiel Duran | 0-4 | 4 | 0 | 0 | 0 | 0 | 0 | 2 | 14 | .266 | .325 | .433 |
 Corey Seager | 1-4 | 4 | 0 | 1 | 0 | 0 | 0 | 1 | 10 | .234 | .325 | .432 |
 Josh Jung | 1-3 | 3 | 2 | 1 | 1 | 1 | 0 | 1 | 10 | .298 | .363 | .454 |
 Brandon Nimmo | 1-4 | 4 | 1 | 1 | 0 | 0 | 0 | 2 | 12 | .260 | .325 | .407 |
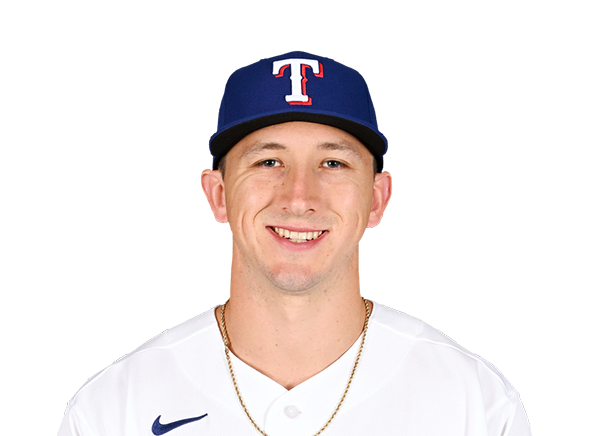 Wyatt Langford | 1-2 | 2 | 2 | 1 | 1 | 0 | 2 | 0 | 23 | .244 | .339 | .438 |
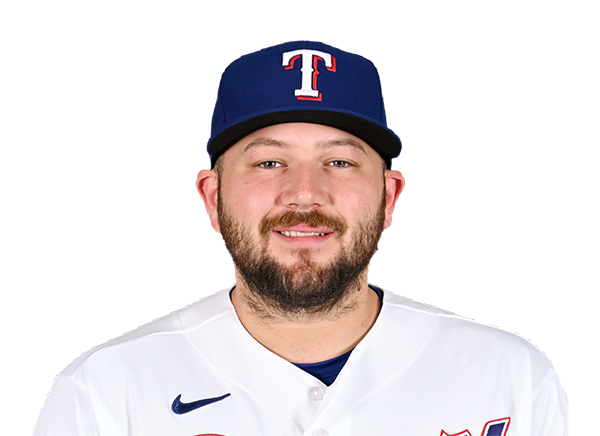 Jake Burger | 0-4 | 4 | 0 | 0 | 0 | 0 | 0 | 3 | 16 | .232 | .306 | .423 |
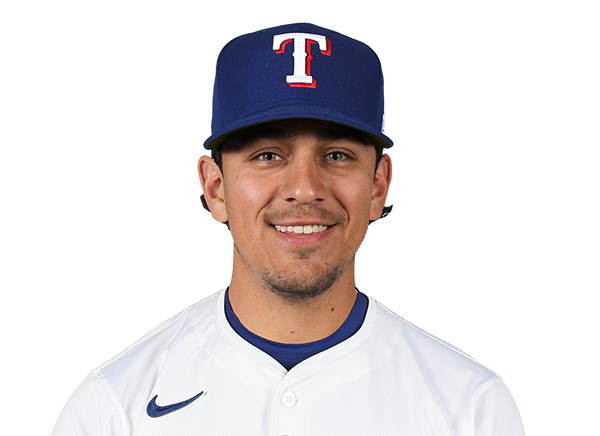 Nicky Lopez | 0-1 | 1 | 1 | 0 | 0 | 0 | 1 | 0 | 4 | .271 | .320 | .311 |
 Justin Foscue | 0-1 | 1 | 0 | 0 | 0 | 0 | 0 | 1 | 5 | .270 | .331 | .493 |
 Danny Jansen | 1-2 | 2 | 0 | 1 | 1 | 0 | 1 | 0 | 8 | .206 | .298 | .371 |
 Evan Carter | 0-3 | 3 | 0 | 0 | 1 | 0 | 0 | 2 | 18 | .189 | .284 | .311 |
Toronto Blue Jays
| Player | IP | H | R | ER | BB | K | HR | PC-ST | ERA | PC |
|---|---|---|---|---|---|---|---|---|---|---|
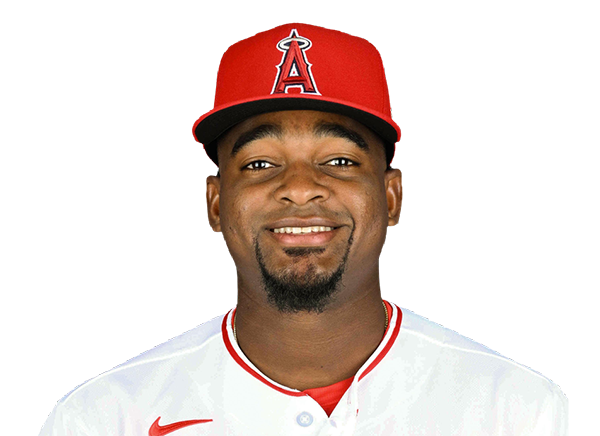 Jose Soriano | 5.0 | 4 | 6 | 5 | 1 | 8 | 1 | 80-50 | 3.72 | 80 |
 Paul Sewald | 1.0 | 0 | 0 | 0 | 1 | 2 | 0 | 17-9 | 4.94 | 17 |
 Tyler Rogers | 1.0 | 1 | 0 | 0 | 0 | 1 | 0 | 8-6 | 1.70 | 8 |
 Brendan Cellucci | 1.0 | 0 | 0 | 0 | 2 | 1 | 0 | 15-8 | 0.00 | 15 |
Texas Rangers
| Player | IP | H | R | ER | BB | K | HR | PC-ST | ERA | PC |
|---|---|---|---|---|---|---|---|---|---|---|
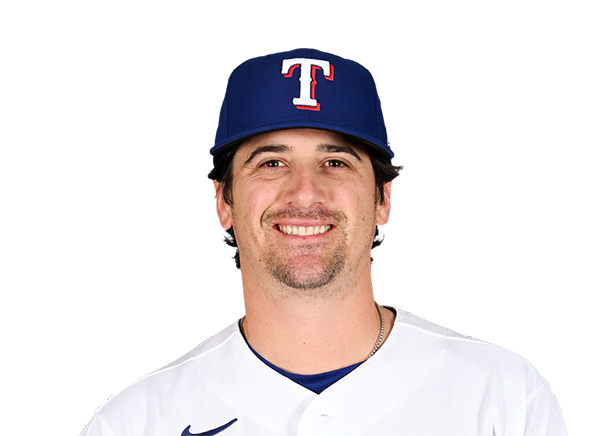 Cal Quantrill | 1.1 | 0 | 0 | 0 | 0 | 0 | 0 | 12-7 | 2.86 | 12 |
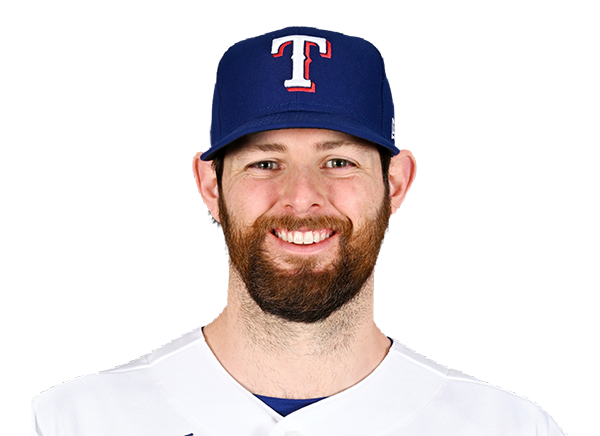 Jordan Montgomery | 3.2 | 0 | 0 | 0 | 1 | 1 | 0 | 51-35 | 4.15 | 51 |
 Nathan Eovaldi | 1.0 | 2 | 1 | 1 | 0 | 1 | 0 | 22-16 | 4.10 | 22 |
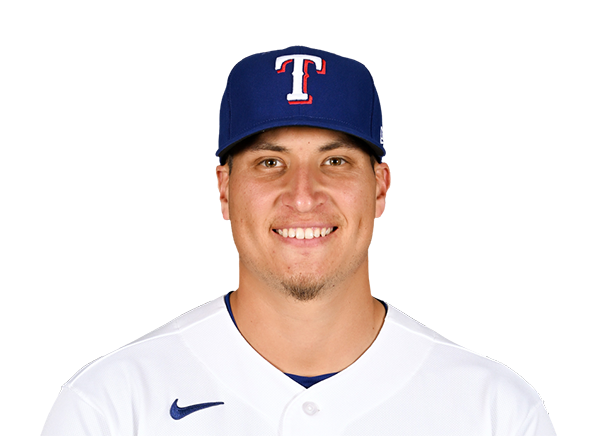 Robert Garcia | 1.0 | 2 | 1 | 1 | 0 | 0 | 1 | 12-11 | 2.70 | 12 |
 Chase Silseth | 1.0 | 2 | 0 | 0 | 0 | 1 | 0 | 19-14 | 3.28 | 19 |
 Jacob Latz | 1.0 | 0 | 0 | 0 | 0 | 1 | 0 | 9-7 | 2.08 | 9 |
H2H / Season Series
TEX6–2
TOR
TEX7–1
TOR
TOR2–3
TEX
TOR4–7
TEX
TOR4–5
TEX
TOR5–6
TEX
Last 5 Games
| Date | Opponent | Result |
|---|---|---|
| Sep 19 | @ TEX | L2–6 |
| Sep 18 | @ TEX | L1–7 |
| Sep 16 |  vs DET | W5–1 |
| Sep 15 | vs DET | L1–10 |
| Sep 14 | vs DET | L5–6 |
| Date | Opponent | Result |
|---|---|---|
| Sep 19 | vs TOR | W6–2 |
| Sep 18 | vs TOR | W7–1 |
| Sep 17 |  vs BOS | L3–4 |
| Sep 16 | vs BOS | W7–3 |
| Sep 15 | vs BOS | W4–2 |
Standings
American League
| Team | W | L | PCT | GB | DIFF | STRK |
|---|---|---|---|---|---|---|
1 Rays | 94 | 60 | .610 | - | +79 | W1 |
2 Guardians | 80 | 75 | .516 | 14.5 | +1 | W4 |
| 3Rangers | 78 | 77 | .503 | 16.5 | -29 | W2 |
4 Yankees | 89 | 65 | .578 | 5 | +141 | L1 |
| 5Red Sox | 84 | 71 | .542 | 10.5 | +84 | L1 |
6 White Sox | 79 | 76 | .510 | 15.5 | +35 | W1 |
7 Astros | 77 | 78 | .497 | 17.5 | -57 | L2 |
| 8Blue Jays | 76 | 79 | .490 | 18.5 | -47 | L2 |
9 Orioles | 75 | 80 | .484 | 19.5 | -28 | L2 |
| 10Tigers | 73 | 82 | .471 | 21.5 | +75 | L1 |
11 Mariners | 72 | 83 | .465 | 22.5 | -57 | L1 |
12 Twins | 72 | 83 | .465 | 22.5 | -72 | L1 |
13 Royals | 67 | 88 | .432 | 27.5 | -101 | L3 |
14 Athletics | 61 | 94 | .394 | 33.5 | -222 | L5 |
15 Angels | 60 | 95 | .387 | 34.5 | -79 | W1 |
National League
| Team | W | L | PCT | GB | DIFF | STRK |
|---|---|---|---|---|---|---|
1 Brewers | 97 | 58 | .626 | - | +199 | W2 |
2 Dodgers | 95 | 60 | .613 | 2 | +191 | W3 |
3 Braves | 91 | 64 | .587 | 6 | +118 | W2 |
4 Cubs | 86 | 69 | .555 | 11 | +144 | W1 |
5 Padres | 86 | 69 | .555 | 11 | +37 | W4 |
6 Phillies | 85 | 70 | .548 | 12 | +24 | L2 |
7 Diamondbacks | 81 | 74 | .523 | 16 | -5 | W1 |
8 Pirates | 78 | 77 | .503 | 19 | +28 | W3 |
9 Marlins | 76 | 79 | .490 | 21 | +1 | L2 |
10 Cardinals | 75 | 80 | .484 | 22 | -25 | L4 |
11 Nationals | 73 | 82 | .471 | 24 | +14 | W2 |
12 Reds | 72 | 83 | .465 | 25 | -155 | L1 |
13 Mets | 71 | 84 | .458 | 26 | -36 | W2 |
14 Giants | 64 | 91 | .413 | 33 | -82 | L2 |
15 Rockies | 57 | 98 | .368 | 40 | -176 | W1 |
TOR
VS
TEX
Pitchers
Jose Soriano
Catchers
Alejandro Kirk
Infielders
Vladimir Guerrero Jr.
Kazuma Okamoto
Josh Smith
Andres Gimenez
Outfielders
Brett Bateman
Nathan Lukes
Myles Straw
Designated Hitters
George Springer
Pitchers
Cal Quantrill
Catchers
Danny Jansen
Infielders
Ezequiel Duran
Josh Jung
Jake Burger
Nicky Lopez
Outfielders
Brandon Nimmo
Wyatt Langford
Evan Carter
Designated Hitters
Corey Seager
Blue Jays
VS
Rangers
Batting
155
Team Games Played
155
5224
At Bats
5140
1294
Hits
1250
591
Runs Batted In
627
149
Home Runs
175
75
Stolen Bases
76
.248
Batting Average
.243
622
Runs
651
243
Doubles
228
8
Triples
22
2000
Total Bases
2047
435
Walks
511
1106
Strikeouts
1327
.310
On Base Percentage
.319
.383
Slugging Percentage
.398
.693
OBP Pct + SLG Pct
.717
155
Games Played
155
155
Games Started
155
56
Hit By Pitch
74
0.0
Wins Above Replacement
0.0
0.0
Offensive Wins Above Replacement
0.0
17
Caught Stealing
21
1
Is Qualified
1
621.8
Runs Created
661.4
4.1
Runs Created Per 27 Outs
4.4
.075
Walks Per Plate Appearance
.088
0.39
Walk To Strikeout Ratio
0.39
.135
Isolated Power
.155
.230
Secondary Average
.265
3.81
Pitches Per Plate Appearance
3.87
400
Extra Base Hits
425
5789
Plate Appearances
5798
35.1
At Bats Per Home Run
29.4
24
Sacrifice Hit
37
47
Sacrifice Flies
35
Pitching
155
Team Games Played
155
45
Quality Starts
49
76
Wins
78
79
Losses
77
51
Saves
42
99
Holds
80
1217
Hits
1291
600
Earned runs
643
159
Home Runs
184
575
Walks
469
1348
Strikeouts
1292
8.8
Strikeouts Per 9 Innings
8.6
148.8
Pitches Per Start
145.0
1.30
Walks Plus Hits Per Inning Pitched
1.30
3.92
Earned Run Average
4.26
79
Losses
77
1376.0
Innings pitched
1358.1
.490
Win Percentage
.503
67
Save Opportunities
61
.236
Opponent Batting Average
.247
.315
Opponent's On-base pct.
.315
.371
Opponent's Slugging pct.
.408
.687
Opponent's OPB Pct + SLG Pct
.724
5161
At Bats
5224
205
Doubles
244
9
Triples
23
43
Batters Hit
66
142
Stolen Bases
93
155
Games Played
155
1
Complete Games
0
11
Shutouts
13
49
Wild Pitches
43
629
Runs Batted In
660
8
Balks
2
1376.0
Innings pitched
1358.1
8.8
Strikeouts Per 9 Innings
8.6
43
Caught Stealing
24
155
Games Started
155
0.0
Wins Above Replacement
0.0
1
Is Qualified
1
669
Runs
680
600
Earned Runs
643
1917
Total Bases
2133
Fielding
155
Team Games Played
155
1376
Full Innings
1358
5529
Total Chances
5356
4128
Putouts
4075
1305
Assists
1215
96
Errors
66
243
Double Plays
228
0.983
Fielding Percentage
0.988
35.5
Range Factor
35.1
0.0
Zone Rating
0.0
155
Games Played
155
0
Games Started
0
0.0
Defensive Wins Above Replacement
0.0
1
Qualified
1