

Blue Jays vs Royals Live Score (5 Sep, 2026)
Game Information
Stage
STD
Season
2026
First Pitch
Fri, Sep 4, 8:10 pm
Venue
Kauffman Stadium
Location
Kansas City, Missouri
Venue Type
Outdoor
Broadcast
MLB.TV
Attendance
18,218
Live Situation
1Balls
0Strikes
0Outs
—Pitcher
—At Bat
Pitch Sequence
1
BALL
Sinker
96 MPH
2
BALL IN PLAY
Slider
89 MPH
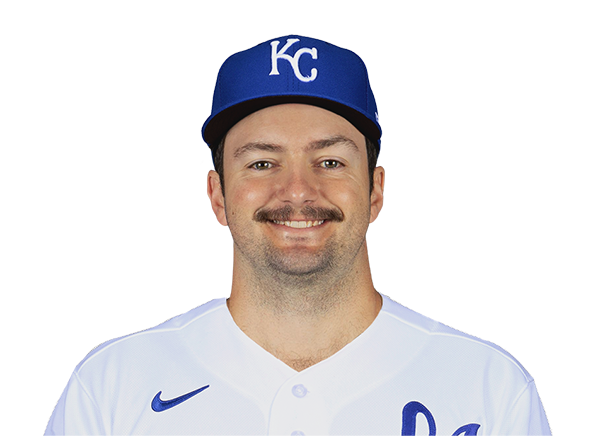
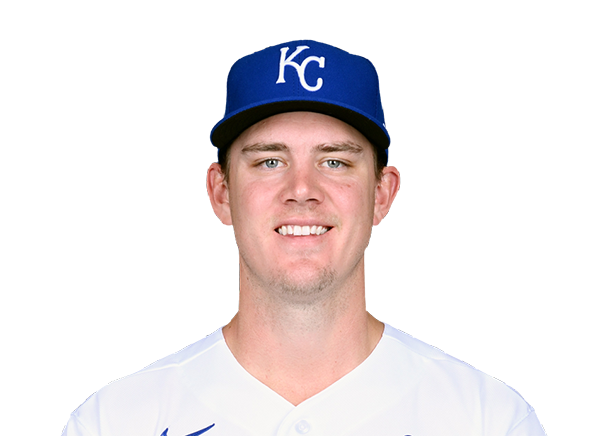
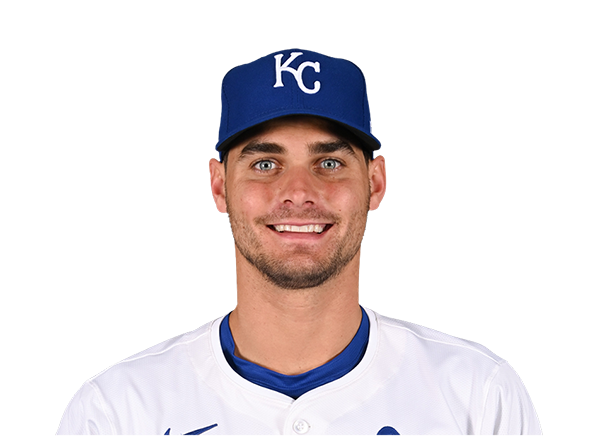
Injury Report


Team Stats
 TOR
KC


9
Runs
2
13
Hits
6
0
Errors
0
1
Home Runs
2
3
Walks
2
3
Strikeouts
5
Player Box Score
Toronto Blue Jays
| Player | H-AB | AB | R | H | RBI | HR | BB | K | #P | AVG | OBP | SLG |
|---|---|---|---|---|---|---|---|---|---|---|---|---|
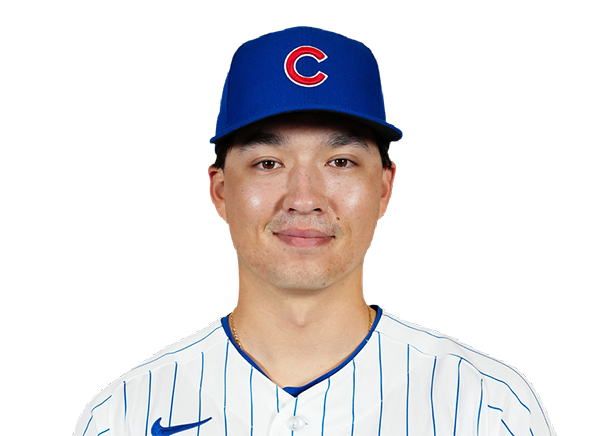 Brett Bateman | 1-3 | 3 | 2 | 1 | 0 | 0 | 1 | 0 | 20 | .330 | .390 | .394 |
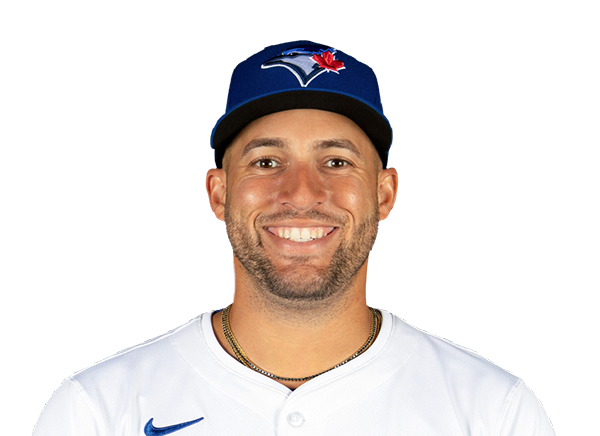 George Springer | 1-5 | 5 | 0 | 1 | 2 | 0 | 0 | 0 | 12 | .251 | .324 | .417 |
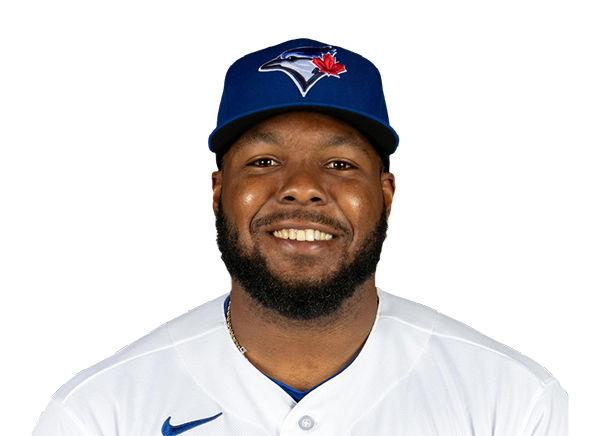 Vladimir Guerrero Jr. | 2-4 | 4 | 1 | 2 | 0 | 0 | 0 | 0 | 10 | .262 | .333 | .358 |
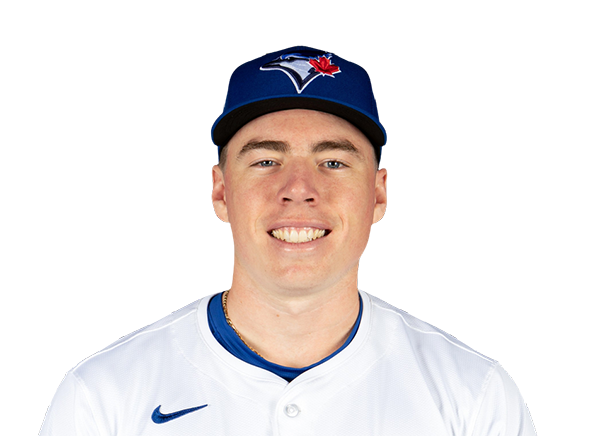 Sean Keys | 1-1 | 1 | 1 | 1 | 1 | 1 | 0 | 0 | 2 | .214 | .250 | .381 |
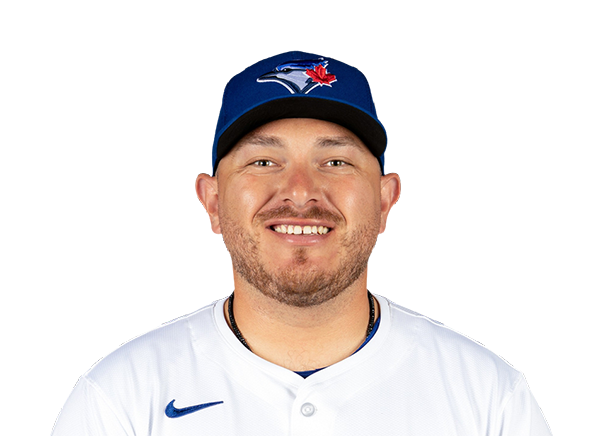 Alejandro Kirk | 2-5 | 5 | 1 | 2 | 2 | 0 | 0 | 0 | 14 | .274 | .345 | .413 |
 Kazuma Okamoto | 1-5 | 5 | 0 | 1 | 1 | 0 | 0 | 2 | 18 | .227 | .301 | .438 |
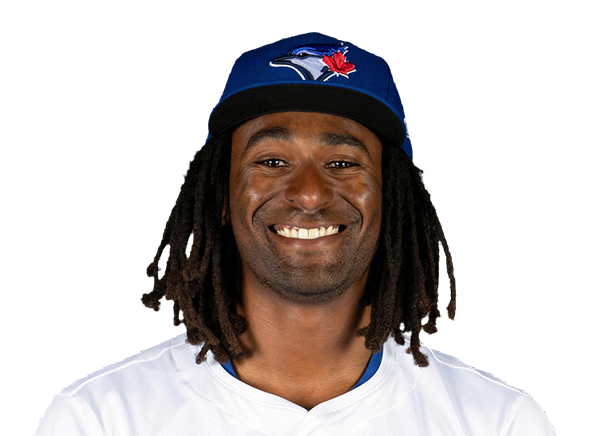 Charles McAdoo | 0-2 | 2 | 1 | 0 | 0 | 0 | 1 | 0 | 14 | .237 | .289 | .342 |
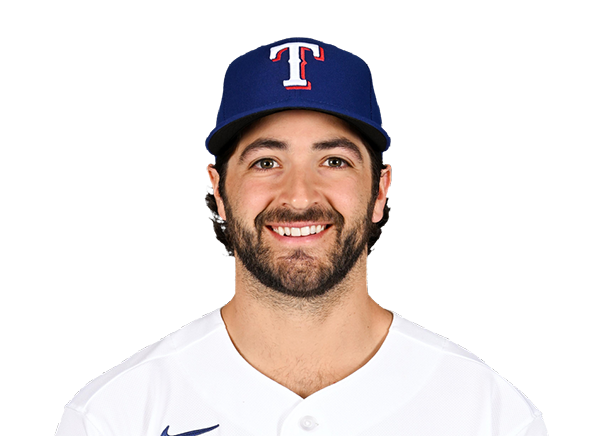 Josh Smith | 0-1 | 1 | 0 | 0 | 0 | 0 | 1 | 1 | 8 | .219 | .314 | .320 |
 Ernie Clement | 2-5 | 5 | 1 | 2 | 2 | 0 | 0 | 0 | 8 | .276 | .302 | .388 |
 Nathan Lukes | 1-4 | 4 | 1 | 1 | 0 | 0 | 0 | 0 | 15 | .265 | .316 | .389 |
 Myles Straw | 2-3 | 3 | 1 | 2 | 1 | 0 | 0 | 0 | 13 | .236 | .299 | .350 |
Kansas City Royals
| Player | H-AB | AB | R | H | RBI | HR | BB | K | #P | AVG | OBP | SLG |
|---|---|---|---|---|---|---|---|---|---|---|---|---|
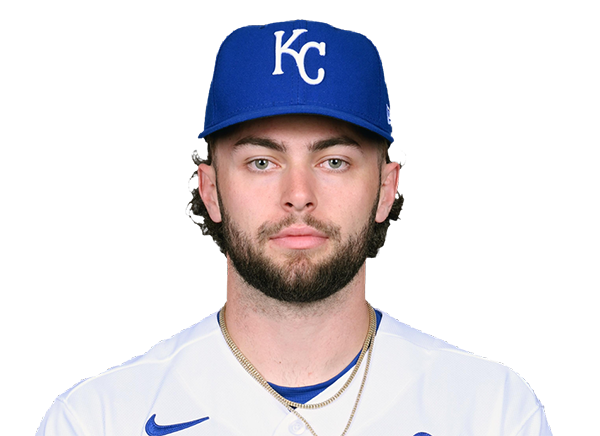 Carter Jensen | 1-4 | 4 | 0 | 1 | 0 | 0 | 0 | 2 | 19 | .231 | .316 | .443 |
 Luke Maile | 0-0 | 0 | 0 | 0 | 0 | 0 | 0 | 0 | 0 | .152 | .176 | .273 |
 Bobby Witt Jr. | 1-3 | 3 | 1 | 1 | 1 | 1 | 1 | 1 | 19 | .283 | .360 | .452 |
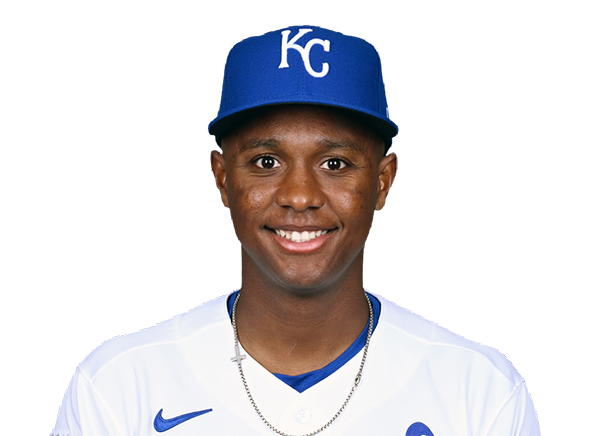 Tyler Tolbert | 0-0 | 0 | 0 | 0 | 0 | 0 | 0 | 0 | 0 | .307 | .375 | .430 |
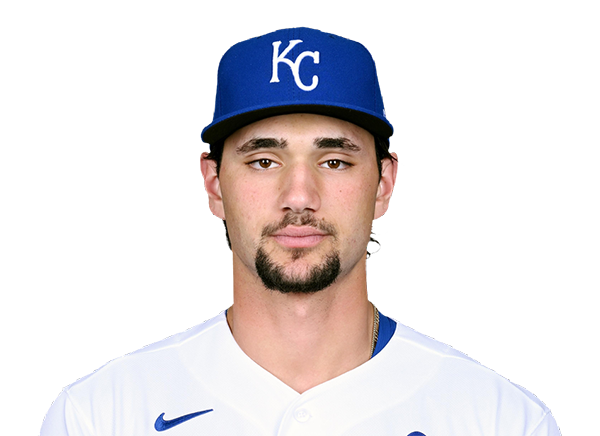 Jac Caglianone | 0-4 | 4 | 0 | 0 | 0 | 0 | 0 | 0 | 16 | .281 | .330 | .493 |
 Salvador Perez | 2-3 | 3 | 0 | 2 | 0 | 0 | 0 | 0 | 10 | .224 | .268 | .377 |
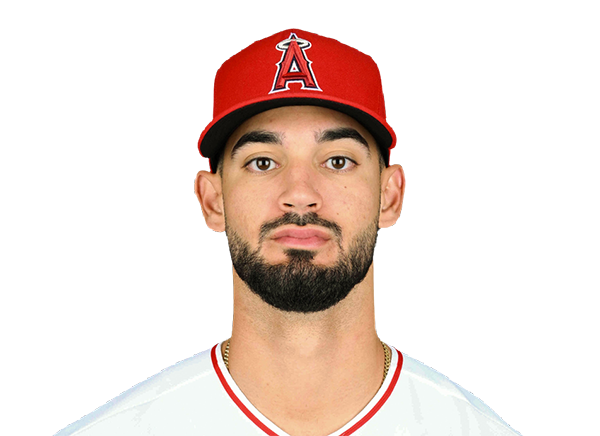 Matthew Lugo | 0-1 | 1 | 0 | 0 | 0 | 0 | 0 | 1 | 4 | .250 | .250 | .250 |
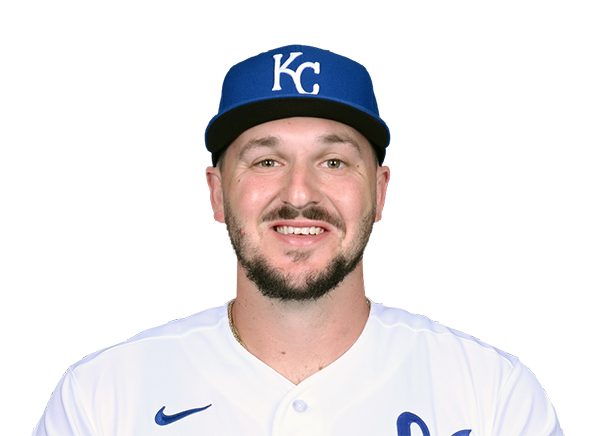 Vinnie Pasquantino | 1-4 | 4 | 1 | 1 | 1 | 1 | 0 | 0 | 7 | .241 | .328 | .382 |
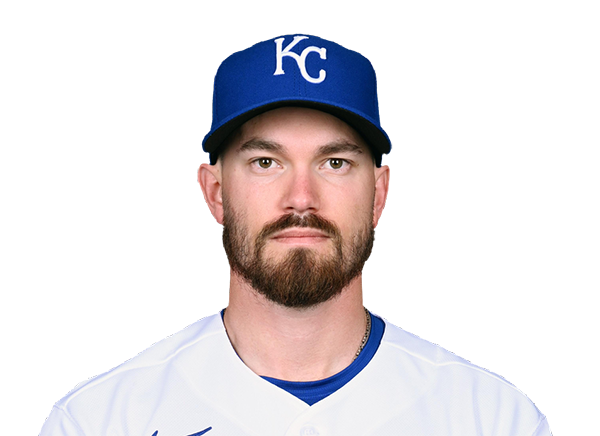 Nick Loftin | 0-4 | 4 | 0 | 0 | 0 | 0 | 0 | 1 | 12 | .237 | .326 | .388 |
 Michael Massey | 1-2 | 2 | 0 | 1 | 0 | 0 | 1 | 0 | 7 | .280 | .315 | .446 |
 Isaac Collins | 0-3 | 3 | 0 | 0 | 0 | 0 | 0 | 0 | 18 | .226 | .324 | .344 |
 Kyle Isbel | 0-3 | 3 | 0 | 0 | 0 | 0 | 0 | 0 | 18 | .232 | .279 | .350 |
Toronto Blue Jays
| Player | IP | H | R | ER | BB | K | HR | PC-ST | ERA | PC |
|---|---|---|---|---|---|---|---|---|---|---|
 Jameson Taillon | 2.0 | 2 | 1 | 1 | 0 | 1 | 1 | 29-18 | 5.65 | 29 |
 Joe Mantiply | 2.0 | 1 | 0 | 0 | 0 | 1 | 0 | 23-14 | 2.57 | 23 |
 Braydon Fisher | 1.0 | 0 | 0 | 0 | 1 | 0 | 0 | 14-7 | 3.21 | 14 |
 Brendon Little | 1.0 | 0 | 0 | 0 | 1 | 1 | 0 | 31-18 | 7.54 | 31 |
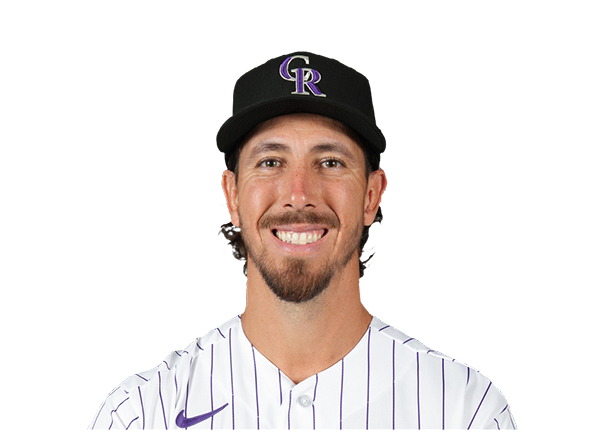 Michael Lorenzen | 3.0 | 3 | 1 | 1 | 0 | 2 | 1 | 33-27 | 7.03 | 33 |
Kansas City Royals
| Player | IP | H | R | ER | BB | K | HR | PC-ST | ERA | PC |
|---|---|---|---|---|---|---|---|---|---|---|
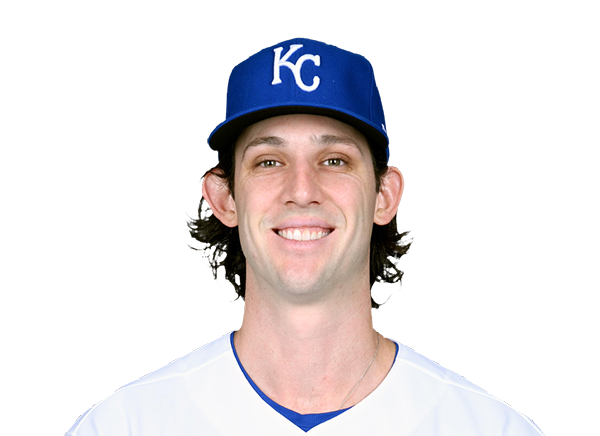 Daniel Lynch IV | 5.0 | 7 | 5 | 5 | 1 | 0 | 0 | 70-46 | 3.51 | 70 |
 Nolan Hoffman | 2.0 | 3 | 3 | 3 | 1 | 2 | 0 | 31-21 | 5.87 | 31 |
 Easton McGee | 2.0 | 3 | 1 | 1 | 1 | 1 | 1 | 33-19 | 6.97 | 33 |
H2H / Season Series
KC2–9
TOR
TOR2–13
KC
TOR3–0
KC
TOR3–5
KC
Last 5 Games
| Date | Opponent | Result |
|---|---|---|
| Sep 4 | @ KC | W9–2 |
| Sep 3 |  @ CLE | W6–3 |
| Sep 2 | @ CLE | W11–0 |
| Sep 1 | @ CLE | L1–6 |
| Aug 30 |  vs SEA | W7–0 |
| Date | Opponent | Result |
|---|---|---|
| Sep 4 | vs TOR | L2–9 |
| Sep 3 |  vs MIA | W7–3 |
| Sep 2 | vs MIA | L6–9 |
| Sep 1 | vs MIA | L3–6 |
| Aug 30 | @ CLE | L1–11 |
Standings
American League
| Team | W | L | PCT | GB | DIFF | STRK |
|---|---|---|---|---|---|---|
1 Rays | 85 | 57 | .599 | - | +49 | W2 |
2 White Sox | 74 | 68 | .521 | 11 | +40 | L1 |
3 Astros | 73 | 70 | .510 | 12.5 | -37 | L1 |
4 Yankees | 81 | 61 | .570 | 4 | +118 | W1 |
5 Red Sox | 78 | 65 | .545 | 7.5 | +84 | W3 |
| 6Blue Jays | 72 | 71 | .503 | 13.5 | -33 | W4 |
| 7Guardians | 72 | 71 | .503 | 13.5 | -15 | L1 |
8 Rangers | 70 | 73 | .490 | 15.5 | -46 | L2 |
9 Orioles | 69 | 74 | .483 | 16.5 | -27 | L5 |
10 Twins | 68 | 74 | .479 | 17 | -39 | W1 |
| 11Mariners | 66 | 77 | .462 | 19.5 | -73 | L3 |
12 Tigers | 65 | 77 | .458 | 20 | +51 | W1 |
| 13Royals | 63 | 80 | .441 | 22.5 | -93 | L2 |
14 Athletics | 57 | 86 | .399 | 28.5 | -186 | W4 |
15 Angels | 54 | 88 | .380 | 31 | -76 | W1 |
National League
| Team | W | L | PCT | GB | DIFF | STRK |
|---|---|---|---|---|---|---|
1 Brewers | 88 | 55 | .615 | - | +172 | L1 |
2 Dodgers | 85 | 57 | .599 | 2.5 | +150 | W3 |
3 Braves | 84 | 58 | .592 | 3.5 | +119 | L1 |
4 Cubs | 81 | 62 | .566 | 7 | +139 | W3 |
5 Phillies | 80 | 62 | .563 | 7.5 | +35 | W1 |
6 Diamondbacks | 75 | 68 | .524 | 13 | -2 | W1 |
7 Padres | 74 | 68 | .521 | 13.5 | +7 | L1 |
| 8Marlins | 71 | 72 | .497 | 17 | +8 | L3 |
9 Cardinals | 71 | 72 | .497 | 17 | -11 | L1 |
10 Pirates | 70 | 73 | .490 | 18 | +25 | L1 |
11 Reds | 68 | 74 | .479 | 19.5 | -109 | W1 |
12 Nationals | 67 | 77 | .465 | 21.5 | +11 | L3 |
13 Mets | 64 | 78 | .451 | 23.5 | -50 | L1 |
14 Giants | 59 | 84 | .413 | 29 | -73 | W1 |
15 Rockies | 55 | 87 | .387 | 32.5 | -138 | W1 |
TOR
VS
KC
Pitchers
Jameson Taillon
Catchers
Alejandro Kirk
Infielders
Vladimir Guerrero Jr.
Kazuma Okamoto
Charles McAdoo
Ernie Clement
Outfielders
Brett Bateman
Nathan Lukes
Myles Straw
Designated Hitters
George Springer
Pitchers
Daniel Lynch IV
Catchers
Carter Jensen
Infielders
Bobby Witt Jr.
Vinnie Pasquantino
Nick Loftin
Michael Massey
Outfielders
Jac Caglianone
Isaac Collins
Kyle Isbel
Designated Hitters
Salvador Perez
Blue Jays
VS
Royals
Batting
142
Team Games Played
142
4789
At Bats
4764
1182
Hits
1180
548
Runs Batted In
579
134
Home Runs
148
71
Stolen Bases
114
.247
Batting Average
.248
575
Runs
608
229
Doubles
257
8
Triples
19
1829
Total Bases
1919
396
Walks
446
1025
Strikeouts
1107
.309
On Base Percentage
.316
.382
Slugging Percentage
.403
.691
OBP Pct + SLG Pct
.719
142
Games Played
142
142
Games Started
142
52
Hit By Pitch
48
0.0
Wins Above Replacement
0.0
0.0
Offensive Wins Above Replacement
0.0
14
Caught Stealing
30
1
Is Qualified
1
569.4
Runs Created
620.8
4.1
Runs Created Per 27 Outs
4.4
.075
Walks Per Plate Appearance
.084
0.39
Walk To Strikeout Ratio
0.40
.135
Isolated Power
.155
.230
Secondary Average
.266
3.80
Pitches Per Plate Appearance
3.80
371
Extra Base Hits
424
5307
Plate Appearances
5327
35.7
At Bats Per Home Run
32.2
23
Sacrifice Hit
24
44
Sacrifice Flies
43
Pitching
142
Team Games Played
142
44
Quality Starts
57
71
Wins
63
71
Losses
79
48
Saves
34
91
Holds
70
1122
Hits
1228
549
Earned runs
657
146
Home Runs
176
519
Walks
511
1234
Strikeouts
1033
8.8
Strikeouts Per 9 Innings
7.4
149.0
Pitches Per Start
146.6
1.30
Walks Plus Hits Per Inning Pitched
1.39
3.91
Earned Run Average
4.74
71
Losses
79
1263.1
Innings pitched
1248.1
.500
Win Percentage
.444
63
Save Opportunities
58
.237
Opponent Batting Average
.258
.315
Opponent's On-base pct.
.335
.373
Opponent's Slugging pct.
.432
.688
Opponent's OPB Pct + SLG Pct
.767
4732
At Bats
4764
187
Doubles
258
9
Triples
22
37
Batters Hit
57
131
Stolen Bases
66
142
Games Played
142
1
Complete Games
2
11
Shutouts
8
45
Wild Pitches
49
578
Runs Batted In
669
6
Balks
3
1263.1
Innings pitched
1248.1
8.8
Strikeouts Per 9 Innings
7.4
41
Caught Stealing
33
142
Games Started
142
0.0
Wins Above Replacement
0.0
1
Is Qualified
1
609
Runs
700
549
Earned Runs
657
1765
Total Bases
2058
Fielding
142
Team Games Played
142
1263
Full Innings
1248
5068
Total Chances
5096
3790
Putouts
3745
1196
Assists
1290
82
Errors
61
229
Double Plays
257
0.984
Fielding Percentage
0.988
35.5
Range Factor
36.3
0.0
Zone Rating
0.0
142
Games Played
142
0
Games Started
0
0.0
Defensive Wins Above Replacement
0.0
1
Qualified
1