

Braves vs Astros Live Score (19 Sep, 2026)
Game Information
Stage
STD
Season
2026
First Pitch
Sat, Sep 19, 7:10 pm
Venue
Daikin Park
Location
Houston, Texas
Venue Type
Indoor
Broadcast
MLB.TV
Attendance
41,147
Live Situation
2Balls
3Strikes
0Outs
—Pitcher
—At Bat
Pitch Sequence
1
STRIKE LOOKING
Sinker
95 MPH
2
STRIKE SWINGING
Four-seam FB
97 MPH
3
BALL
Four-seam FB
98 MPH
4
BALL
Slider
83 MPH
5
STRIKE SWINGING
Changeup
90 MPH
Injury Report






Team Stats
 ATL
HOU

6
Runs
3
11
Hits
10
0
Errors
0
2
Home Runs
1
4
Walks
1
4
Strikeouts
7
Player Box Score
Atlanta Braves
| Player | H-AB | AB | R | H | RBI | HR | BB | K | #P | AVG | OBP | SLG |
|---|---|---|---|---|---|---|---|---|---|---|---|---|
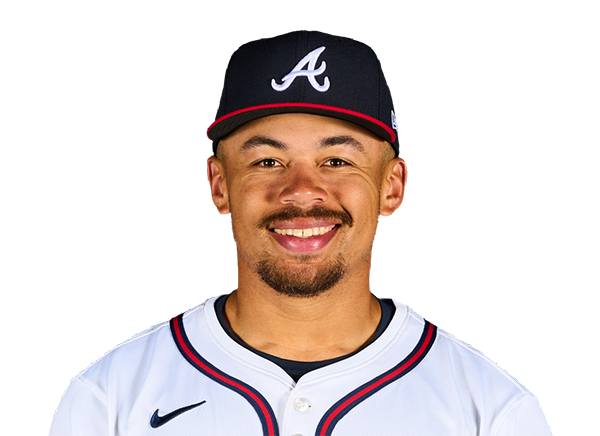 Drake Baldwin |
3-5 | 5 | 1 | 3 | 0 | 0 | 0 | 1 | 30 | .282 | .356 | .458 |
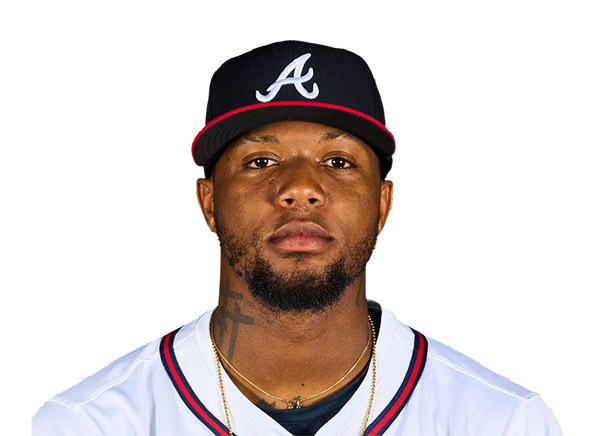 Ronald Acuna Jr. |
2-3 | 3 | 1 | 2 | 4 | 1 | 2 | 0 | 19 | .259 | .351 | .464 |
 Matt Olson |
2-4 | 4 | 0 | 2 | 1 | 0 | 0 | 0 | 14 | .255 | .326 | .509 |
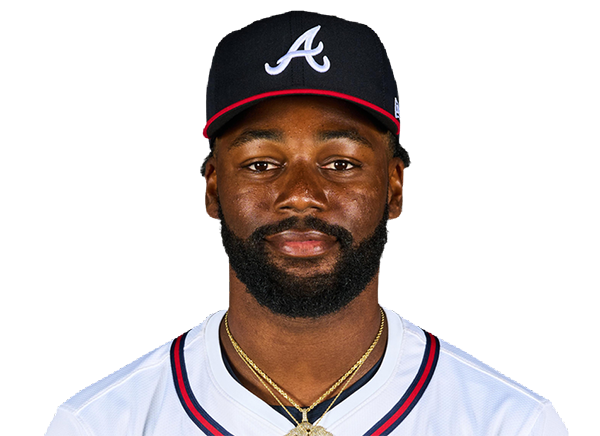 Michael Harris II |
0-4 | 4 | 0 | 0 | 0 | 0 | 0 | 0 | 11 | .290 | .316 | .488 |
 Mauricio Dubon |
1-4 | 4 | 0 | 1 | 0 | 0 | 0 | 1 | 14 | .273 | .319 | .393 |
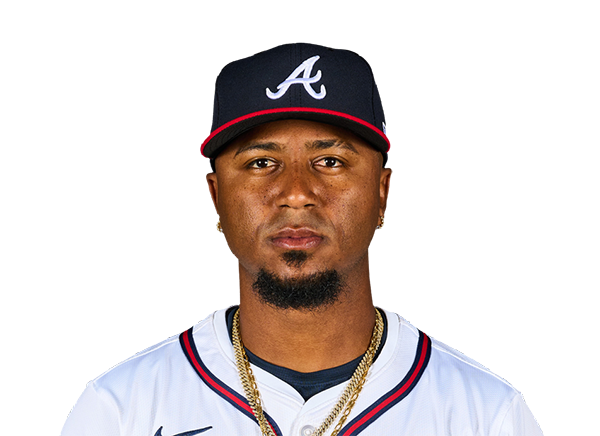 Ozzie Albies |
0-4 | 4 | 0 | 0 | 0 | 0 | 0 | 1 | 20 | .242 | .298 | .403 |
 Mike Yastrzemski |
2-4 | 4 | 2 | 2 | 1 | 1 | 0 | 1 | 15 | .228 | .311 | .383 |
 Austin Riley |
1-4 | 4 | 1 | 1 | 0 | 0 | 0 | 0 | 12 | .220 | .292 | .360 |
 Sean Murphy |
0-2 | 2 | 1 | 0 | 0 | 0 | 2 | 0 | 21 | .179 | .250 | .316 |
Houston Astros
| Player | H-AB | AB | R | H | RBI | HR | BB | K | #P | AVG | OBP | SLG |
|---|---|---|---|---|---|---|---|---|---|---|---|---|
 Jeremy Pena |
1-4 | 4 | 1 | 1 | 0 | 0 | 0 | 2 | 21 | .276 | .326 | .475 |
 Yordan Alvarez |
1-4 | 4 | 0 | 1 | 0 | 0 | 0 | 0 | 15 | .312 | .429 | .597 |
 Isaac Paredes |
2-3 | 3 | 2 | 2 | 2 | 1 | 1 | 0 | 15 | .261 | .359 | .437 |
 Jose Altuve |
3-4 | 4 | 0 | 3 | 0 | 0 | 0 | 0 | 12 | .247 | .306 | .395 |
 Yainer Diaz |
1-4 | 4 | 0 | 1 | 1 | 0 | 0 | 0 | 11 | .276 | .307 | .436 |
 Daulton Varsho |
0-3 | 3 | 0 | 0 | 0 | 0 | 0 | 1 | 9 | .221 | .281 | .355 |
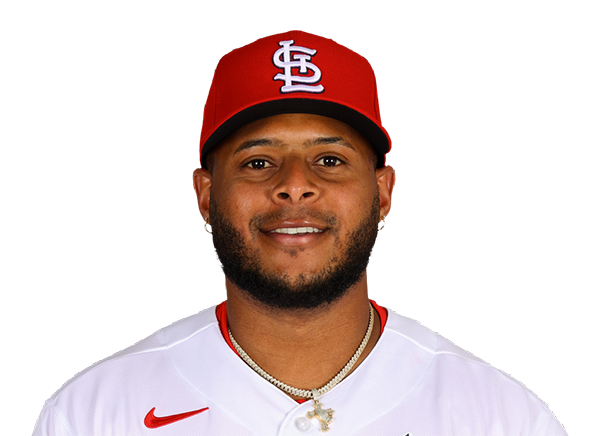 Nelson Velazquez |
0-1 | 1 | 0 | 0 | 0 | 0 | 0 | 1 | 5 | .194 | .257 | .418 |
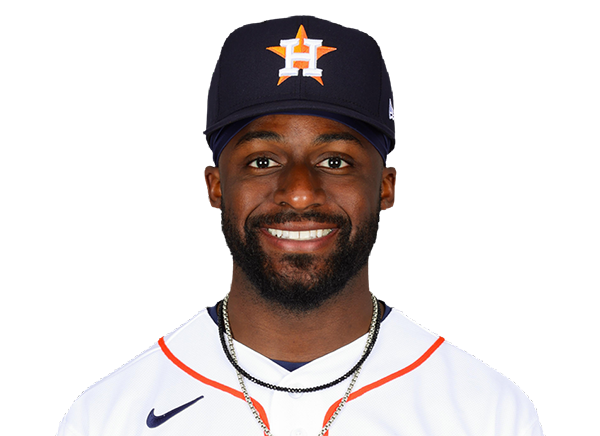 Taylor Trammell |
0-0 | 0 | 0 | 0 | 0 | 0 | 0 | 0 | 0 | .202 | .290 | .360 |
 Christian Walker |
2-4 | 4 | 0 | 2 | 0 | 0 | 0 | 0 | 21 | .222 | .295 | .409 |
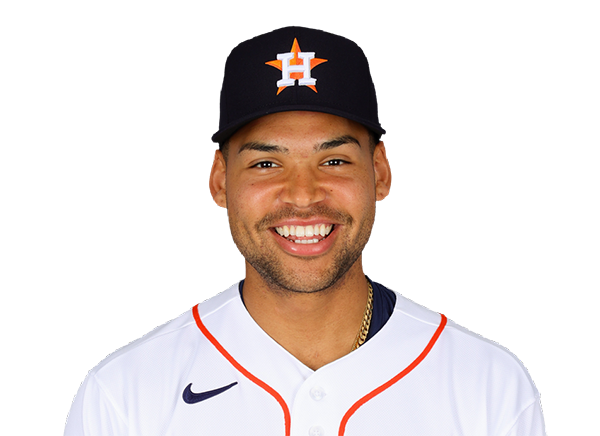 Cam Smith |
0-4 | 4 | 0 | 0 | 0 | 0 | 0 | 2 | 11 | .210 | .276 | .392 |
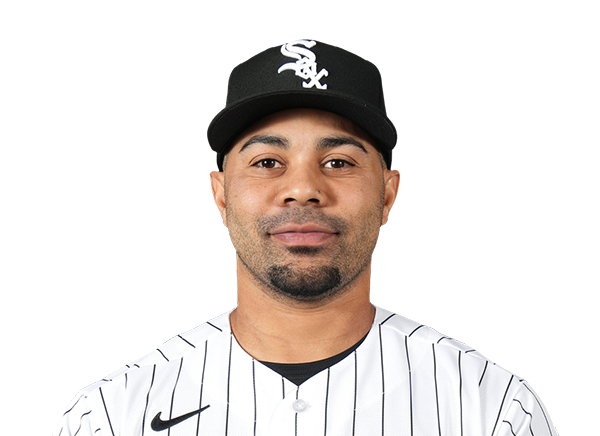 LaMonte Wade Jr. |
0-4 | 4 | 0 | 0 | 0 | 0 | 0 | 1 | 20 | .208 | .308 | .352 |
Atlanta Braves
| Player | IP | H | R | ER | BB | K | HR | PC-ST | ERA | PC |
|---|---|---|---|---|---|---|---|---|---|---|
 Grant Holmes |
6.0 | 8 | 2 | 2 | 0 | 4 | 1 | 87-58 | 3.47 | 87 |
 Victor Mederos |
1.0 | 0 | 0 | 0 | 0 | 1 | 0 | 13-8 | 3.73 | 13 |
 Dylan Lee |
1.0 | 2 | 1 | 1 | 1 | 1 | 0 | 26-16 | 3.18 | 26 |
 Raisel Iglesias |
1.0 | 0 | 0 | 0 | 0 | 1 | 0 | 14-9 | 2.64 | 14 |
Houston Astros
| Player | IP | H | R | ER | BB | K | HR | PC-ST | ERA | PC |
|---|---|---|---|---|---|---|---|---|---|---|
 Hayden Wesneski |
5.1 | 4 | 1 | 1 | 3 | 3 | 0 | 79-50 | 3.50 | 79 |
 Bennett Sousa |
0.2 | 0 | 0 | 0 | 0 | 0 | 0 | 7-5 | 5.27 | 7 |
 AJ Blubaugh |
0.1 | 2 | 3 | 3 | 1 | 0 | 0 | 22-13 | 3.70 | 22 |
 Bryan Abreu |
0.2 | 2 | 1 | 1 | 0 | 1 | 1 | 15-10 | 3.88 | 15 |
 Logan VanWey |
2.0 | 3 | 1 | 1 | 0 | 0 | 1 | 33-25 | 2.25 | 33 |
H2H / Season Series
HOU3–6
ATL
HOU2–6
ATL
Last 5 Games
| Date | Opponent | Result |
|---|---|---|
| Sep 19 | @ HOU | W6–3 |
| Sep 18 | @ HOU | W6–2 |
| Sep 16 |  @ CHC | L4–8 |
| Sep 15 | @ CHC | W6–3 |
| Sep 14 | @ CHC | L3–7 |
| Date | Opponent | Result |
|---|---|---|
| Sep 19 | vs ATL | L3–6 |
| Sep 18 | vs ATL | L2–6 |
| Sep 17 |  vs KC | W6–2 |
| Sep 16 | vs KC | L2–5 |
| Sep 15 | vs KC | W4–2 |
Standings
American League
| Team | W | L | PCT | GB | DIFF | STRK |
|---|---|---|---|---|---|---|
1 Rays | 94 | 60 | .610 | - | +79 | W1 |
2 Guardians | 80 | 75 | .516 | 14.5 | +1 | W4 |
3 Rangers | 78 | 77 | .503 | 16.5 | -29 | W2 |
4 Yankees | 89 | 65 | .578 | 5 | +141 | L1 |
5 Red Sox | 84 | 71 | .542 | 10.5 | +84 | L1 |
6 White Sox | 79 | 76 | .510 | 15.5 | +35 | W1 |
| 7Astros | 77 | 78 | .497 | 17.5 | -57 | L2 |
8 Blue Jays | 76 | 79 | .490 | 18.5 | -47 | L2 |
9 Orioles | 75 | 80 | .484 | 19.5 | -28 | L2 |
10 Tigers | 73 | 82 | .471 | 21.5 | +75 | L1 |
11 Mariners | 72 | 83 | .465 | 22.5 | -57 | L1 |
12 Twins | 72 | 83 | .465 | 22.5 | -72 | L1 |
| 13Royals | 67 | 88 | .432 | 27.5 | -101 | L3 |
14 Athletics | 61 | 94 | .394 | 33.5 | -222 | L5 |
15 Angels | 60 | 95 | .387 | 34.5 | -79 | W1 |
National League
| Team | W | L | PCT | GB | DIFF | STRK |
|---|---|---|---|---|---|---|
1 Brewers | 97 | 58 | .626 | - | +199 | W2 |
2 Dodgers | 95 | 60 | .613 | 2 | +191 | W3 |
| 3Braves | 91 | 64 | .587 | 6 | +118 | W2 |
| 4Cubs | 86 | 69 | .555 | 11 | +144 | W1 |
5 Padres | 86 | 69 | .555 | 11 | +37 | W4 |
6 Phillies | 85 | 70 | .548 | 12 | +24 | L2 |
7 Diamondbacks | 81 | 74 | .523 | 16 | -5 | W1 |
8 Pirates | 78 | 77 | .503 | 19 | +28 | W3 |
9 Marlins | 76 | 79 | .490 | 21 | +1 | L2 |
10 Cardinals | 75 | 80 | .484 | 22 | -25 | L4 |
11 Nationals | 73 | 82 | .471 | 24 | +14 | W2 |
12 Reds | 72 | 83 | .465 | 25 | -155 | L1 |
13 Mets | 71 | 84 | .458 | 26 | -36 | W2 |
14 Giants | 64 | 91 | .413 | 33 | -82 | L2 |
15 Rockies | 57 | 98 | .368 | 40 | -176 | W1 |
ATL
VS
HOU
Pitchers
Grant Holmes
Catchers
Sean Murphy
Infielders
Matt Olson
Mauricio Dubon
Ozzie Albies
Austin Riley
Outfielders
Ronald Acuna Jr.
Michael Harris II
Mike Yastrzemski
Designated Hitters
Drake Baldwin
Pitchers
Hayden Wesneski
Catchers
Yainer Diaz
Infielders
Jeremy Pena
Isaac Paredes
Jose Altuve
Christian Walker
Outfielders
Daulton Varsho
Cam Smith
LaMonte Wade Jr.
Designated Hitters
Yordan Alvarez
Braves
VS
Astros
Batting
155
Team Games Played
155
5239
At Bats
5201
1300
Hits
1247
688
Runs Batted In
655
197
Home Runs
207
80
Stolen Bases
46
.248
Batting Average
.240
718
Runs
686
244
Doubles
228
12
Triples
19
2159
Total Bases
2134
446
Walks
500
1252
Strikeouts
1271
.311
On Base Percentage
.313
.412
Slugging Percentage
.410
.723
OBP Pct + SLG Pct
.723
155
Games Played
155
155
Games Started
155
54
Hit By Pitch
72
0.0
Wins Above Replacement
0.0
0.0
Offensive Wins Above Replacement
0.0
23
Caught Stealing
20
1
Is Qualified
1
682.4
Runs Created
670.8
4.5
Runs Created Per 27 Outs
4.4
.077
Walks Per Plate Appearance
.086
0.36
Walk To Strikeout Ratio
0.39
.164
Isolated Power
.171
.260
Secondary Average
.272
3.89
Pitches Per Plate Appearance
3.88
453
Extra Base Hits
454
5795
Plate Appearances
5830
26.6
At Bats Per Home Run
25.1
9
Sacrifice Hit
18
44
Sacrifice Flies
37
Pitching
155
Team Games Played
155
61
Quality Starts
43
91
Wins
77
64
Losses
78
48
Saves
48
103
Holds
87
1203
Hits
1227
554
Earned runs
692
171
Home Runs
200
514
Walks
622
1293
Strikeouts
1345
8.5
Strikeouts Per 9 Innings
8.8
143.8
Pitches Per Start
151.4
1.25
Walks Plus Hits Per Inning Pitched
1.35
3.62
Earned Run Average
4.53
64
Losses
78
1376.0
Innings pitched
1374.2
.587
Win Percentage
.497
67
Save Opportunities
60
.234
Opponent Batting Average
.238
.308
Opponent's On-base pct.
.329
.381
Opponent's Slugging pct.
.404
.689
Opponent's OPB Pct + SLG Pct
.733
5150
At Bats
5151
199
Doubles
209
23
Triples
23
57
Batters Hit
88
109
Stolen Bases
123
155
Games Played
155
1
Complete Games
0
10
Shutouts
9
29
Wild Pitches
51
578
Runs Batted In
709
4
Balks
6
1376.0
Innings pitched
1374.2
8.5
Strikeouts Per 9 Innings
8.8
19
Caught Stealing
39
155
Games Started
155
0.0
Wins Above Replacement
0.0
1
Is Qualified
1
600
Runs
743
554
Earned Runs
692
1961
Total Bases
2082
Fielding
155
Team Games Played
155
1376
Full Innings
1375
5474
Total Chances
5342
4128
Putouts
4124
1281
Assists
1149
65
Errors
69
244
Double Plays
228
0.988
Fielding Percentage
0.987
35.4
Range Factor
34.5
0.0
Zone Rating
0.0
155
Games Played
155
0
Games Started
0
0.0
Defensive Wins Above Replacement
0.0
1
Qualified
1