

Braves vs Cubs Live Score (14 Sep, 2026)
Game Information
Stage
STD
Season
2026
First Pitch
Mon, Sep 14, 7:40 pm
Venue
Wrigley Field
Location
Chicago, Illinois
Venue Type
Outdoor
Broadcast
MLB.TV
Attendance
34,515
Live Situation
0Balls
0Strikes
0Outs
—Pitcher
—At Bat
Pitch Sequence
1
BALL IN PLAY
Sinker
97 MPH
Injury Report


Team Stats
 ATL
CHC

3
Runs
7
8
Hits
10
0
Errors
1
1
Home Runs
1
5
Walks
5
9
Strikeouts
4
Player Box Score
Atlanta Braves
| Player | H-AB | AB | R | H | RBI | HR | BB | K | #P | AVG | OBP | SLG |
|---|---|---|---|---|---|---|---|---|---|---|---|---|
 Ronald Acuna Jr. |
0-4 | 4 | 0 | 0 | 0 | 0 | 1 | 1 | 21 | .255 | .348 | .442 |
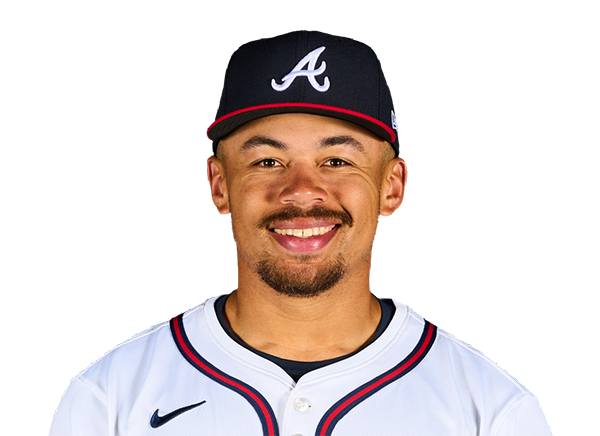 Drake Baldwin |
2-3 | 3 | 0 | 2 | 0 | 0 | 1 | 1 | 16 | .279 | .354 | .451 |
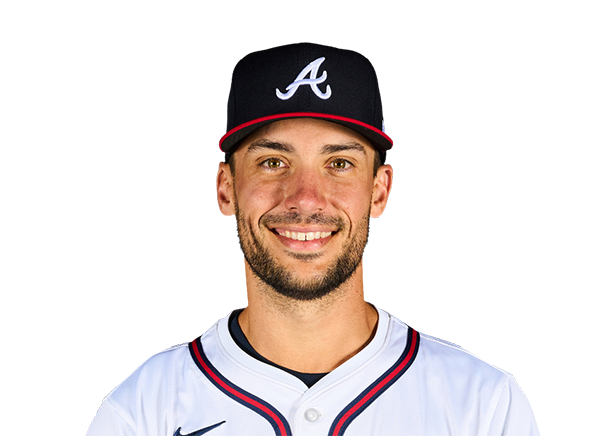 Matt Olson |
0-3 | 3 | 0 | 0 | 0 | 0 | 1 | 3 | 16 | .248 | .323 | .505 |
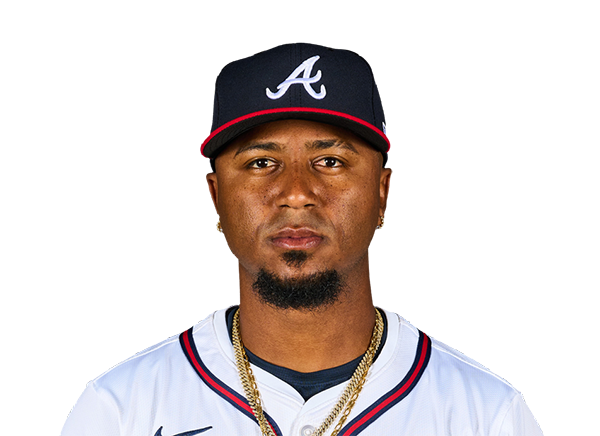 Ozzie Albies |
0-4 | 4 | 0 | 0 | 0 | 0 | 0 | 1 | 13 | .243 | .298 | .403 |
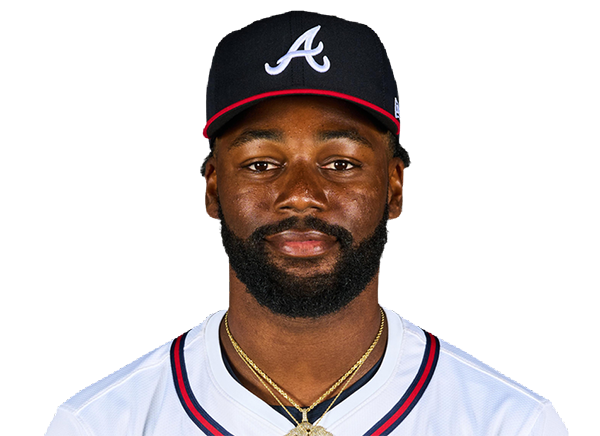 Michael Harris II |
2-4 | 4 | 1 | 2 | 0 | 0 | 0 | 0 | 7 | .292 | .319 | .490 |
 Mauricio Dubon |
2-3 | 3 | 0 | 2 | 0 | 0 | 1 | 0 | 19 | .270 | .316 | .386 |
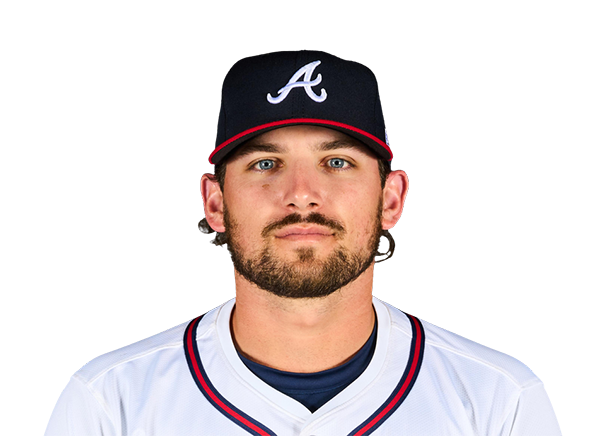 Austin Riley |
1-4 | 4 | 0 | 1 | 0 | 0 | 0 | 0 | 16 | .223 | .295 | .366 |
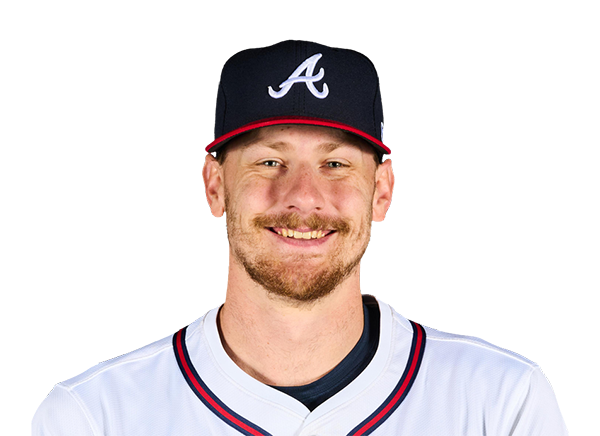 Sean Murphy |
0-4 | 4 | 1 | 0 | 1 | 0 | 0 | 2 | 20 | .200 | .261 | .353 |
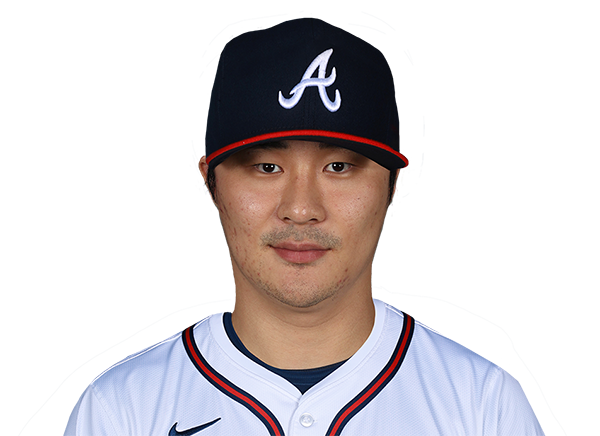 Ha-Seong Kim |
0-2 | 2 | 0 | 0 | 0 | 0 | 0 | 1 | 7 | .126 | .224 | .135 |
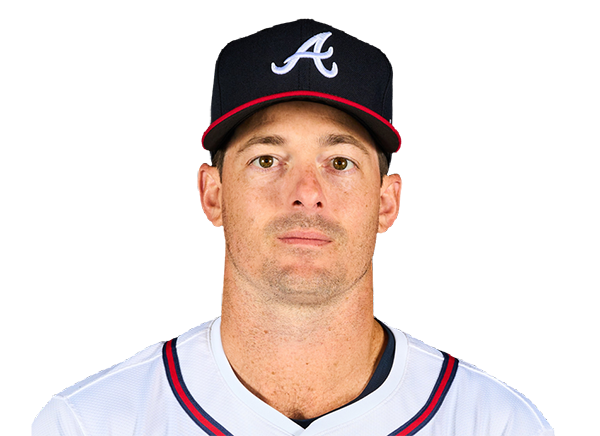 Mike Yastrzemski |
1-1 | 1 | 1 | 1 | 2 | 1 | 1 | 0 | 17 | .231 | .316 | .383 |
Chicago Cubs
| Player | H-AB | AB | R | H | RBI | HR | BB | K | #P | AVG | OBP | SLG |
|---|---|---|---|---|---|---|---|---|---|---|---|---|
 Pete Crow-Armstrong |
4-5 | 5 | 1 | 4 | 4 | 1 | 0 | 0 | 16 | .281 | .374 | .571 |
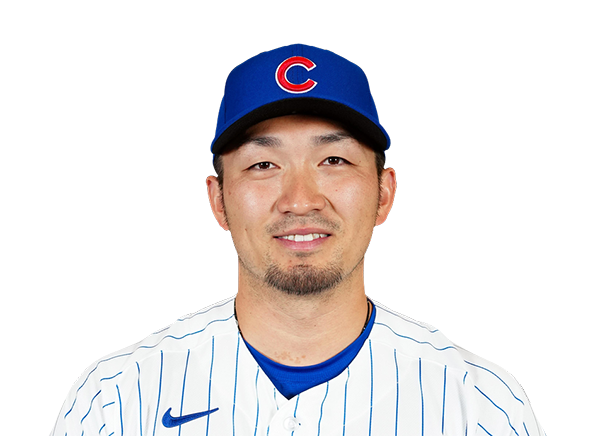 Seiya Suzuki |
1-5 | 5 | 0 | 1 | 0 | 0 | 0 | 2 | 23 | .268 | .367 | .474 |
 Michael Busch |
0-2 | 2 | 1 | 0 | 0 | 0 | 2 | 1 | 24 | .238 | .347 | .395 |
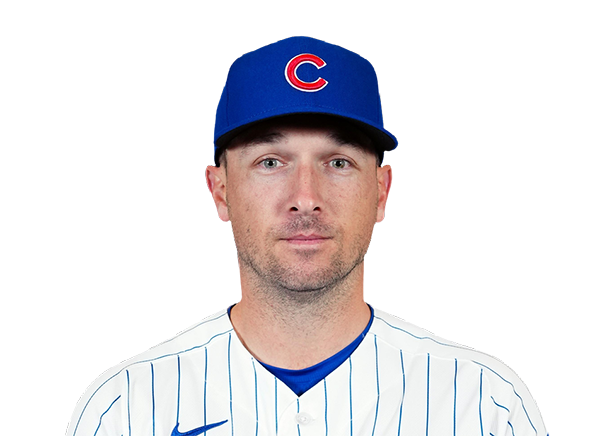 Alex Bregman |
0-4 | 4 | 0 | 0 | 0 | 0 | 0 | 0 | 12 | .262 | .352 | .448 |
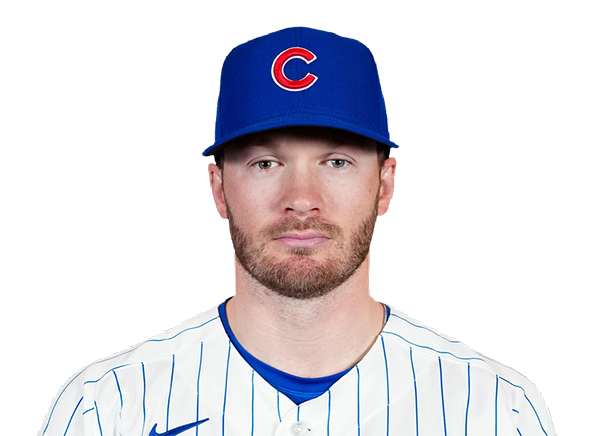 Ian Happ |
1-3 | 3 | 1 | 1 | 0 | 0 | 1 | 0 | 20 | .219 | .329 | .410 |
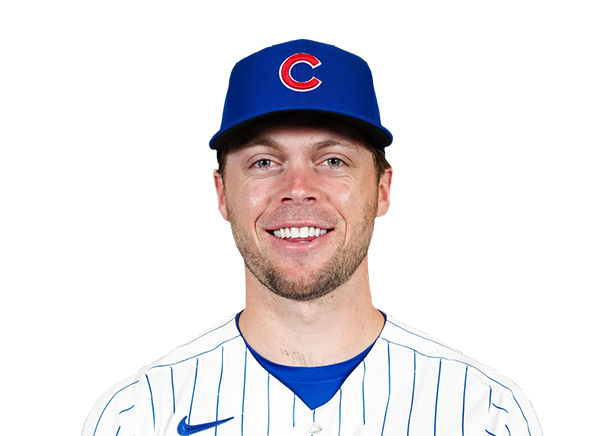 Nico Hoerner |
2-4 | 4 | 2 | 2 | 1 | 0 | 0 | 0 | 9 | .267 | .319 | .359 |
 Michael Conforto |
1-4 | 4 | 0 | 1 | 1 | 0 | 0 | 1 | 11 | .238 | .335 | .475 |
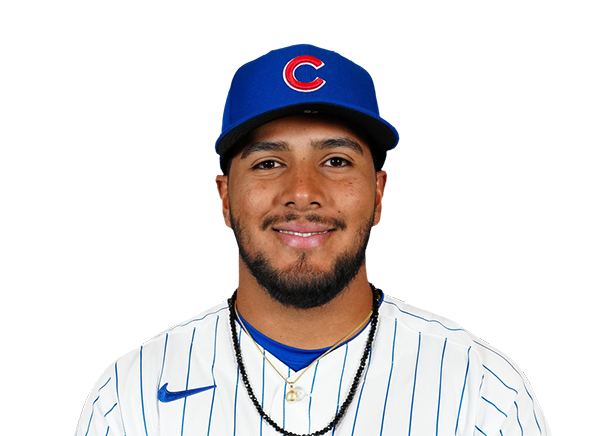 Pedro Ramirez |
0-3 | 3 | 0 | 0 | 0 | 0 | 1 | 0 | 14 | .258 | .320 | .421 |
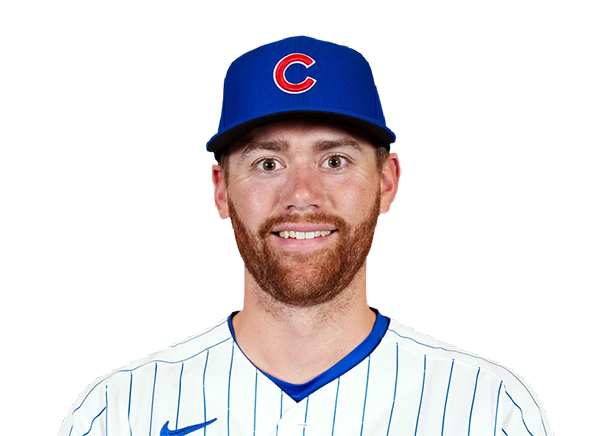 Carson Kelly |
1-3 | 3 | 2 | 1 | 1 | 0 | 1 | 0 | 14 | .261 | .340 | .387 |
Atlanta Braves
| Player | IP | H | R | ER | BB | K | HR | PC-ST | ERA | PC |
|---|---|---|---|---|---|---|---|---|---|---|
 Reynaldo Lopez |
3.0 | 6 | 5 | 5 | 2 | 2 | 0 | 62-35 | 4.54 | 62 |
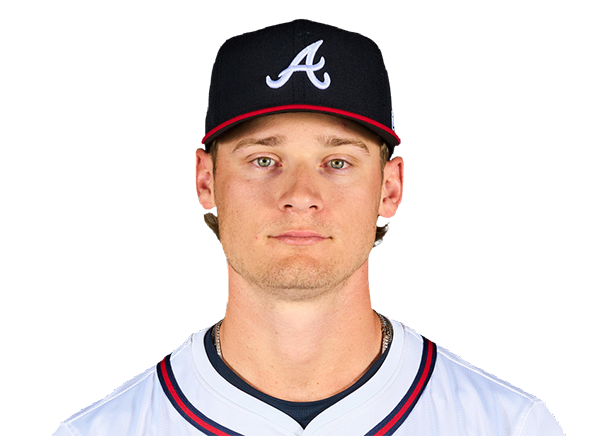 AJ Smith-Shawver |
5.0 | 4 | 2 | 2 | 3 | 2 | 1 | 81-53 | 6.92 | 81 |
Chicago Cubs
| Player | IP | H | R | ER | BB | K | HR | PC-ST | ERA | PC |
|---|---|---|---|---|---|---|---|---|---|---|
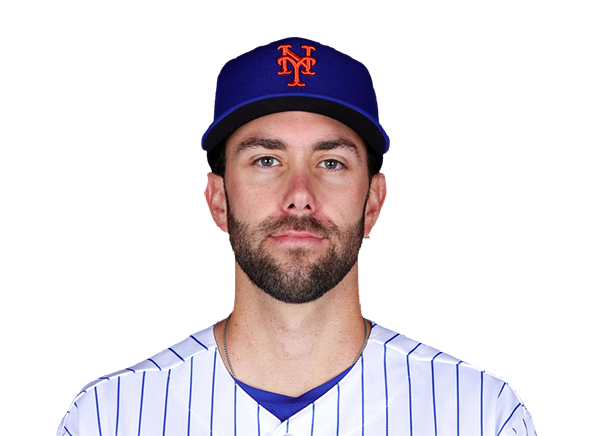 David Peterson |
6.0 | 3 | 1 | 1 | 3 | 7 | 0 | 85-56 | 5.11 | 85 |
 Javier Assad |
1.0 | 2 | 2 | 2 | 0 | 1 | 1 | 30-19 | 3.70 | 30 |
 Ryan Rolison |
1.0 | 1 | 0 | 0 | 1 | 0 | 0 | 13-6 | 2.72 | 13 |
 Ryan Zeferjahn |
1.0 | 2 | 0 | 0 | 1 | 1 | 0 | 24-16 | 4.09 | 24 |
H2H / Season Series
CHC7–3
ATL
ATL0–2
CHC
ATL4–1
CHC
ATL5–2
CHC
Last 5 Games
| Date | Opponent | Result |
|---|---|---|
| Sep 14 | @ CHC | L3–7 |
| Sep 13 |  vs PHI | L4–9 |
| Sep 12 | vs PHI | W12–2 |
| Sep 11 | vs PHI | W6–5 |
| Sep 10 |  vs TB | W3–1 |
| Date | Opponent | Result |
|---|---|---|
| Sep 14 | vs ATL | W7–3 |
| Sep 13 |  vs PIT | L3–4 |
| Sep 12 | vs PIT | W4–3 |
| Sep 11 | vs PIT | W12–2 |
| Sep 9 |  @ MIL | L6–8 |
Standings
American League
| Team | W | L | PCT | GB | DIFF | STRK |
|---|---|---|---|---|---|---|
| 1Rays | 90 | 59 | .604 | - | +69 | W3 |
2 White Sox | 77 | 73 | .513 | 13.5 | +38 | W1 |
3 Astros | 75 | 75 | .500 | 15.5 | -53 | L3 |
4 Yankees | 87 | 63 | .580 | 3.5 | +130 | W2 |
5 Red Sox | 82 | 68 | .547 | 8.5 | +88 | W2 |
6 Guardians | 76 | 75 | .503 | 15 | -11 | L1 |
7 Blue Jays | 75 | 76 | .497 | 16 | -32 | L1 |
8 Rangers | 74 | 76 | .493 | 16.5 | -44 | W2 |
9 Orioles | 73 | 78 | .483 | 18 | -34 | W1 |
10 Tigers | 71 | 79 | .473 | 19.5 | +71 | W5 |
11 Twins | 70 | 80 | .467 | 20.5 | -67 | L2 |
12 Mariners | 70 | 81 | .464 | 21 | -60 | L2 |
13 Royals | 66 | 84 | .440 | 24.5 | -94 | L2 |
14 Athletics | 61 | 89 | .407 | 29.5 | -203 | W1 |
15 Angels | 57 | 93 | .380 | 33.5 | -74 | W1 |
National League
| Team | W | L | PCT | GB | DIFF | STRK |
|---|---|---|---|---|---|---|
| 1Brewers | 93 | 57 | .620 | - | +195 | L1 |
2 Dodgers | 91 | 59 | .607 | 2 | +173 | W1 |
| 3Braves | 88 | 63 | .583 | 5.5 | +112 | L2 |
| 4Cubs | 84 | 67 | .556 | 9.5 | +142 | W1 |
| 5Phillies | 83 | 67 | .553 | 10 | +31 | W1 |
6 Padres | 82 | 68 | .547 | 11 | +23 | W8 |
7 Diamondbacks | 80 | 71 | .530 | 13.5 | +3 | W1 |
| 8Pirates | 75 | 75 | .500 | 18 | +26 | W1 |
9 Cardinals | 75 | 76 | .497 | 18.5 | -6 | W2 |
10 Marlins | 74 | 77 | .490 | 19.5 | +5 | L1 |
11 Reds | 70 | 80 | .467 | 23 | -148 | L1 |
12 Nationals | 70 | 81 | .464 | 23.5 | +3 | W3 |
13 Mets | 69 | 81 | .460 | 24 | -35 | L2 |
14 Giants | 62 | 89 | .411 | 31.5 | -78 | L4 |
15 Rockies | 55 | 95 | .367 | 38 | -170 | L8 |
ATL
VS
CHC
Pitchers
Reynaldo Lopez
Catchers
Sean Murphy
Infielders
Matt Olson
Ozzie Albies
Austin Riley
Ha-Seong Kim
Outfielders
Ronald Acuna Jr.
Michael Harris II
Mauricio Dubon
Designated Hitters
Drake Baldwin
Pitchers
David Peterson
Catchers
Carson Kelly
Infielders
Michael Busch
Alex Bregman
Nico Hoerner
Pedro Ramirez
Outfielders
Pete Crow-Armstrong
Seiya Suzuki
Ian Happ
Designated Hitters
Michael Conforto
Braves
VS
Cubs
Batting
151
Team Games Played
151
5096
At Bats
5182
1261
Hits
1303
666
Runs Batted In
762
189
Home Runs
208
78
Stolen Bases
107
.247
Batting Average
.251
696
Runs
806
238
Doubles
258
11
Triples
23
2088
Total Bases
2231
436
Walks
636
1220
Strikeouts
1259
.311
On Base Percentage
.340
.410
Slugging Percentage
.431
.721
OBP Pct + SLG Pct
.770
151
Games Played
151
0
Games Started
0
54
Hit By Pitch
80
0.0
Wins Above Replacement
0.0
0.0
Offensive Wins Above Replacement
0.0
23
Caught Stealing
19
1
Is Qualified
1
660.2
Runs Created
785.1
4.5
Runs Created Per 27 Outs
5.2
.077
Walks Per Plate Appearance
.107
0.36
Walk To Strikeout Ratio
0.51
.162
Isolated Power
.179
.259
Secondary Average
.319
3.88
Pitches Per Plate Appearance
3.96
438
Extra Base Hits
489
5642
Plate Appearances
5951
27.0
At Bats Per Home Run
24.9
9
Sacrifice Hit
9
44
Sacrifice Flies
43
Pitching
151
Team Games Played
151
58
Quality Starts
49
88
Wins
84
63
Losses
67
46
Saves
33
100
Holds
51
1171
Hits
1246
539
Earned runs
626
167
Home Runs
224
504
Walks
467
1262
Strikeouts
1170
8.5
Strikeouts Per 9 Innings
7.8
0.0
Pitches Per Start
0.0
1.25
Walks Plus Hits Per Inning Pitched
1.27
3.62
Earned Run Average
4.18
63
Losses
67
1341.0
Innings pitched
1348.0
.583
Win Percentage
.556
65
Save Opportunities
59
.233
Opponent Batting Average
.245
.308
Opponent's On-base pct.
.314
.380
Opponent's Slugging pct.
.415
.688
Opponent's OPB Pct + SLG Pct
.729
5018
At Bats
5094
194
Doubles
175
20
Triples
11
56
Batters Hit
58
109
Stolen Bases
83
151
Games Played
151
1
Complete Games
0
1
Shutouts
0
29
Wild Pitches
32
0
Runs Batted In
0
5
Balks
4
1341.0
Innings pitched
1348.0
8.5
Strikeouts Per 9 Innings
7.8
19
Caught Stealing
30
151
Games Started
151
0.0
Wins Above Replacement
0.0
1
Is Qualified
1
584
Runs
664
523
Earned Runs
619
1906
Total Bases
2115
Fielding
151
Team Games Played
151
1341
Full Innings
1348
5334
Total Chances
5529
4023
Putouts
4044
1247
Assists
1429
64
Errors
56
238
Double Plays
258
0.988
Fielding Percentage
0.990
35.4
Range Factor
36.5
0.0
Zone Rating
0.0
151
Games Played
151
0
Games Started
0
0.0
Defensive Wins Above Replacement
0.0
1
Qualified
1