

Braves vs Cubs Live Score (15 Sep, 2026)
Game Information
Stage
STD
Season
2026
First Pitch
Tue, Sep 15, 7:40 pm
Venue
Wrigley Field
Location
Chicago, Illinois
Venue Type
Outdoor
Broadcast
MLB.TV
Attendance
38,516
Live Situation
1Balls
2Strikes
0Outs
—Pitcher
—At Bat
Pitch Sequence
1
STRIKE FOUL
Sinker
95 MPH
2
BALL
Changeup
88 MPH
3
STRIKE SWINGING
Changeup
87 MPH
4
STRIKE FOUL
Sinker
95 MPH
5
STRIKE FOUL
Changeup
88 MPH
6
STRIKE FOUL
Slider
82 MPH
7
BALL IN PLAY
Changeup
88 MPH
Injury Report
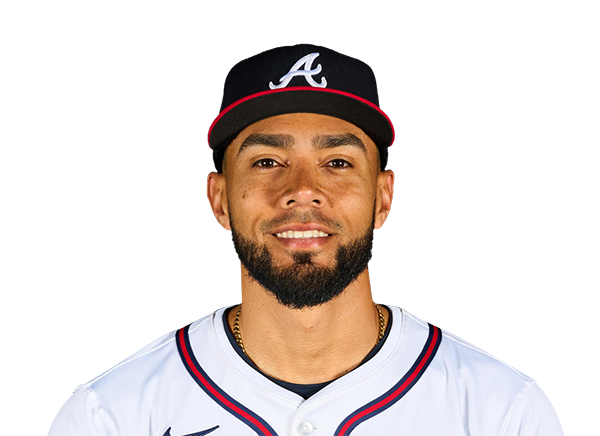
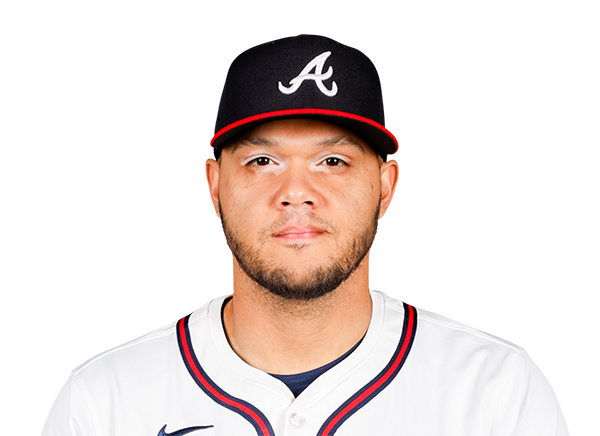

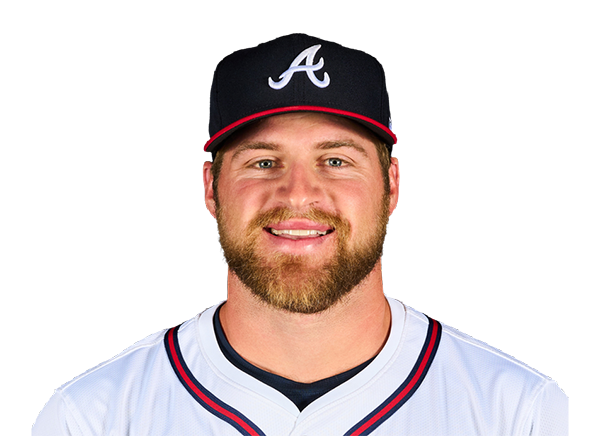


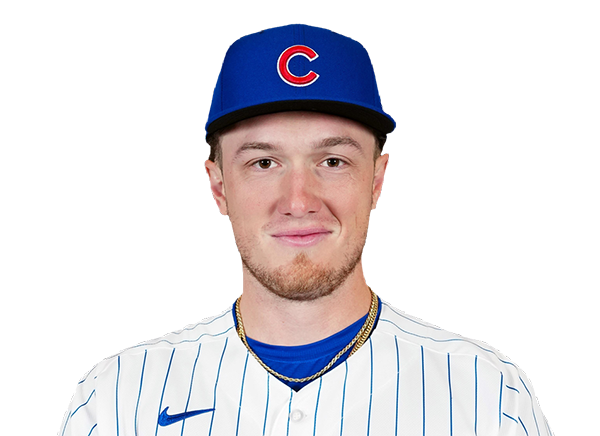
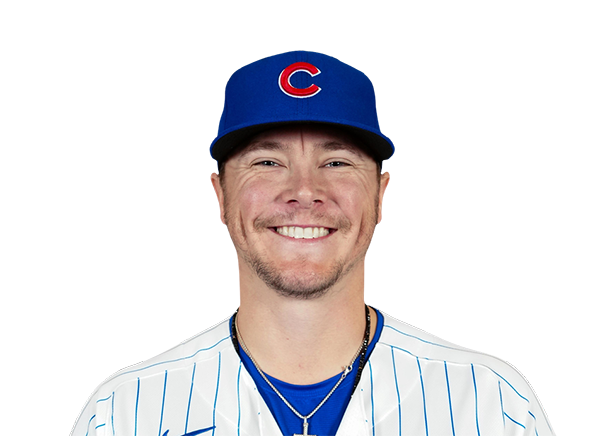
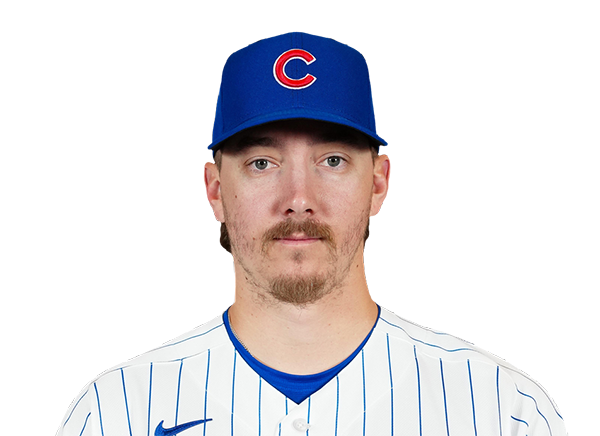
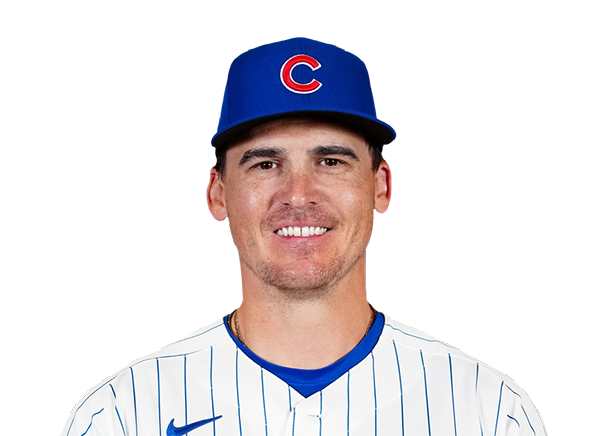
Team Stats
 ATL
CHC


6
Runs
3
9
Hits
5
1
Errors
0
3
Home Runs
0
3
Walks
4
9
Strikeouts
4
Player Box Score
Atlanta Braves
| Player | H-AB | AB | R | H | RBI | HR | BB | K | #P | AVG | OBP | SLG |
|---|---|---|---|---|---|---|---|---|---|---|---|---|
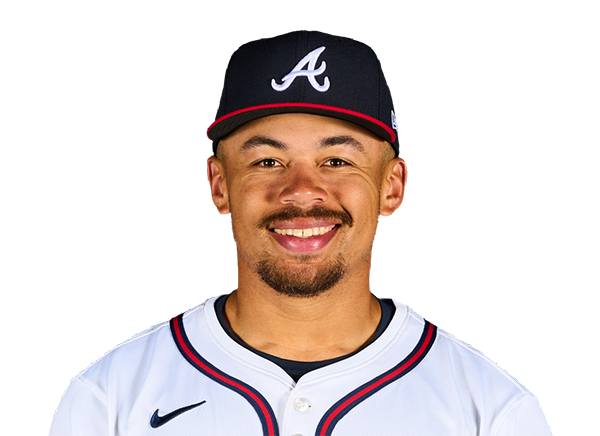 Drake Baldwin | 2-5 | 5 | 2 | 2 | 2 | 1 | 0 | 1 | 19 | .280 | .354 | .456 |
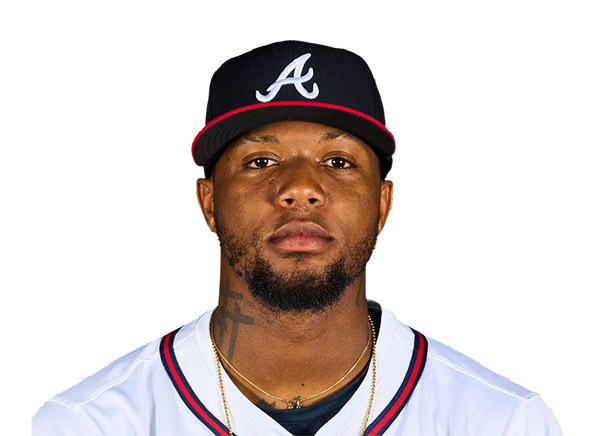 Ronald Acuna Jr. | 1-5 | 5 | 1 | 1 | 2 | 1 | 0 | 1 | 15 | .254 | .346 | .447 |
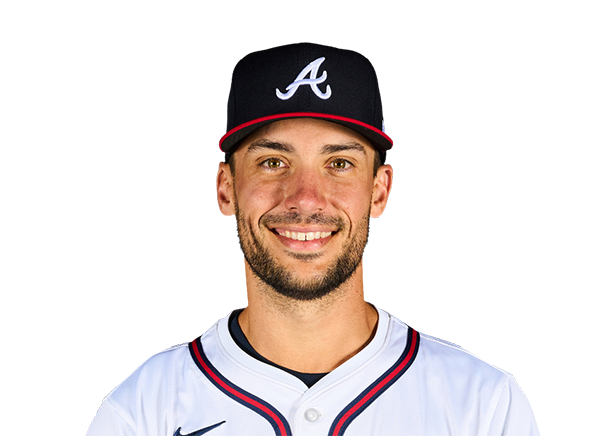 Matt Olson | 2-4 | 4 | 0 | 2 | 0 | 0 | 0 | 1 | 17 | .250 | .324 | .505 |
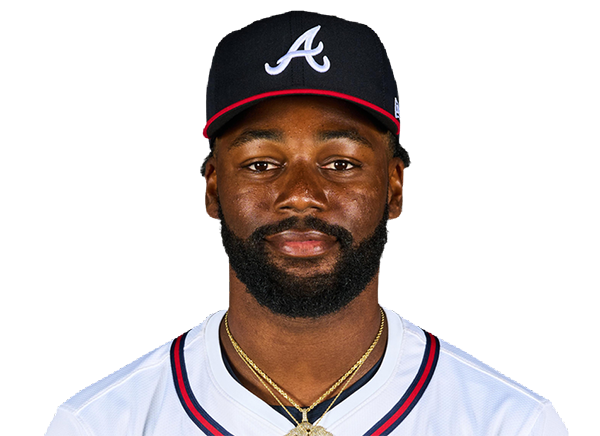 Michael Harris II | 0-4 | 4 | 0 | 0 | 0 | 0 | 0 | 1 | 20 | .290 | .317 | .486 |
 Mauricio Dubon | 1-3 | 3 | 0 | 1 | 0 | 0 | 1 | 0 | 16 | .271 | .317 | .386 |
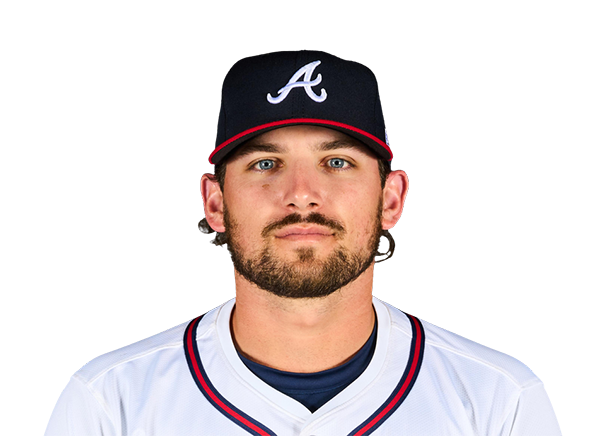 Austin Riley | 0-3 | 3 | 1 | 0 | 0 | 0 | 1 | 3 | 22 | .221 | .295 | .364 |
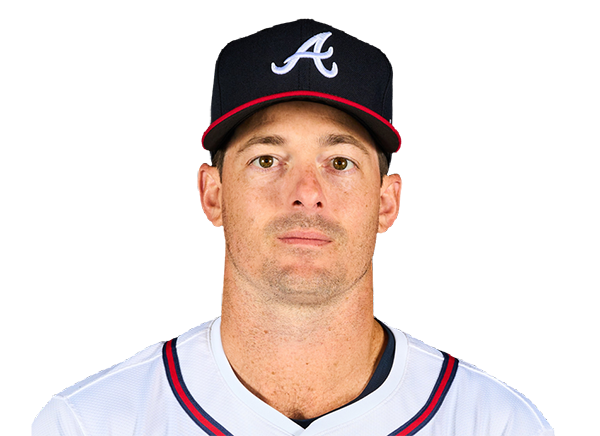 Mike Yastrzemski | 0-4 | 4 | 0 | 0 | 0 | 0 | 0 | 0 | 15 | .228 | .313 | .378 |
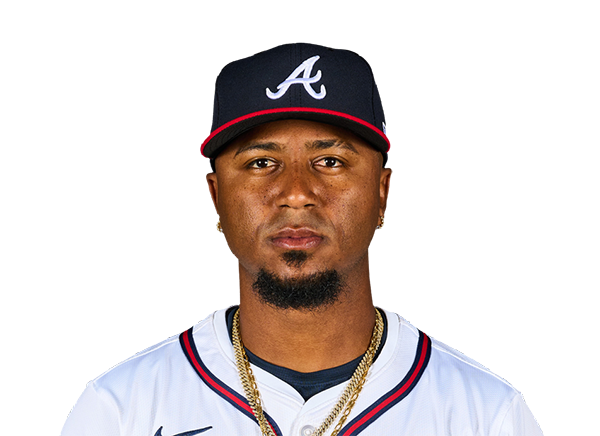 Ozzie Albies | 2-4 | 4 | 2 | 2 | 2 | 1 | 0 | 0 | 15 | .245 | .299 | .409 |
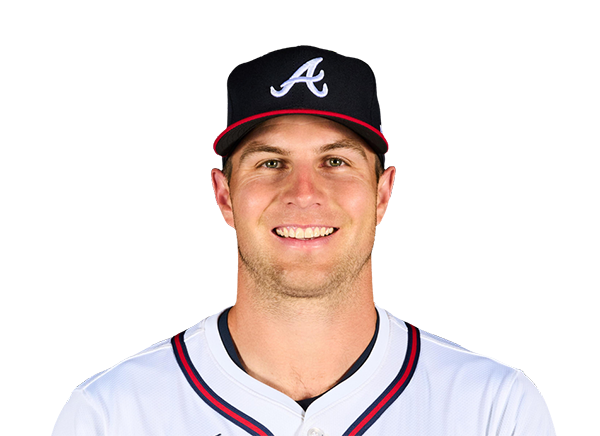 Brewer Hicklen | 1-3 | 3 | 0 | 1 | 0 | 0 | 1 | 2 | 15 | .333 | .471 | .519 |
Chicago Cubs
| Player | H-AB | AB | R | H | RBI | HR | BB | K | #P | AVG | OBP | SLG |
|---|---|---|---|---|---|---|---|---|---|---|---|---|
 Pete Crow-Armstrong | 0-5 | 5 | 0 | 0 | 0 | 0 | 0 | 1 | 21 | .279 | .372 | .566 |
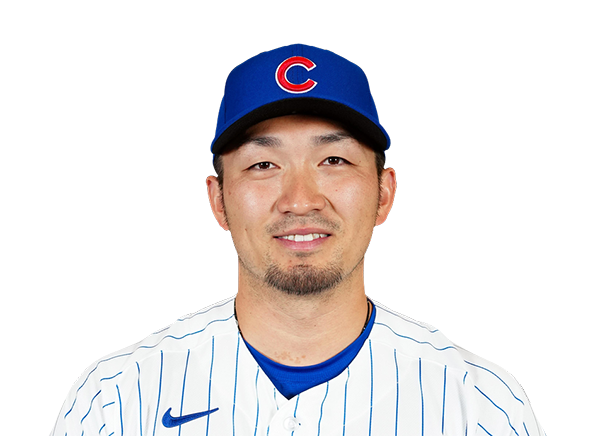 Seiya Suzuki | 1-4 | 4 | 0 | 1 | 0 | 0 | 0 | 2 | 15 | .268 | .367 | .472 |
 Alex Bregman | 0-3 | 3 | 0 | 0 | 0 | 0 | 1 | 1 | 24 | .261 | .352 | .445 |
 Tyrone Taylor | 0-2 | 2 | 0 | 0 | 0 | 0 | 1 | 0 | 9 | .275 | .324 | .502 |
 Ian Happ | 0-1 | 1 | 0 | 0 | 0 | 0 | 0 | 0 | 6 | .218 | .329 | .409 |
 Nico Hoerner | 0-4 | 4 | 0 | 0 | 0 | 0 | 0 | 0 | 11 | .265 | .317 | .356 |
 Michael Busch | 1-3 | 3 | 2 | 1 | 0 | 0 | 1 | 0 | 17 | .239 | .348 | .395 |
 Matt Shaw | 2-2 | 2 | 1 | 2 | 0 | 0 | 1 | 0 | 12 | .245 | .337 | .432 |
 Michael Conforto | 0-1 | 1 | 0 | 0 | 0 | 0 | 0 | 0 | 6 | .237 | .333 | .473 |
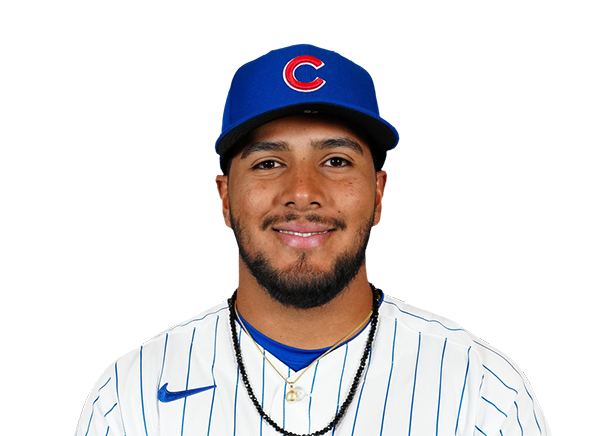 Pedro Ramirez | 1-4 | 4 | 0 | 1 | 1 | 0 | 0 | 0 | 13 | .258 | .319 | .418 |
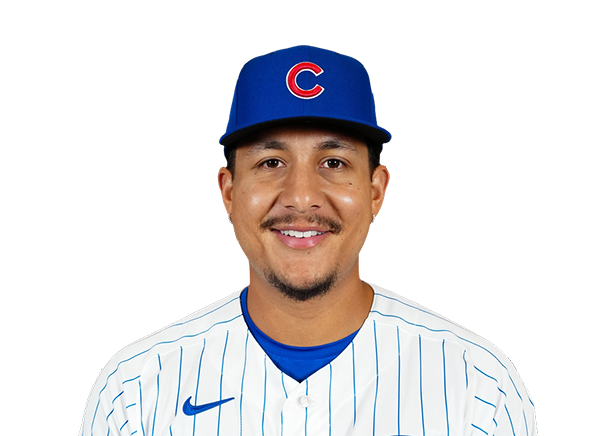 Miguel Amaya | 0-1 | 1 | 0 | 0 | 1 | 0 | 0 | 0 | 4 | .239 | .345 | .378 |
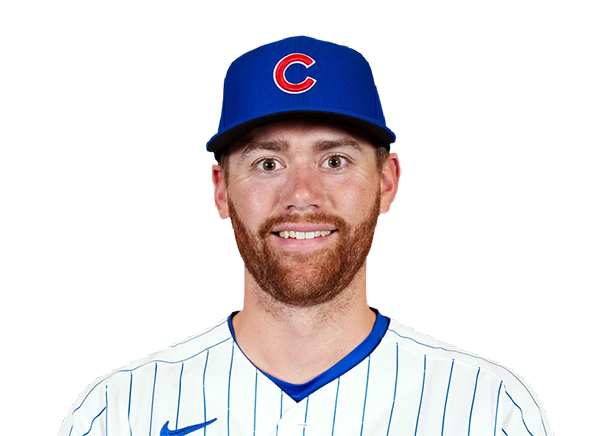 Carson Kelly | 0-1 | 1 | 0 | 0 | 0 | 0 | 0 | 0 | 2 | .260 | .339 | .385 |
Atlanta Braves
| Player | IP | H | R | ER | BB | K | HR | PC-ST | ERA | PC |
|---|---|---|---|---|---|---|---|---|---|---|
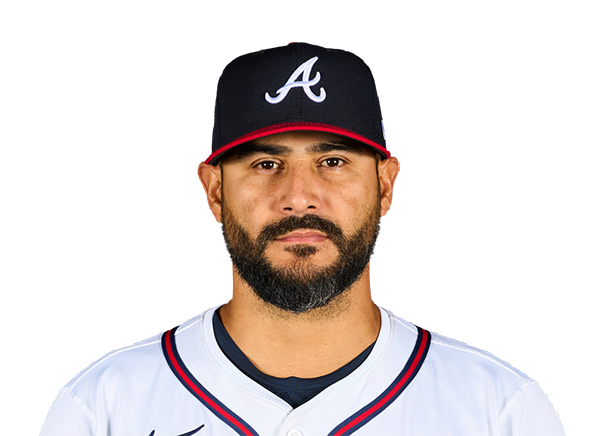 Martin Perez | 6.0 | 5 | 3 | 2 | 4 | 2 | 0 | 90-52 | 3.07 | 90 |
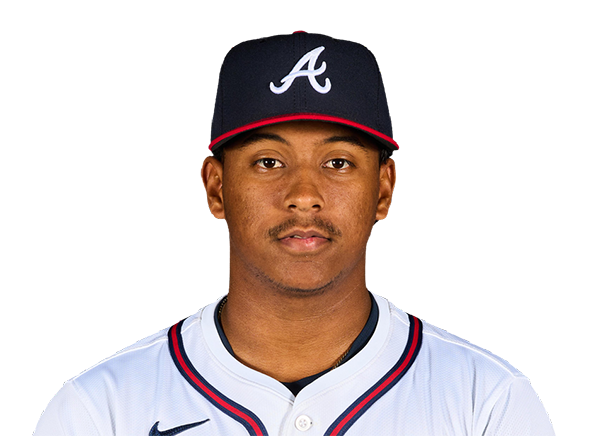 Didier Fuentes | 2.0 | 0 | 0 | 0 | 0 | 2 | 0 | 35-23 | 2.21 | 35 |
 Raisel Iglesias | 1.0 | 0 | 0 | 0 | 0 | 0 | 0 | 15-11 | 2.73 | 15 |
Chicago Cubs
| Player | IP | H | R | ER | BB | K | HR | PC-ST | ERA | PC |
|---|---|---|---|---|---|---|---|---|---|---|
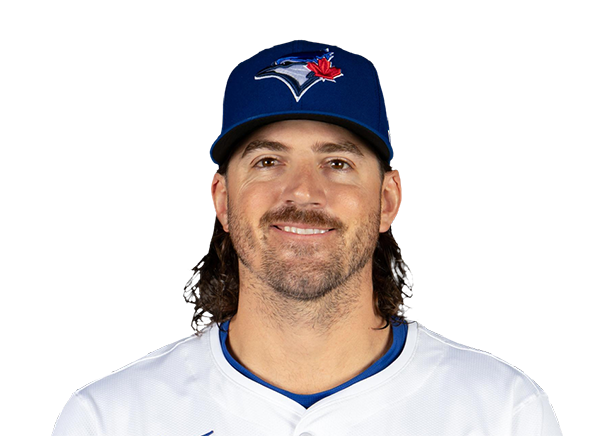 Kevin Gausman | 5.2 | 5 | 2 | 2 | 0 | 6 | 1 | 94-71 | 4.55 | 94 |
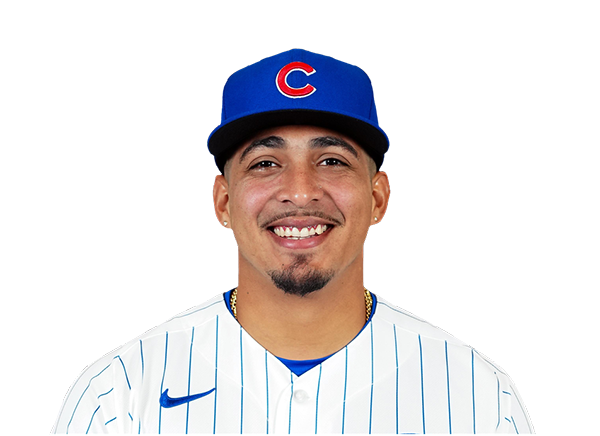 Daniel Palencia | 0.1 | 0 | 0 | 0 | 0 | 0 | 0 | 2-1 | 4.26 | 2 |
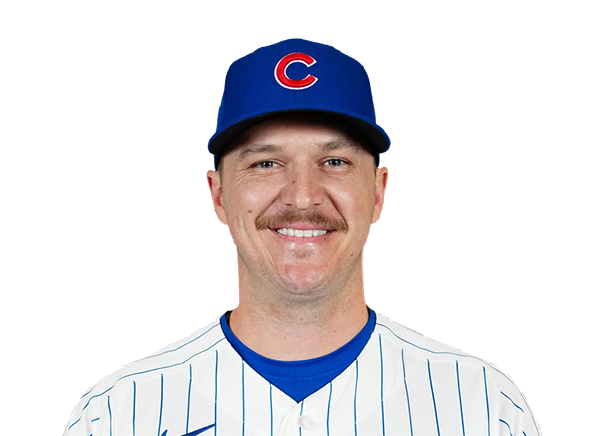 Jacob Webb | 0.2 | 2 | 2 | 2 | 1 | 0 | 1 | 18-9 | 3.53 | 18 |
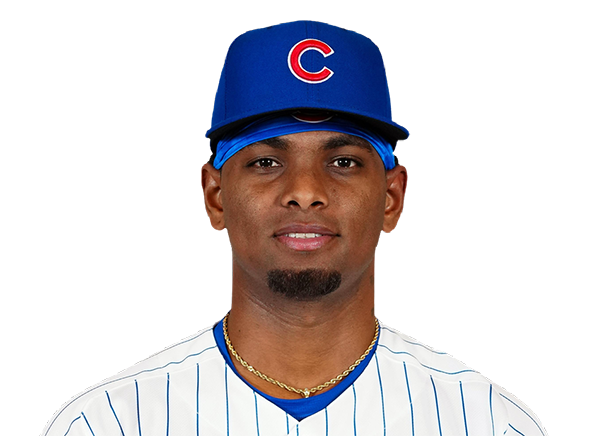 Edward Cabrera | 2.1 | 2 | 2 | 2 | 2 | 3 | 1 | 40-24 | 5.74 | 40 |
H2H / Season Series
CHC3–6
ATL
CHC7–3
ATL
ATL0–2
CHC
ATL4–1
CHC
ATL5–2
CHC
Last 5 Games
| Date | Opponent | Result |
|---|---|---|
| Sep 15 | @ CHC | W6–3 |
| Sep 14 | @ CHC | L3–7 |
| Sep 13 |  vs PHI | L4–9 |
| Sep 12 | vs PHI | W12–2 |
| Sep 11 | vs PHI | W6–5 |
| Date | Opponent | Result |
|---|---|---|
| Sep 15 | vs ATL | L3–6 |
| Sep 14 | vs ATL | W7–3 |
| Sep 13 |  vs PIT | L3–4 |
| Sep 12 | vs PIT | W4–3 |
| Sep 11 | vs PIT | W12–2 |
Standings
American League
| Team | W | L | PCT | GB | DIFF | STRK |
|---|---|---|---|---|---|---|
1 Rays | 91 | 59 | .607 | - | +70 | W4 |
2 White Sox | 77 | 74 | .510 | 14.5 | +37 | L1 |
3 Astros | 76 | 75 | .503 | 15.5 | -51 | W1 |
4 Yankees | 88 | 63 | .583 | 3.5 | +137 | W3 |
5 Red Sox | 82 | 69 | .543 | 9.5 | +86 | L1 |
6 Guardians | 77 | 75 | .507 | 15 | -10 | W1 |
7 Rangers | 75 | 76 | .497 | 16.5 | -42 | W3 |
8 Blue Jays | 75 | 77 | .493 | 17 | -41 | L2 |
9 Orioles | 74 | 78 | .487 | 18 | -32 | W2 |
10 Tigers | 72 | 79 | .477 | 19.5 | +80 | W6 |
11 Twins | 70 | 81 | .464 | 21.5 | -74 | L3 |
12 Mariners | 70 | 82 | .461 | 22 | -61 | L3 |
13 Royals | 66 | 85 | .437 | 25.5 | -96 | L3 |
14 Athletics | 61 | 90 | .404 | 30.5 | -204 | L1 |
15 Angels | 58 | 93 | .384 | 33.5 | -73 | W2 |
National League
| Team | W | L | PCT | GB | DIFF | STRK |
|---|---|---|---|---|---|---|
1 Brewers | 94 | 57 | .623 | - | +199 | W1 |
2 Dodgers | 92 | 59 | .609 | 2 | +177 | W2 |
| 3Braves | 89 | 63 | .586 | 5.5 | +115 | W1 |
| 4Cubs | 84 | 68 | .553 | 10.5 | +139 | L1 |
| 5Phillies | 83 | 68 | .550 | 11 | +28 | L1 |
6 Padres | 82 | 69 | .543 | 12 | +17 | L1 |
7 Diamondbacks | 80 | 72 | .526 | 14.5 | +1 | L1 |
| 8Pirates | 75 | 76 | .497 | 19 | +22 | L1 |
9 Marlins | 75 | 77 | .493 | 19.5 | +7 | W1 |
10 Cardinals | 75 | 77 | .493 | 19.5 | -13 | L1 |
11 Nationals | 71 | 81 | .467 | 23.5 | +6 | W4 |
12 Reds | 70 | 81 | .464 | 24 | -152 | L2 |
13 Mets | 69 | 82 | .457 | 25 | -37 | L3 |
14 Giants | 63 | 89 | .414 | 31.5 | -71 | W1 |
15 Rockies | 56 | 95 | .371 | 38 | -164 | W1 |
ATL
VS
CHC
Pitchers
Martin Perez
Catchers
Drake Baldwin
Infielders
Matt Olson
Mauricio Dubon
Austin Riley
Ozzie Albies
Outfielders
Michael Harris II
Mike Yastrzemski
Brewer Hicklen
Designated Hitters
Ronald Acuna Jr.
Pitchers
Kevin Gausman
Catchers
Miguel Amaya
Infielders
Alex Bregman
Nico Hoerner
Michael Busch
Pedro Ramirez
Outfielders
Pete Crow-Armstrong
Seiya Suzuki
Tyrone Taylor
Designated Hitters
Matt Shaw
Braves
VS
Cubs
Batting
152
Team Games Played
152
5131
At Bats
5213
1270
Hits
1308
672
Runs Batted In
764
192
Home Runs
208
80
Stolen Bases
107
.248
Batting Average
.251
702
Runs
809
239
Doubles
258
11
Triples
23
2107
Total Bases
2236
439
Walks
640
1229
Strikeouts
1263
.311
On Base Percentage
.339
.411
Slugging Percentage
.429
.722
OBP Pct + SLG Pct
.768
152
Games Played
152
152
Games Started
152
54
Hit By Pitch
80
0.0
Wins Above Replacement
0.0
0.0
Offensive Wins Above Replacement
0.0
23
Caught Stealing
19
1
Is Qualified
1
666.6
Runs Created
786.4
4.5
Runs Created Per 27 Outs
5.2
.077
Walks Per Plate Appearance
.107
0.36
Walk To Strikeout Ratio
0.51
.163
Isolated Power
.178
.260
Secondary Average
.318
3.88
Pitches Per Plate Appearance
3.96
442
Extra Base Hits
489
5680
Plate Appearances
5988
26.7
At Bats Per Home Run
25.1
9
Sacrifice Hit
10
44
Sacrifice Flies
44
Pitching
152
Team Games Played
152
59
Quality Starts
49
89
Wins
84
63
Losses
68
47
Saves
33
101
Holds
52
1176
Hits
1255
541
Earned runs
632
167
Home Runs
227
508
Walks
470
1266
Strikeouts
1179
8.4
Strikeouts Per 9 Innings
7.8
143.9
Pitches Per Start
145.3
1.25
Walks Plus Hits Per Inning Pitched
1.27
3.61
Earned Run Average
4.19
63
Losses
68
1350.0
Innings pitched
1357.0
.586
Win Percentage
.553
66
Save Opportunities
60
.233
Opponent Batting Average
.245
.308
Opponent's On-base pct.
.314
.378
Opponent's Slugging pct.
.416
.686
Opponent's OPB Pct + SLG Pct
.730
5049
At Bats
5129
194
Doubles
176
20
Triples
11
56
Batters Hit
58
109
Stolen Bases
85
152
Games Played
152
1
Complete Games
0
10
Shutouts
6
29
Wild Pitches
33
565
Runs Batted In
649
4
Balks
3
1350.0
Innings pitched
1357.0
8.4
Strikeouts Per 9 Innings
7.8
19
Caught Stealing
30
152
Games Started
152
0.0
Wins Above Replacement
0.0
1
Is Qualified
1
587
Runs
670
541
Earned Runs
632
1911
Total Bases
2134
Fielding
152
Team Games Played
152
1350
Full Innings
1357
5372
Total Chances
5566
4050
Putouts
4071
1257
Assists
1439
65
Errors
56
239
Double Plays
258
0.988
Fielding Percentage
0.990
35.4
Range Factor
36.5
0.0
Zone Rating
0.0
152
Games Played
152
0
Games Started
0
0.0
Defensive Wins Above Replacement
0.0
1
Qualified
1