

Braves vs Cubs Live Score (16 Sep, 2026)
Game Information
Stage
STD
Season
2026
First Pitch
Wed, Sep 16, 7:40 pm
Venue
Wrigley Field
Location
Chicago, Illinois
Venue Type
Outdoor
Broadcast
MLB.TV
Attendance
35,779
Live Situation
2Balls
2Strikes
0Outs
—Pitcher
—At Bat
Pitch Sequence
1
BALL
Curve
85 MPH
2
STRIKE LOOKING
Sinker
95 MPH
3
STRIKE SWINGING
Slider
89 MPH
4
BALL
Slider
91 MPH
5
BALL IN PLAY
Sweeper
87 MPH
Injury Report
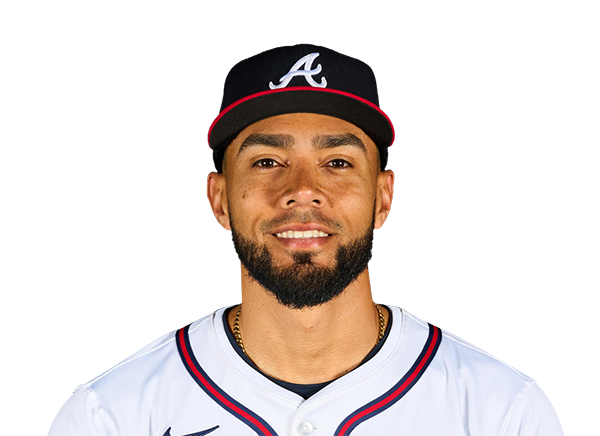
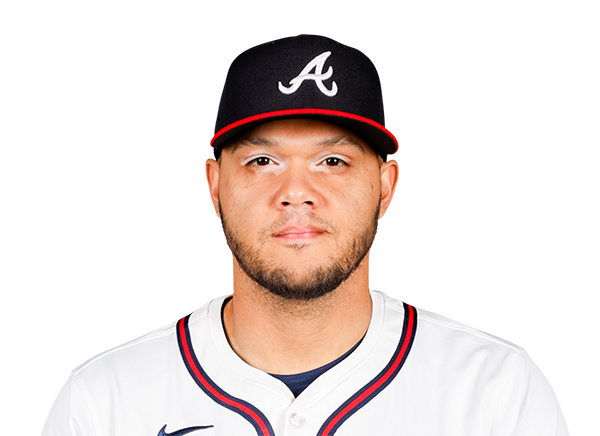

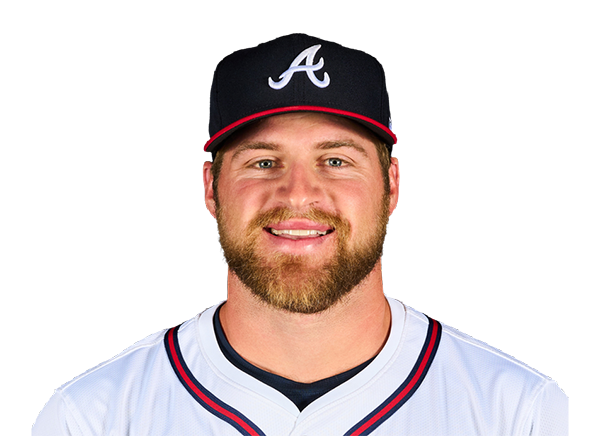

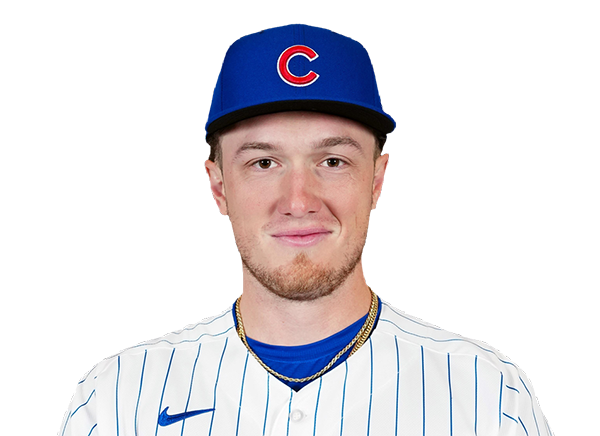
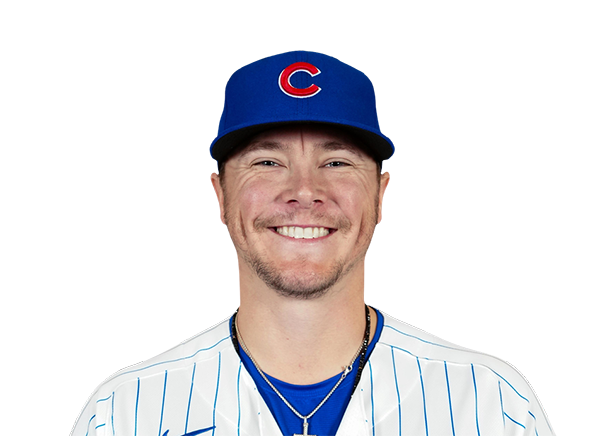
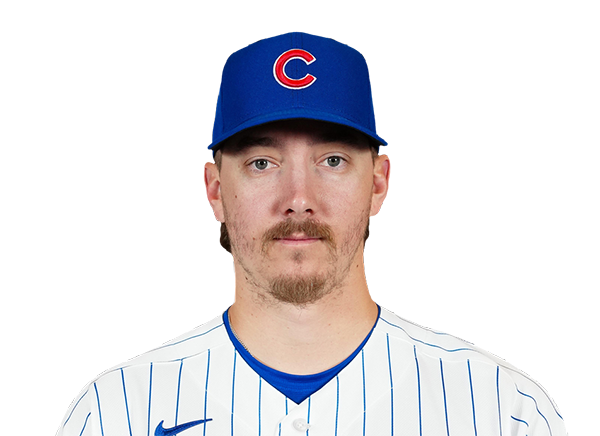
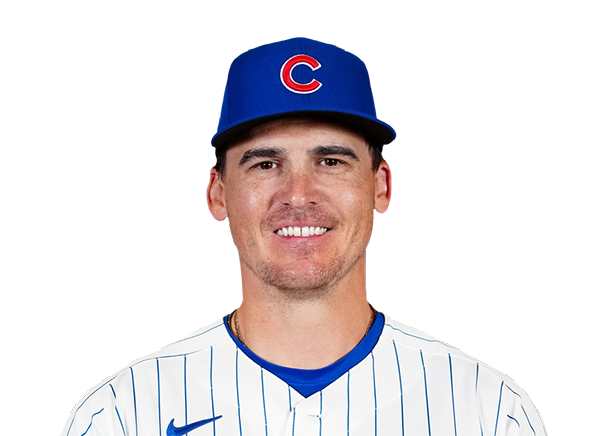

Team Stats
 ATL
CHC

4
Runs
8
8
Hits
12
0
Errors
0
0
Home Runs
3
1
Walks
3
9
Strikeouts
8
Player Box Score
Atlanta Braves
| Player | H-AB | AB | R | H | RBI | HR | BB | K | #P | AVG | OBP | SLG |
|---|---|---|---|---|---|---|---|---|---|---|---|---|
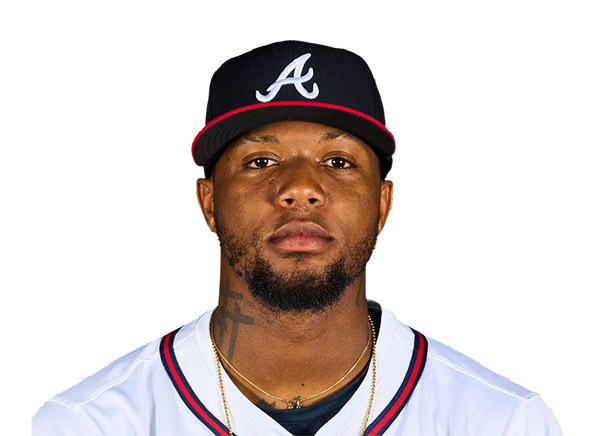 Ronald Acuna Jr. |
2-4 | 4 | 1 | 2 | 0 | 0 | 0 | 2 | 19 | .257 | .348 | .450 |
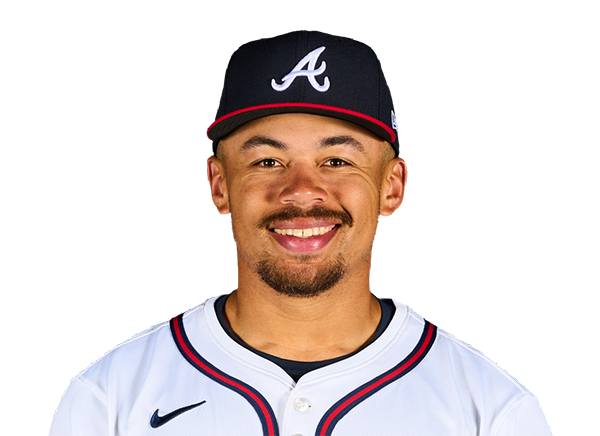 Drake Baldwin |
0-4 | 4 | 0 | 0 | 0 | 0 | 0 | 0 | 15 | .278 | .352 | .452 |
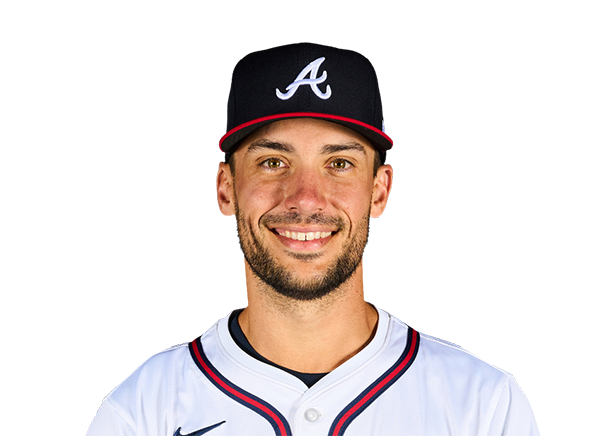 Matt Olson |
1-4 | 4 | 0 | 1 | 1 | 0 | 0 | 1 | 15 | .250 | .323 | .503 |
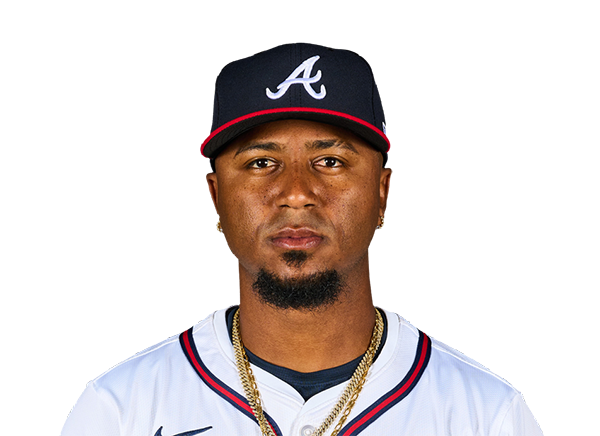 Ozzie Albies |
1-3 | 3 | 1 | 1 | 0 | 0 | 1 | 1 | 27 | .245 | .300 | .408 |
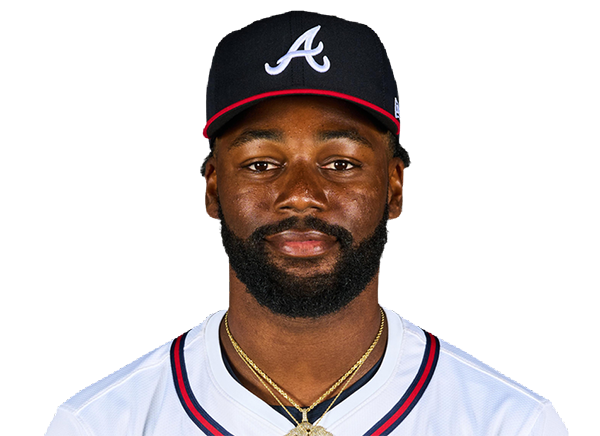 Michael Harris II |
1-4 | 4 | 1 | 1 | 0 | 0 | 0 | 1 | 15 | .290 | .316 | .485 |
 Mauricio Dubon |
2-4 | 4 | 1 | 2 | 1 | 0 | 0 | 0 | 22 | .272 | .318 | .393 |
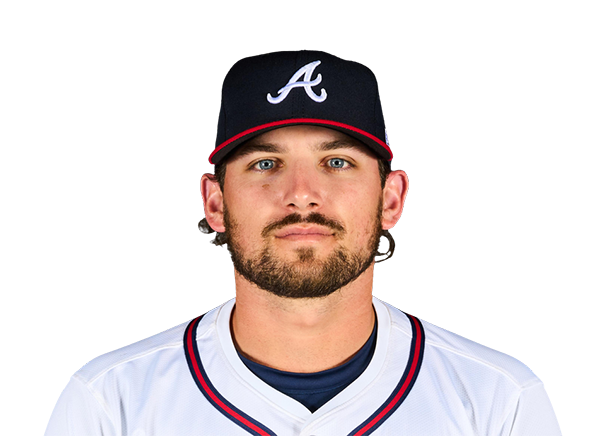 Austin Riley |
1-4 | 4 | 0 | 1 | 1 | 0 | 0 | 2 | 21 | .222 | .294 | .363 |
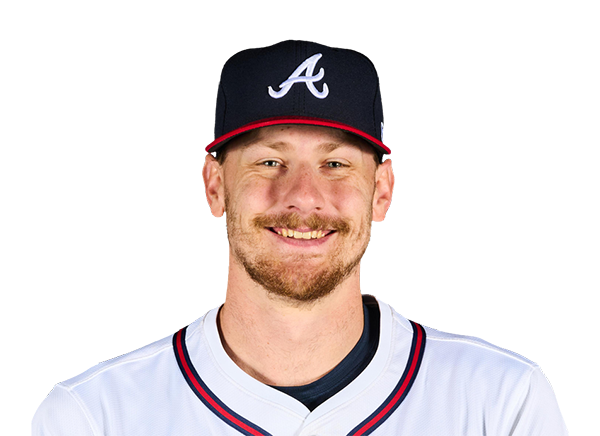 Sean Murphy |
0-4 | 4 | 0 | 0 | 1 | 0 | 0 | 1 | 12 | .191 | .250 | .337 |
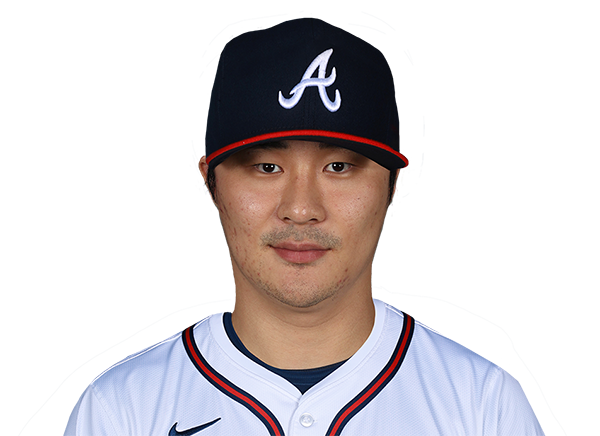 Ha-Seong Kim |
0-3 | 3 | 0 | 0 | 0 | 0 | 0 | 1 | 14 | .123 | .219 | .132 |
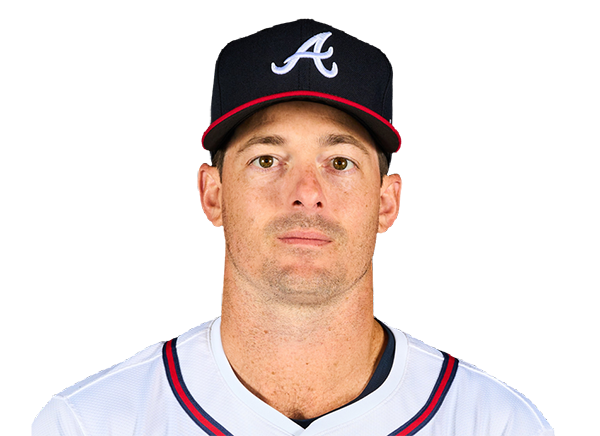 Mike Yastrzemski |
0-1 | 1 | 0 | 0 | 0 | 0 | 0 | 0 | 5 | .228 | .312 | .377 |
Chicago Cubs
| Player | H-AB | AB | R | H | RBI | HR | BB | K | #P | AVG | OBP | SLG |
|---|---|---|---|---|---|---|---|---|---|---|---|---|
 Pete Crow-Armstrong |
3-4 | 4 | 3 | 3 | 3 | 2 | 1 | 1 | 19 | .282 | .375 | .581 |
 Seiya Suzuki |
0-4 | 4 | 1 | 0 | 0 | 0 | 0 | 1 | 13 | .266 | .365 | .469 |
 Michael Busch |
0-3 | 3 | 1 | 0 | 0 | 0 | 1 | 2 | 16 | .238 | .347 | .393 |
 Alex Bregman |
3-4 | 4 | 1 | 3 | 4 | 1 | 0 | 0 | 16 | .264 | .354 | .458 |
 Ian Happ |
1-2 | 2 | 0 | 1 | 0 | 0 | 0 | 0 | 9 | .219 | .329 | .412 |
 Tyrone Taylor |
1-2 | 2 | 1 | 1 | 0 | 0 | 0 | 0 | 5 | .278 | .326 | .507 |
 Nico Hoerner |
0-4 | 4 | 0 | 0 | 0 | 0 | 0 | 0 | 12 | .263 | .315 | .354 |
 Michael Conforto |
1-3 | 3 | 0 | 1 | 1 | 0 | 1 | 2 | 23 | .238 | .336 | .471 |
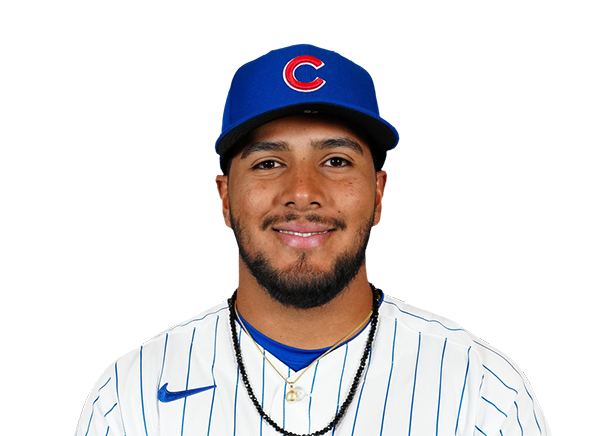 Pedro Ramirez |
1-4 | 4 | 0 | 1 | 0 | 0 | 0 | 2 | 11 | .258 | .318 | .415 |
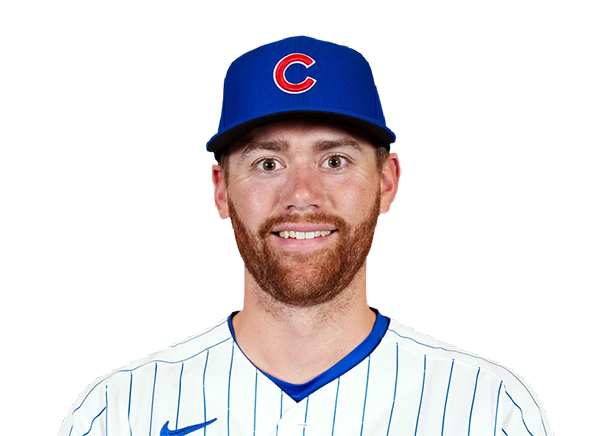 Carson Kelly |
2-4 | 4 | 1 | 2 | 0 | 0 | 0 | 0 | 16 | .262 | .341 | .387 |
Atlanta Braves
| Player | IP | H | R | ER | BB | K | HR | PC-ST | ERA | PC |
|---|---|---|---|---|---|---|---|---|---|---|
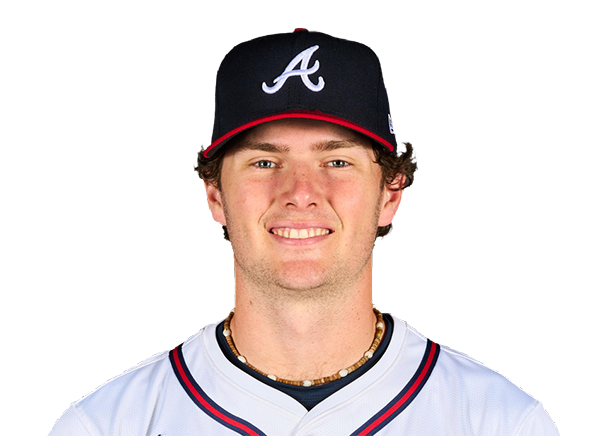 JR Ritchie |
4.2 | 7 | 6 | 6 | 2 | 5 | 2 | 82-52 | 5.03 | 82 |
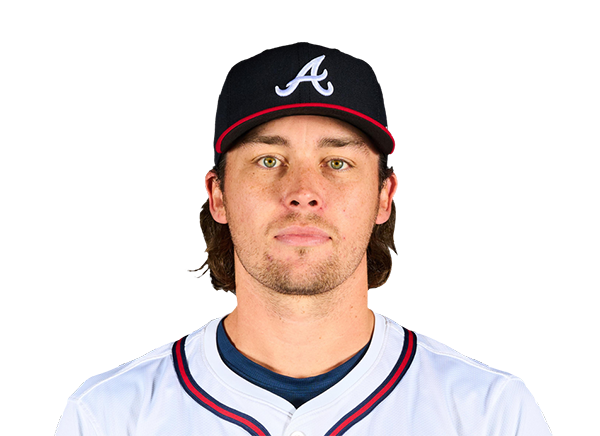 Dylan Dodd |
0.1 | 0 | 0 | 0 | 0 | 0 | 0 | 4-3 | 2.36 | 4 |
 Owen Murphy |
2.1 | 5 | 2 | 2 | 1 | 2 | 1 | 46-32 | 5.00 | 46 |
 Brent Suter |
0.2 | 0 | 0 | 0 | 0 | 1 | 0 | 8-5 | 3.52 | 8 |
Chicago Cubs
| Player | IP | H | R | ER | BB | K | HR | PC-ST | ERA | PC |
|---|---|---|---|---|---|---|---|---|---|---|
 Shota Imanaga |
6.0 | 4 | 1 | 1 | 0 | 8 | 0 | 100-70 | 3.80 | 100 |
 Aaron Civale |
1.1 | 2 | 1 | 1 | 0 | 0 | 0 | 21-14 | 4.23 | 21 |
 Ryan Rolison |
0.2 | 1 | 2 | 2 | 1 | 0 | 0 | 24-16 | 2.98 | 24 |
 Ryan Zeferjahn |
1.0 | 1 | 0 | 0 | 0 | 1 | 0 | 20-14 | 4.03 | 20 |
H2H / Season Series
CHC8–4
ATL
CHC3–6
ATL
CHC7–3
ATL
ATL0–2
CHC
ATL4–1
CHC
ATL5–2
CHC
Last 5 Games
| Date | Opponent | Result |
|---|---|---|
| Sep 16 | @ CHC | L4–8 |
| Sep 15 | @ CHC | W6–3 |
| Sep 14 | @ CHC | L3–7 |
| Sep 13 |  vs PHI | L4–9 |
| Sep 12 | vs PHI | W12–2 |
| Date | Opponent | Result |
|---|---|---|
| Sep 16 | vs ATL | W8–4 |
| Sep 15 | vs ATL | L3–6 |
| Sep 14 | vs ATL | W7–3 |
| Sep 13 |  vs PIT | L3–4 |
| Sep 12 | vs PIT | W4–3 |
Standings
American League
| Team | W | L | PCT | GB | DIFF | STRK |
|---|---|---|---|---|---|---|
1 Rays | 92 | 59 | .609 | - | +71 | W5 |
2 Guardians | 78 | 75 | .510 | 15 | -7 | W2 |
3 Astros | 76 | 76 | .500 | 16.5 | -54 | L1 |
4 Yankees | 88 | 64 | .579 | 4.5 | +136 | L1 |
5 Red Sox | 82 | 70 | .539 | 10.5 | +82 | L2 |
6 White Sox | 77 | 75 | .507 | 15.5 | +34 | L2 |
7 Rangers | 76 | 76 | .500 | 16.5 | -38 | W4 |
8 Blue Jays | 76 | 77 | .497 | 17 | -37 | W1 |
9 Orioles | 75 | 78 | .490 | 18 | -26 | W3 |
10 Tigers | 72 | 80 | .474 | 20.5 | +76 | L1 |
11 Twins | 71 | 81 | .467 | 21.5 | -73 | W1 |
12 Mariners | 71 | 82 | .464 | 22 | -56 | W1 |
13 Royals | 67 | 85 | .441 | 25.5 | -93 | W1 |
14 Athletics | 61 | 91 | .401 | 31.5 | -205 | L2 |
15 Angels | 58 | 94 | .382 | 34.5 | -78 | L1 |
National League
| Team | W | L | PCT | GB | DIFF | STRK |
|---|---|---|---|---|---|---|
1 Brewers | 95 | 57 | .625 | - | +200 | W2 |
2 Dodgers | 92 | 60 | .605 | 3 | +173 | L1 |
| 3Braves | 89 | 64 | .582 | 6.5 | +111 | L1 |
| 4Cubs | 85 | 68 | .556 | 10.5 | +143 | W1 |
| 5Phillies | 84 | 68 | .553 | 11 | +31 | W1 |
6 Padres | 83 | 69 | .546 | 12 | +23 | W1 |
7 Diamondbacks | 80 | 73 | .523 | 15.5 | 0 | L2 |
8 Marlins | 76 | 77 | .497 | 19.5 | +8 | W2 |
| 9Pirates | 75 | 77 | .493 | 20 | +21 | L2 |
10 Cardinals | 75 | 78 | .490 | 20.5 | -14 | L2 |
11 Reds | 71 | 81 | .467 | 24 | -148 | W1 |
12 Nationals | 71 | 82 | .464 | 24.5 | +3 | L1 |
13 Mets | 69 | 83 | .454 | 26 | -43 | L4 |
14 Giants | 64 | 89 | .418 | 31.5 | -70 | W2 |
15 Rockies | 56 | 96 | .368 | 39 | -170 | L1 |
ATL
VS
CHC
Pitchers
JR Ritchie
Catchers
Sean Murphy
Infielders
Matt Olson
Ozzie Albies
Austin Riley
Ha-Seong Kim
Outfielders
Ronald Acuna Jr.
Michael Harris II
Mauricio Dubon
Designated Hitters
Drake Baldwin
Pitchers
Shota Imanaga
Catchers
Carson Kelly
Infielders
Michael Busch
Alex Bregman
Nico Hoerner
Pedro Ramirez
Outfielders
Pete Crow-Armstrong
Seiya Suzuki
Ian Happ
Designated Hitters
Michael Conforto
Braves
VS
Cubs
Batting
153
Team Games Played
153
5166
At Bats
5247
1278
Hits
1320
676
Runs Batted In
772
192
Home Runs
211
80
Stolen Bases
107
.247
Batting Average
.252
706
Runs
817
241
Doubles
261
12
Triples
25
2119
Total Bases
2264
440
Walks
643
1238
Strikeouts
1271
.311
On Base Percentage
.340
.410
Slugging Percentage
.431
.721
OBP Pct + SLG Pct
.771
153
Games Played
153
153
Games Started
153
54
Hit By Pitch
81
0.0
Wins Above Replacement
0.0
0.0
Offensive Wins Above Replacement
0.0
23
Caught Stealing
19
1
Is Qualified
1
669.5
Runs Created
796.5
4.5
Runs Created Per 27 Outs
5.2
.077
Walks Per Plate Appearance
.107
0.36
Walk To Strikeout Ratio
0.51
.163
Isolated Power
.180
.259
Secondary Average
.319
3.89
Pitches Per Plate Appearance
3.96
445
Extra Base Hits
497
5716
Plate Appearances
6026
26.9
At Bats Per Home Run
24.9
9
Sacrifice Hit
10
44
Sacrifice Flies
44
Pitching
153
Team Games Played
153
59
Quality Starts
50
89
Wins
85
64
Losses
68
47
Saves
33
101
Holds
52
1188
Hits
1263
549
Earned runs
636
170
Home Runs
227
511
Walks
471
1274
Strikeouts
1188
8.4
Strikeouts Per 9 Innings
7.8
143.8
Pitches Per Start
145.5
1.25
Walks Plus Hits Per Inning Pitched
1.27
3.64
Earned Run Average
4.19
64
Losses
68
1358.0
Innings pitched
1366.0
.582
Win Percentage
.556
66
Save Opportunities
60
.234
Opponent Batting Average
.245
.309
Opponent's On-base pct.
.313
.381
Opponent's Slugging pct.
.416
.690
Opponent's OPB Pct + SLG Pct
.729
5083
At Bats
5164
197
Doubles
178
22
Triples
12
57
Batters Hit
58
109
Stolen Bases
85
153
Games Played
153
1
Complete Games
0
10
Shutouts
6
29
Wild Pitches
33
573
Runs Batted In
653
4
Balks
3
1358.0
Innings pitched
1366.0
8.4
Strikeouts Per 9 Innings
7.8
19
Caught Stealing
30
153
Games Started
153
0.0
Wins Above Replacement
0.0
1
Is Qualified
1
595
Runs
674
549
Earned Runs
636
1939
Total Bases
2146
Fielding
153
Team Games Played
153
1358
Full Innings
1366
5407
Total Chances
5602
4074
Putouts
4098
1268
Assists
1448
65
Errors
56
241
Double Plays
261
0.988
Fielding Percentage
0.990
35.4
Range Factor
36.5
0.0
Zone Rating
0.0
153
Games Played
153
0
Games Started
0
0.0
Defensive Wins Above Replacement
0.0
1
Qualified
1