

Braves vs Dodgers Live Score (10 May, 2026)
Game Information
Stage
Standard
Season
2026
First Pitch
Sat, May 9, 9:10 pm
Venue
Dodger Stadium
Location
Los Angeles, California
Attendance
50,209
Live Situation
2Balls
2Strikes
0Outs
—Pitcher
—At Bat
Pitch Sequence
1
BALL
Four-seam FB
92 MPH
2
STRIKE LOOKING
Slider
85 MPH
3
BALL
Slider
84 MPH
4
STRIKE FOUL
Four-seam FB
93 MPH
5
STRIKE FOUL
Slider
83 MPH
6
BALL IN PLAY
Slider
83 MPH
Injury Report
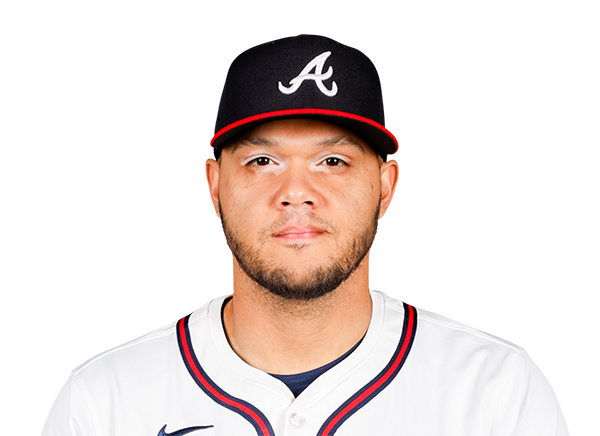
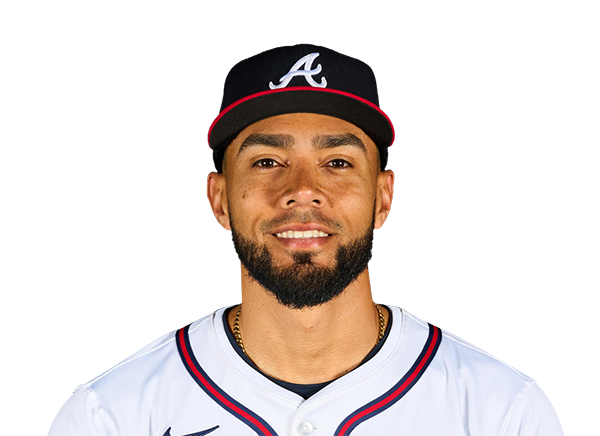
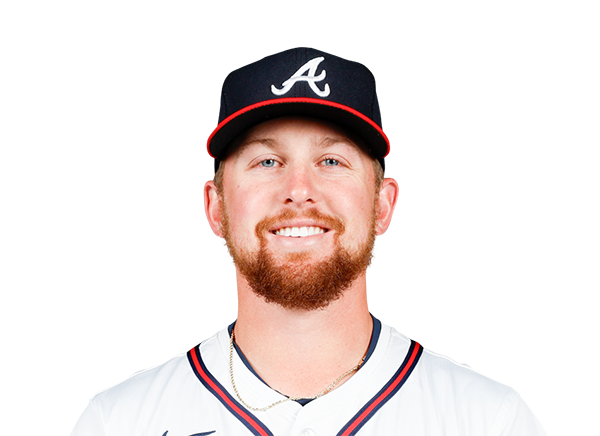
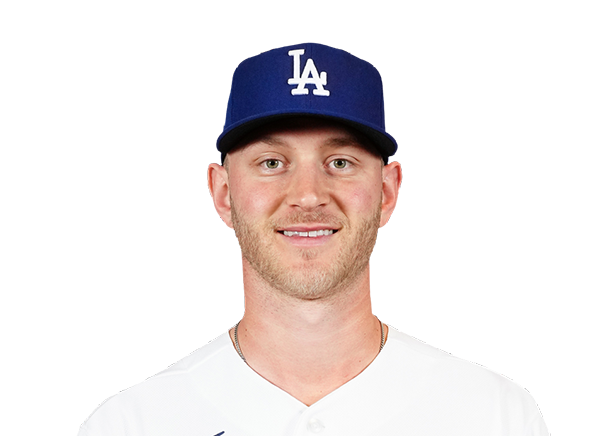
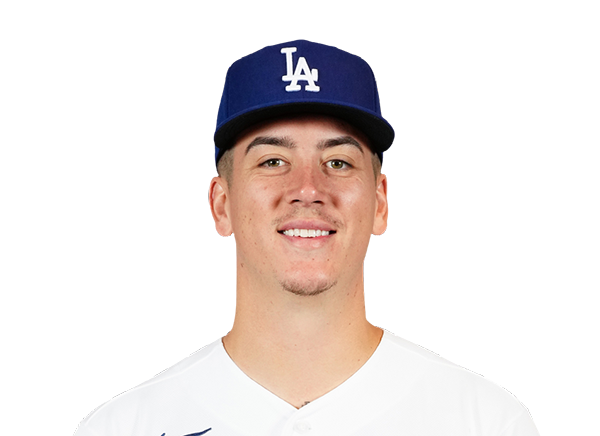
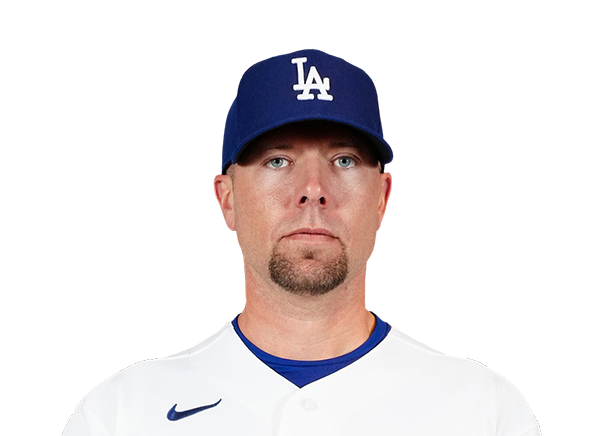
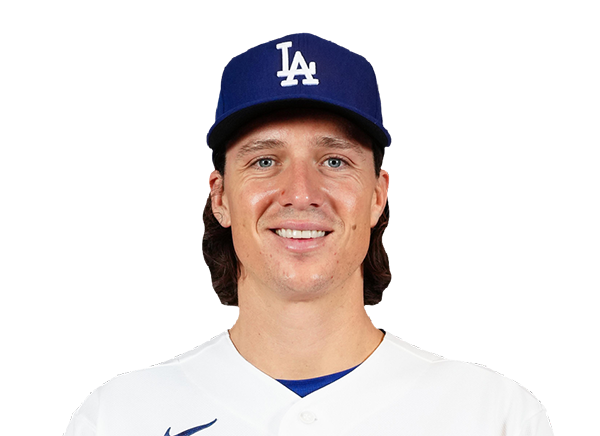
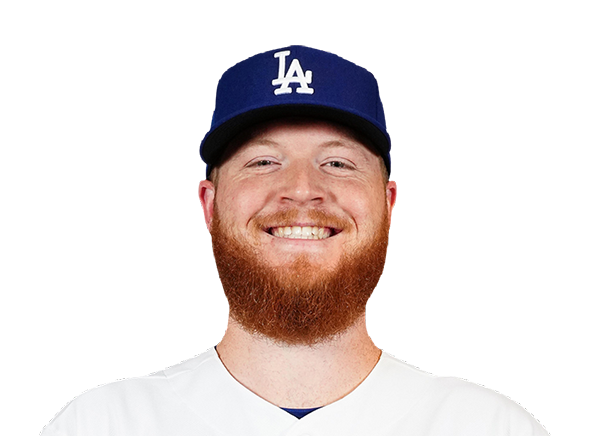
Team Stats
 ATL
LAD


7
Runs
2
12
Hits
6
0
Errors
1
0
Home Runs
1
4
Walks
3
11
Strikeouts
9
Player Box Score
Atlanta Braves
| Player | H-AB | AB | R | H | RBI | HR | BB | K | #P | AVG | OBP | SLG |
|---|---|---|---|---|---|---|---|---|---|---|---|---|
 Mauricio Dubon | 2-4 | 4 | 1 | 2 | 0 | 0 | 1 | 0 | 19 | .273 | .336 | .410 |
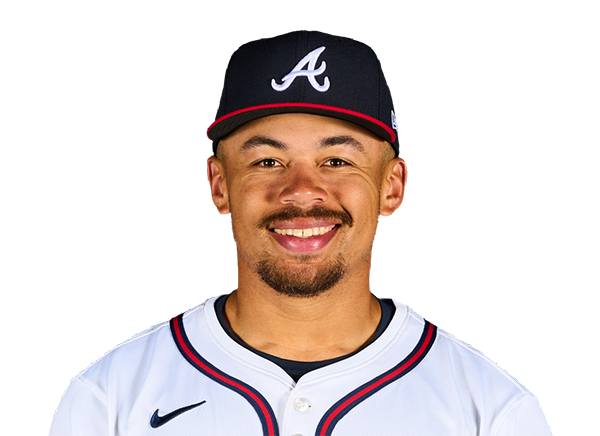 Drake Baldwin | 1-3 | 3 | 1 | 1 | 1 | 0 | 2 | 1 | 24 | .298 | .386 | .497 |
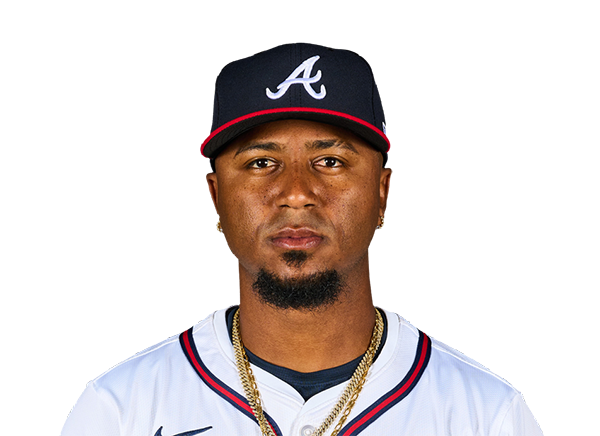 Ozzie Albies | 2-5 | 5 | 1 | 2 | 2 | 0 | 0 | 0 | 15 | .314 | .364 | .519 |
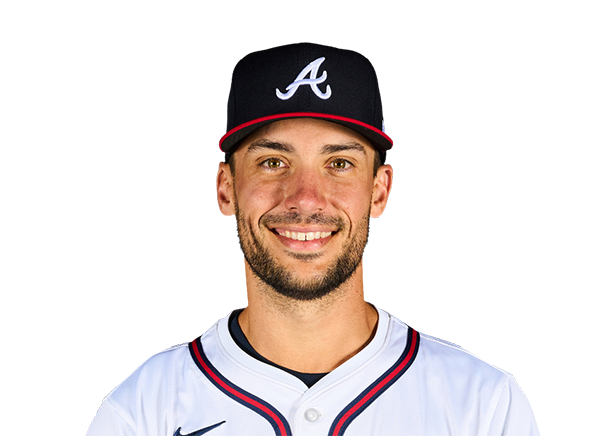 Matt Olson | 2-5 | 5 | 0 | 2 | 2 | 0 | 0 | 2 | 21 | .297 | .380 | .645 |
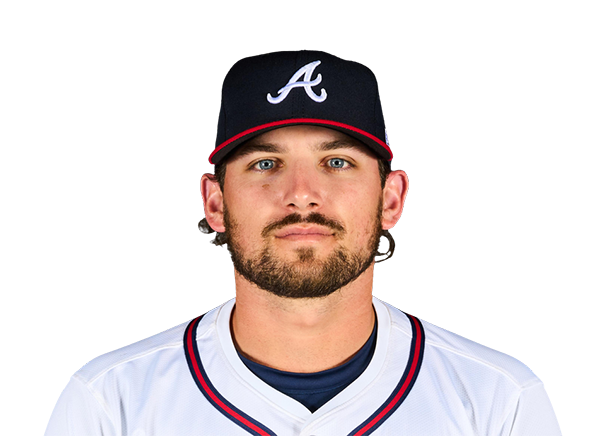 Austin Riley | 1-4 | 4 | 1 | 1 | 1 | 0 | 1 | 1 | 23 | .212 | .286 | .358 |
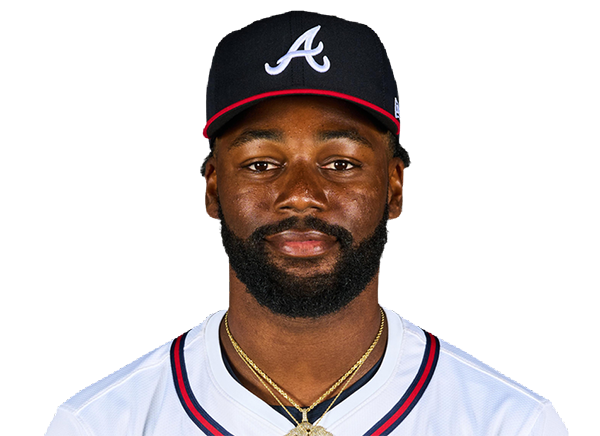 Michael Harris II | 1-5 | 5 | 0 | 1 | 1 | 0 | 0 | 2 | 19 | .315 | .344 | .524 |
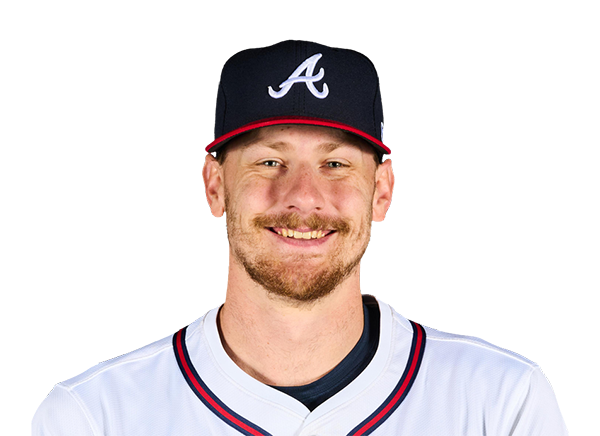 Sean Murphy | 0-5 | 5 | 0 | 0 | 0 | 0 | 0 | 3 | 18 | .091 | .091 | .091 |
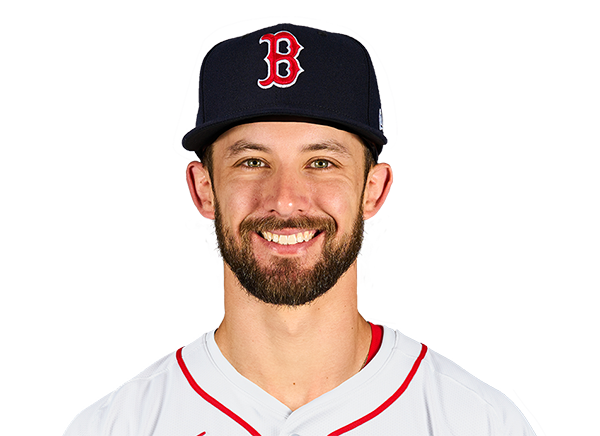 Eli White | 1-2 | 2 | 1 | 1 | 0 | 0 | 0 | 0 | 10 | .232 | .254 | .393 |
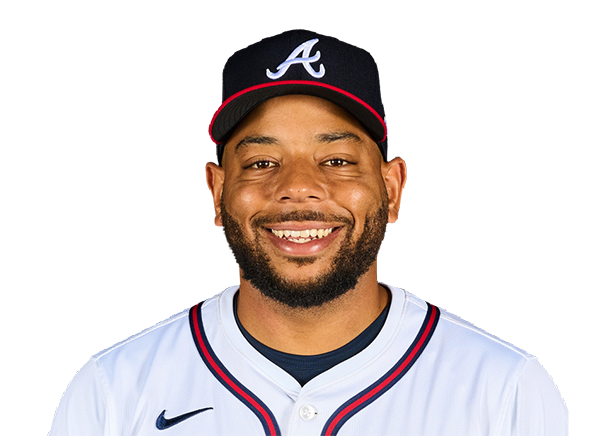 Dominic Smith | 0-1 | 1 | 0 | 0 | 0 | 0 | 0 | 0 | 5 | .320 | .354 | .520 |
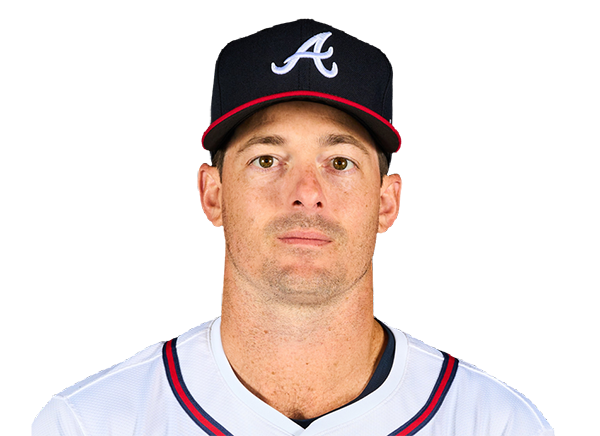 Mike Yastrzemski | 0-1 | 1 | 0 | 0 | 0 | 0 | 0 | 1 | 5 | .200 | .258 | .252 |
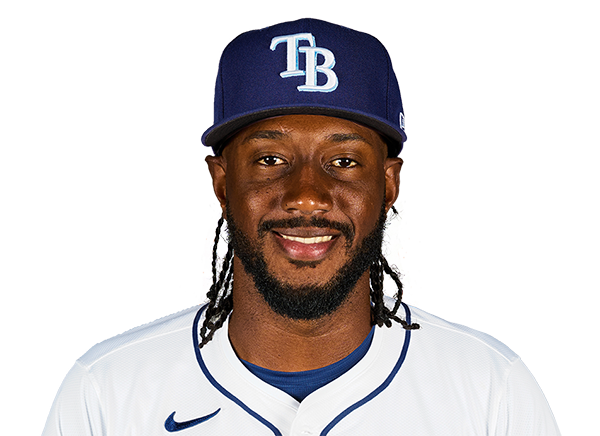 Jorge Mateo | 2-4 | 4 | 2 | 2 | 0 | 0 | 0 | 1 | 13 | .288 | .315 | .442 |
Los Angeles Dodgers
| Player | H-AB | AB | R | H | RBI | HR | BB | K | #P | AVG | OBP | SLG |
|---|---|---|---|---|---|---|---|---|---|---|---|---|
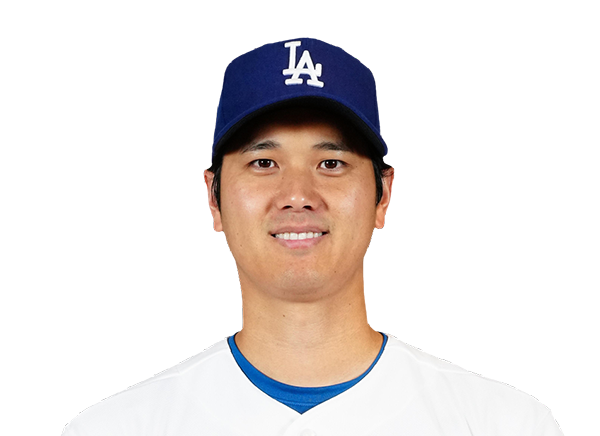 Shohei Ohtani | 1-4 | 4 | 0 | 1 | 0 | 0 | 0 | 2 | 21 | .248 | .382 | .431 |
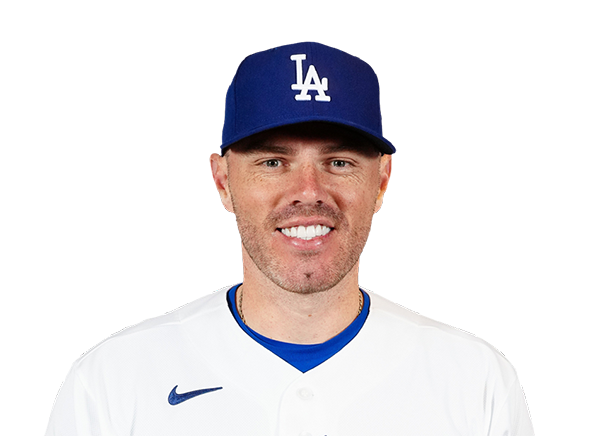 Freddie Freeman | 0-3 | 3 | 0 | 0 | 0 | 0 | 0 | 0 | 9 | .272 | .335 | .435 |
 Dalton Rushing | 0-1 | 1 | 0 | 0 | 0 | 0 | 0 | 1 | 5 | .322 | .394 | .712 |
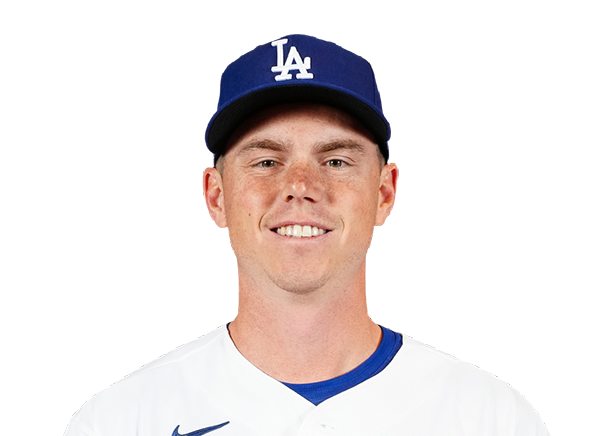 Will Smith | 1-3 | 3 | 0 | 1 | 0 | 0 | 1 | 0 | 14 | .261 | .331 | .369 |
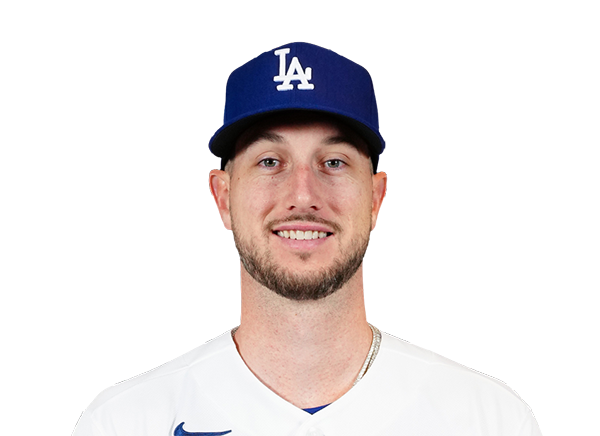 Kyle Tucker | 0-2 | 2 | 0 | 0 | 0 | 0 | 0 | 1 | 9 | .250 | .333 | .396 |
 Alex Call | 1-2 | 2 | 1 | 1 | 0 | 0 | 0 | 0 | 9 | .333 | .455 | .444 |
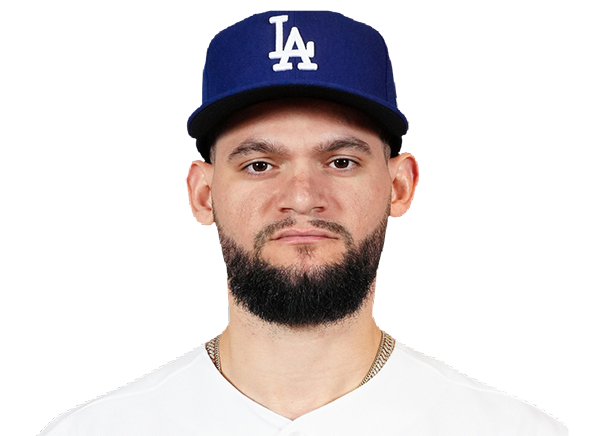 Andy Pages | 2-4 | 4 | 1 | 2 | 2 | 1 | 0 | 1 | 24 | .333 | .372 | .576 |
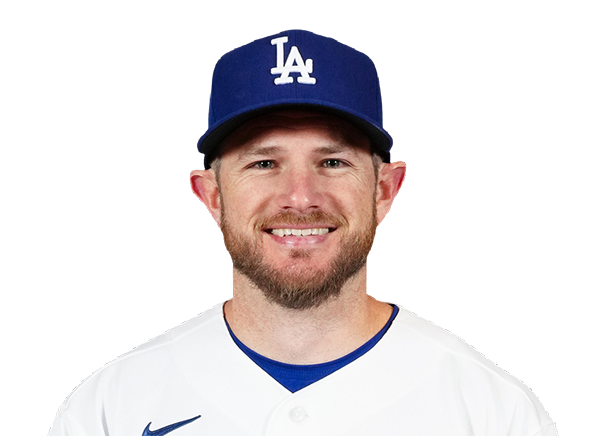 Max Muncy | 0-2 | 2 | 0 | 0 | 0 | 0 | 0 | 0 | 11 | .274 | .375 | .532 |
 Santiago Espinal | 0-2 | 2 | 0 | 0 | 0 | 0 | 0 | 0 | 5 | .188 | .188 | .250 |
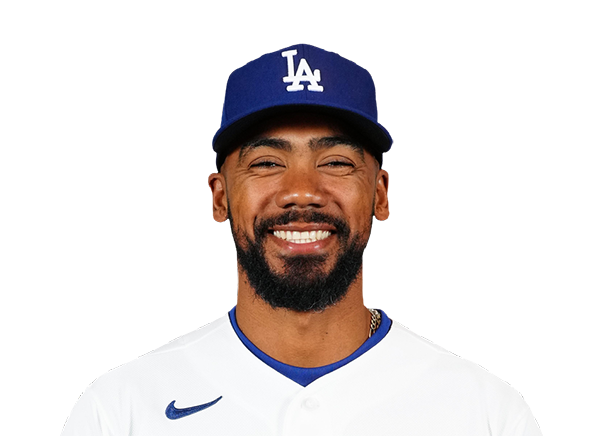 Teoscar Hernandez | 1-3 | 3 | 0 | 1 | 0 | 0 | 1 | 1 | 17 | .238 | .317 | .365 |
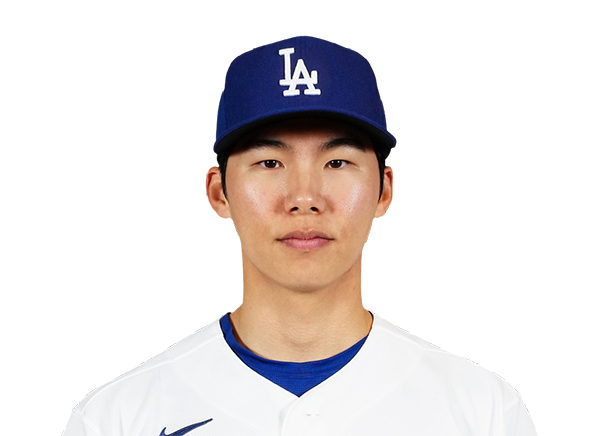 Hyeseong Kim | 0-3 | 3 | 0 | 0 | 0 | 0 | 1 | 1 | 18 | .301 | .366 | .411 |
 Alex Freeland | 0-3 | 3 | 0 | 0 | 0 | 0 | 0 | 2 | 9 | .245 | .321 | .351 |
Atlanta Braves
| Player | IP | H | R | ER | BB | K | HR | PC-ST | ERA | PC |
|---|---|---|---|---|---|---|---|---|---|---|
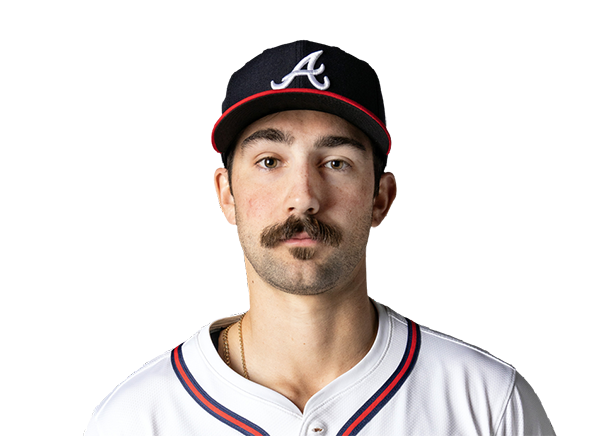 Spencer Strider | 6.0 | 1 | 0 | 0 | 2 | 8 | 0 | 91-59 | 2.89 | 91 |
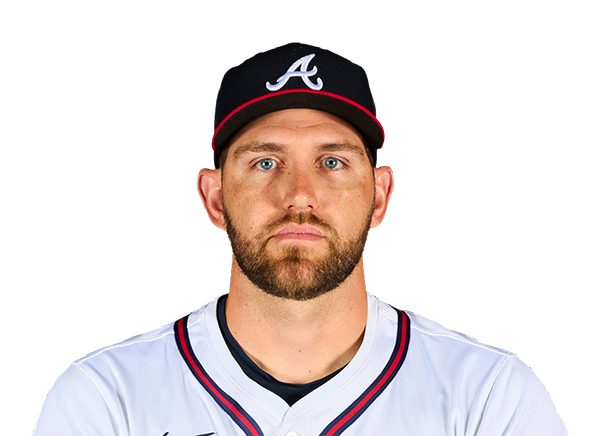 Dylan Lee | 1.0 | 1 | 0 | 0 | 0 | 0 | 0 | 18-11 | 0.96 | 18 |
 Reynaldo Lopez | 2.0 | 4 | 2 | 2 | 1 | 1 | 1 | 42-27 | 3.71 | 42 |
Los Angeles Dodgers
| Player | IP | H | R | ER | BB | K | HR | PC-ST | ERA | PC |
|---|---|---|---|---|---|---|---|---|---|---|
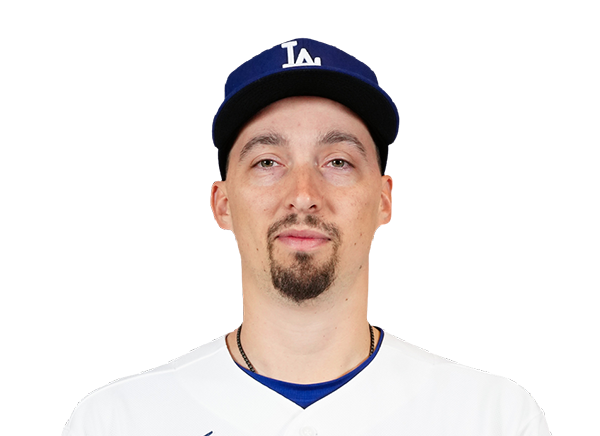 Blake Snell | 3.0 | 6 | 5 | 4 | 2 | 5 | 0 | 77-50 | 12.00 | 77 |
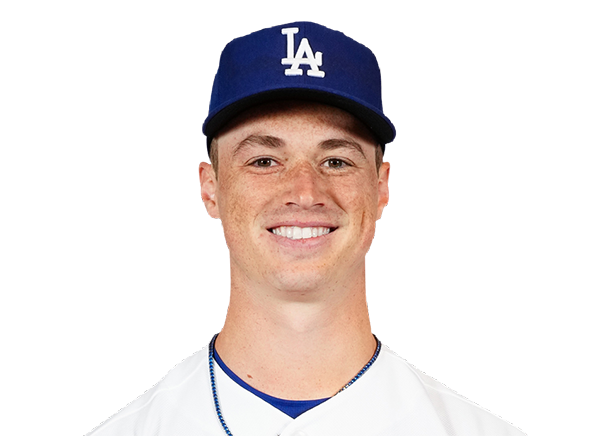 Jack Dreyer | 1.1 | 1 | 0 | 0 | 0 | 0 | 0 | 11-8 | 2.41 | 11 |
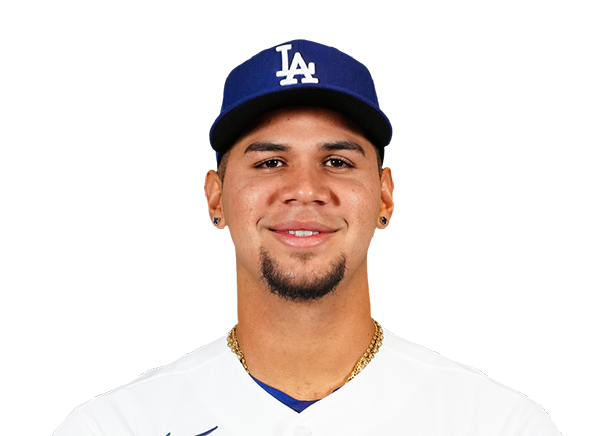 Edgardo Henriquez | 1.2 | 1 | 1 | 1 | 1 | 1 | 0 | 34-23 | 4.50 | 34 |
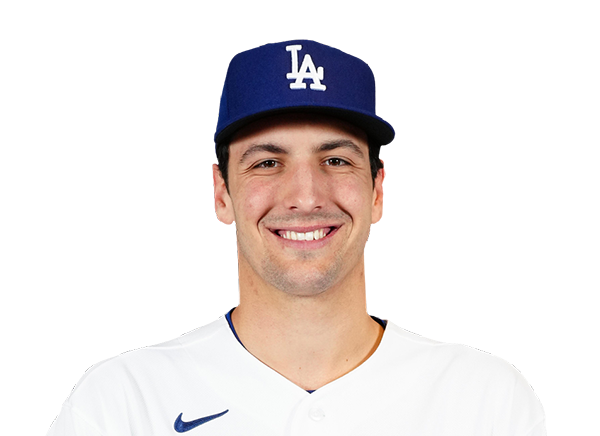 Paul Gervase | 3.0 | 4 | 1 | 1 | 1 | 5 | 0 | 50-34 | 3.00 | 50 |
H2H / Season Series
LAD2–7
ATL
LAD2–7
ATL
LAD3–1
ATL
Last 5 Games
| Date | Opponent | Result |
|---|---|---|
| Aug 22 |  @ MIL | L1–4 |
| Aug 21 | @ MIL | L1–2 |
| Aug 20 |  @ CHW | W2–0 |
| Aug 19 |  @ MIN | L4–6 |
| Aug 18 | @ MIN | L1–4 |
| Date | Opponent | Result |
|---|---|---|
| Aug 21 |  vs PIT | W5–4 |
| Aug 19 |  @ COL | W6–4 |
| Aug 18 | @ COL | W7–6 |
| Aug 17 | @ COL | W11–5 |
| Aug 16 | vs MIL | L2–6 |
Standings
American League
| Team | W | L | PCT | GB | DIFF | STRK |
|---|---|---|---|---|---|---|
1 Rays | 76 | 52 | .594 | - | +43 | L2 |
| 2White Sox | 67 | 61 | .523 | 9 | +47 | W1 |
3 Astros | 65 | 64 | .504 | 11.5 | -42 | W1 |
4 Yankees | 73 | 56 | .566 | 3.5 | +95 | L1 |
5 Red Sox | 69 | 59 | .539 | 7 | +97 | W1 |
6 Rangers | 64 | 65 | .496 | 12.5 | -45 | W2 |
7 Blue Jays | 64 | 67 | .489 | 13.5 | -50 | W1 |
| 8Twins | 63 | 66 | .488 | 13.5 | -45 | L1 |
9 Guardians | 63 | 66 | .488 | 13.5 | -15 | W2 |
10 Orioles | 62 | 67 | .481 | 14.5 | -34 | W1 |
11 Tigers | 61 | 67 | .477 | 15 | +79 | L3 |
12 Mariners | 61 | 68 | .473 | 15.5 | -45 | W1 |
13 Royals | 56 | 74 | .431 | 21 | -97 | W6 |
14 Angels | 51 | 78 | .395 | 25.5 | -71 | L1 |
15 Athletics | 49 | 80 | .380 | 27.5 | -189 | L5 |
National League
| Team | W | L | PCT | GB | DIFF | STRK |
|---|---|---|---|---|---|---|
| 1Brewers | 81 | 49 | .623 | - | +163 | W3 |
| 2Dodgers | 78 | 51 | .605 | 2.5 | +146 | W4 |
| 3Braves | 75 | 55 | .577 | 6 | +108 | L2 |
4 Cubs | 74 | 55 | .574 | 6.5 | +99 | L2 |
5 Phillies | 71 | 58 | .550 | 9.5 | +16 | W7 |
6 Padres | 69 | 60 | .535 | 11.5 | +7 | W1 |
7 Diamondbacks | 68 | 61 | .527 | 12.5 | +13 | W2 |
8 Cardinals | 66 | 64 | .508 | 15 | +9 | L1 |
9 Marlins | 65 | 64 | .504 | 15.5 | +15 | W1 |
| 10Pirates | 63 | 67 | .485 | 18 | +30 | L1 |
11 Reds | 61 | 68 | .473 | 19.5 | -98 | L2 |
12 Nationals | 61 | 69 | .469 | 20 | +16 | L2 |
13 Mets | 58 | 71 | .450 | 22.5 | -44 | L1 |
14 Giants | 52 | 76 | .406 | 28 | -78 | L2 |
| 15Rockies | 50 | 78 | .391 | 30 | -130 | L4 |
ATL
VS
LAD
Pitchers
Spencer Strider
Dylan Lee
Reynaldo Lopez
Catchers
Sean Murphy
Infielders
Ozzie Albies
Matt Olson
Austin Riley
Jorge Mateo
Outfielders
Mauricio Dubon
Michael Harris II
Eli White
Mike Yastrzemski
Designated Hitters
Drake Baldwin
Other Players
Dominic Smith
Pitchers
Blake Snell
Jack Dreyer
Edgardo Henriquez
Paul Gervase
Catchers
Will Smith
Infielders
Freddie Freeman
Dalton Rushing
Max Muncy
Santiago Espinal
Hyeseong Kim
Alex Freeland
Outfielders
Kyle Tucker
Alex Call
Andy Pages
Teoscar Hernandez
Designated Hitters
Shohei Ohtani
Braves
VS
Dodgers
Batting
129
Team Games Played
129
4363
At Bats
4354
1074
Hits
1127
584
Runs Batted In
610
167
Home Runs
167
63
Stolen Bases
50
.246
Batting Average
.259
609
Runs
645
206
Doubles
211
9
Triples
14
1799
Total Bases
1867
375
Walks
476
1046
Strikeouts
1014
.310
On Base Percentage
.335
.412
Slugging Percentage
.429
.723
OBP Pct + SLG Pct
.764
129
Games Played
129
129
Games Started
129
48
Hit By Pitch
44
0.0
Wins Above Replacement
0.0
0.0
Offensive Wins Above Replacement
0.0
21
Caught Stealing
18
1
Is Qualified
1
570.3
Runs Created
627.0
4.5
Runs Created Per 27 Outs
5.0
.078
Walks Per Plate Appearance
.097
0.36
Walk To Strikeout Ratio
0.47
.166
Isolated Power
.170
.262
Secondary Average
.287
3.88
Pitches Per Plate Appearance
3.93
382
Extra Base Hits
392
4833
Plate Appearances
4931
26.1
At Bats Per Home Run
26.1
7
Sacrifice Hit
12
37
Sacrifice Flies
42
Pitching
129
Team Games Played
129
49
Quality Starts
68
75
Wins
78
54
Losses
51
39
Saves
36
92
Holds
84
983
Hits
928
462
Earned runs
470
145
Home Runs
148
439
Walks
403
1101
Strikeouts
1168
8.7
Strikeouts Per 9 Innings
9.2
144.4
Pitches Per Start
143.8
1.24
Walks Plus Hits Per Inning Pitched
1.16
3.63
Earned Run Average
3.70
54
Losses
51
1145.0
Innings pitched
1142.2
.581
Win Percentage
.605
56
Save Opportunities
55
.230
Opponent Batting Average
.218
.307
Opponent's On-base pct.
.293
.378
Opponent's Slugging pct.
.372
.685
Opponent's OPB Pct + SLG Pct
.665
4270
At Bats
4249
162
Doubles
188
17
Triples
10
45
Batters Hit
55
95
Stolen Bases
76
129
Games Played
129
0
Complete Games
1
8
Shutouts
10
26
Wild Pitches
30
478
Runs Batted In
473
4
Balks
4
1145.0
Innings pitched
1142.2
8.7
Strikeouts Per 9 Innings
9.2
17
Caught Stealing
20
129
Games Started
129
0.0
Wins Above Replacement
0.0
1
Is Qualified
1
498
Runs
499
462
Earned Runs
470
1614
Total Bases
1580
Fielding
129
Team Games Played
129
1145
Full Innings
1143
4538
Total Chances
4523
3435
Putouts
3428
1045
Assists
1043
58
Errors
52
206
Double Plays
211
0.987
Fielding Percentage
0.989
35.2
Range Factor
35.2
0.0
Zone Rating
0.0
129
Games Played
129
0
Games Started
0
0.0
Defensive Wins Above Replacement
0.0
1
Qualified
1