

Braves vs Dodgers Live Score (10 May, 2026)
Game Information
Stage
Standard
Season
2026
First Pitch
Sun, May 10, 4:10 pm
Venue
Dodger Stadium
Location
Los Angeles, California
Attendance
49,514
Live Situation
0Balls
1Strikes
0Outs
—Pitcher
—At Bat
Pitch Sequence
1
STRIKE LOOKING
Sinker
95 MPH
2
BALL IN PLAY
Four-seam FB
95 MPH
Injury Report

Team Stats
 ATL
LAD


7
Runs
2
9
Hits
2
1
Errors
0
2
Home Runs
1
1
Walks
6
7
Strikeouts
10
Player Box Score
Atlanta Braves
| Player | H-AB | AB | R | H | RBI | HR | BB | K | #P | AVG | OBP | SLG |
|---|---|---|---|---|---|---|---|---|---|---|---|---|
 Mauricio Dubon | 1-5 | 5 | 0 | 1 | 3 | 0 | 0 | 0 | 12 | .271 | .331 | .410 |
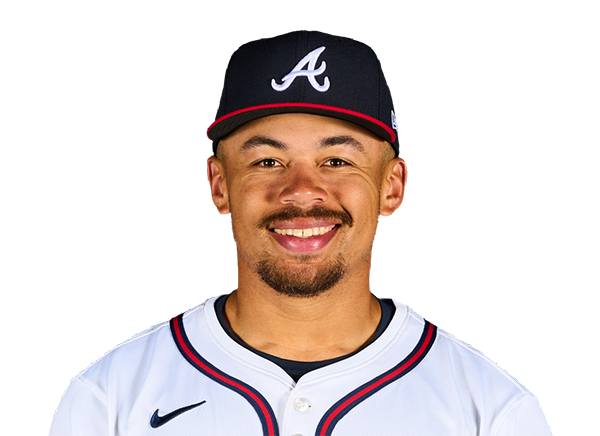 Drake Baldwin | 1-4 | 4 | 1 | 1 | 1 | 1 | 0 | 1 | 9 | .297 | .383 | .509 |
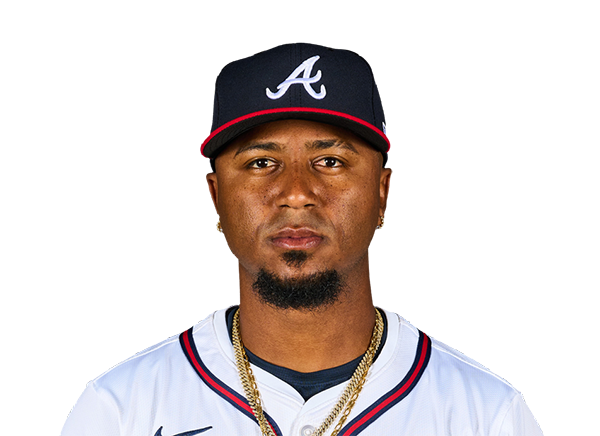 Ozzie Albies | 0-4 | 4 | 0 | 0 | 0 | 0 | 0 | 0 | 8 | .306 | .356 | .506 |
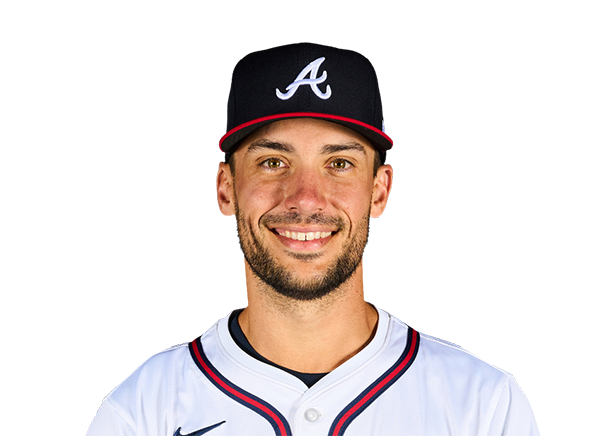 Matt Olson | 1-4 | 4 | 1 | 1 | 1 | 1 | 0 | 3 | 18 | .296 | .377 | .654 |
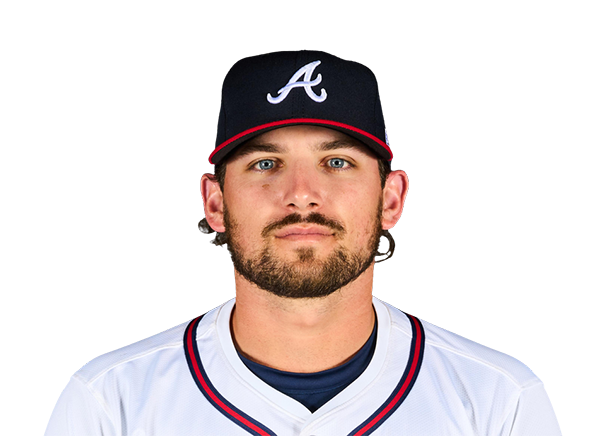 Austin Riley | 1-4 | 4 | 1 | 1 | 0 | 0 | 0 | 1 | 14 | .213 | .285 | .355 |
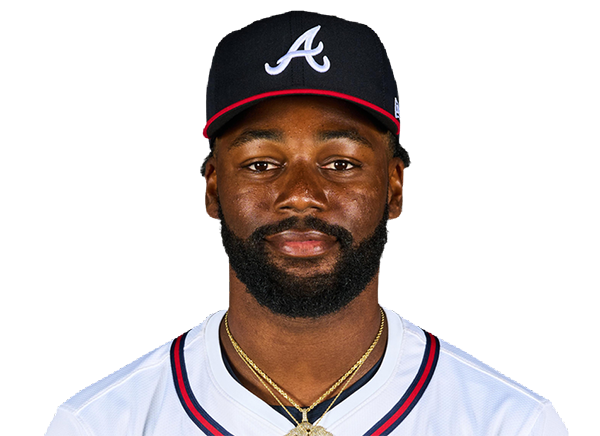 Michael Harris II | 1-4 | 4 | 1 | 1 | 0 | 0 | 0 | 1 | 14 | .313 | .341 | .516 |
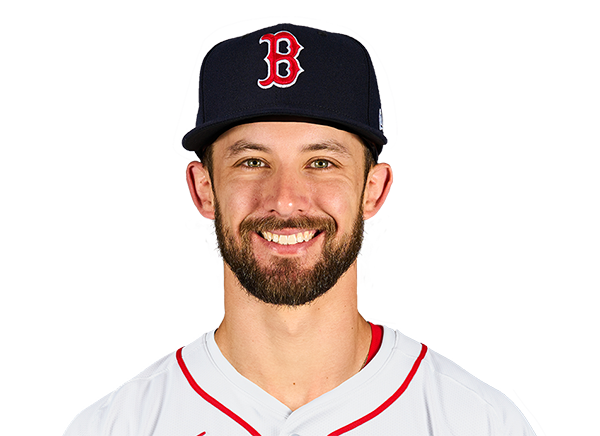 Eli White | 1-3 | 3 | 0 | 1 | 1 | 0 | 0 | 1 | 9 | .237 | .258 | .390 |
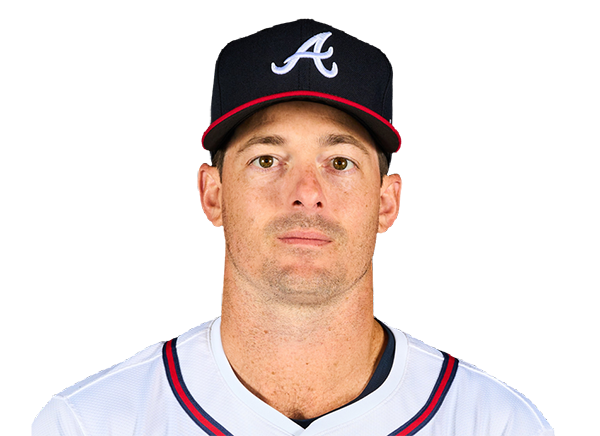 Mike Yastrzemski | 0-0 | 0 | 1 | 0 | 0 | 0 | 0 | 0 | 4 | .200 | .264 | .252 |
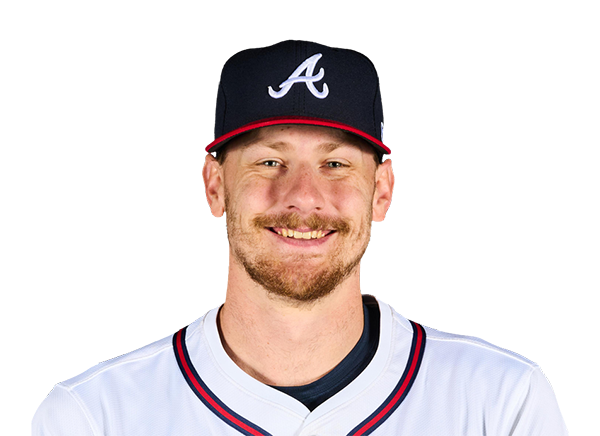 Sean Murphy | 0-3 | 3 | 1 | 0 | 0 | 0 | 0 | 0 | 5 | .071 | .071 | .071 |
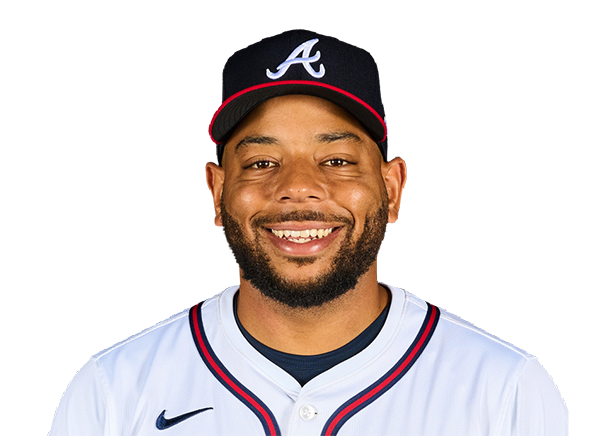 Dominic Smith | 1-1 | 1 | 0 | 1 | 0 | 0 | 0 | 0 | 5 | .329 | .361 | .526 |
 Raisel Iglesias | 0-0 | 0 | 0 | 0 | 0 | 0 | 0 | 0 | 0 | .000 | .000 | .000 |
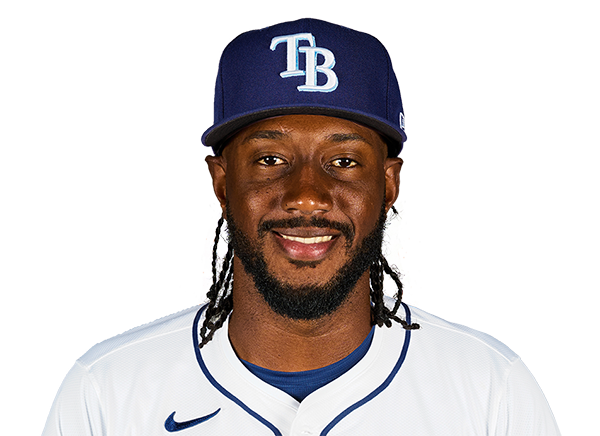 Jorge Mateo | 2-3 | 3 | 1 | 2 | 1 | 0 | 1 | 0 | 13 | .309 | .345 | .455 |
Los Angeles Dodgers
| Player | H-AB | AB | R | H | RBI | HR | BB | K | #P | AVG | OBP | SLG |
|---|---|---|---|---|---|---|---|---|---|---|---|---|
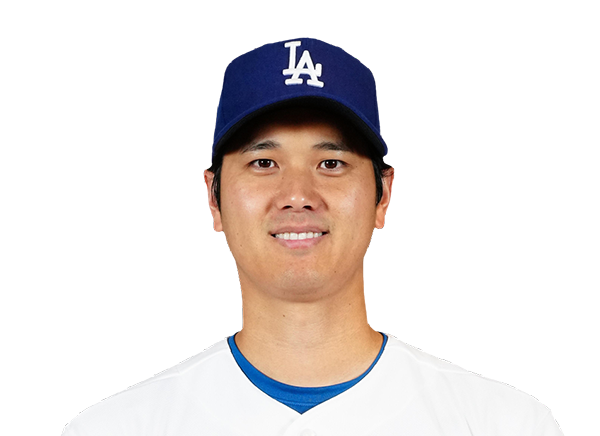 Shohei Ohtani | 0-4 | 4 | 0 | 0 | 0 | 0 | 0 | 1 | 20 | .241 | .374 | .418 |
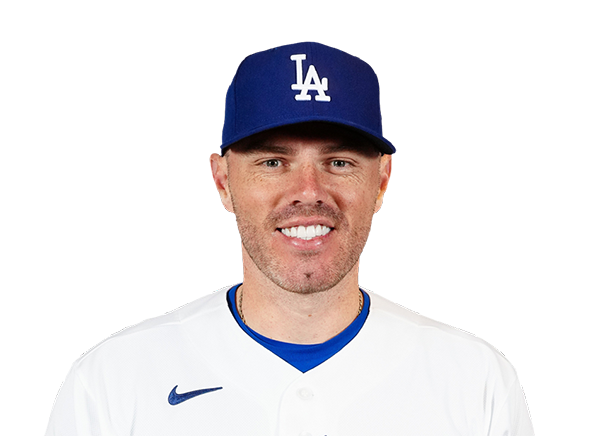 Freddie Freeman | 0-3 | 3 | 0 | 0 | 0 | 0 | 1 | 0 | 11 | .267 | .333 | .427 |
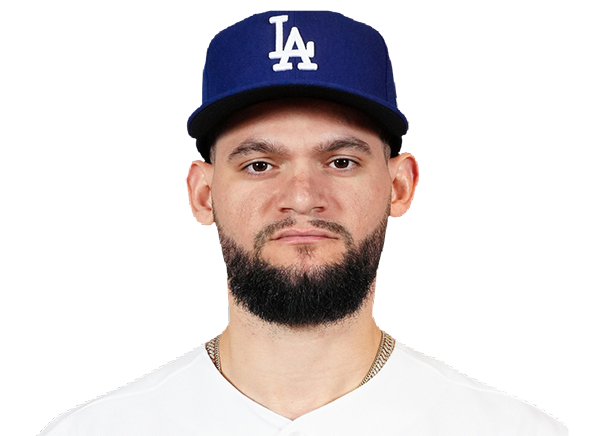 Andy Pages | 1-3 | 3 | 0 | 1 | 0 | 0 | 1 | 0 | 9 | .333 | .375 | .571 |
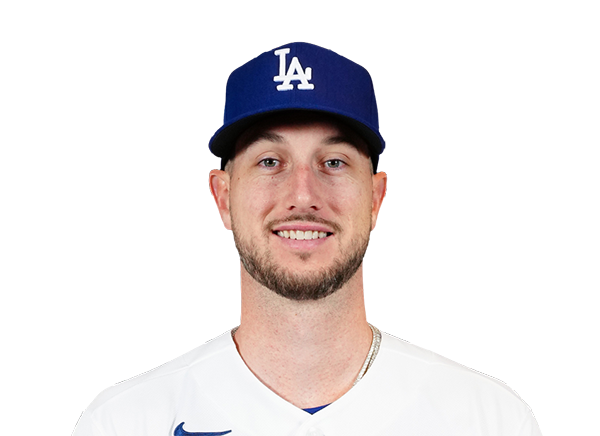 Kyle Tucker | 0-1 | 1 | 1 | 0 | 0 | 0 | 3 | 0 | 20 | .248 | .343 | .393 |
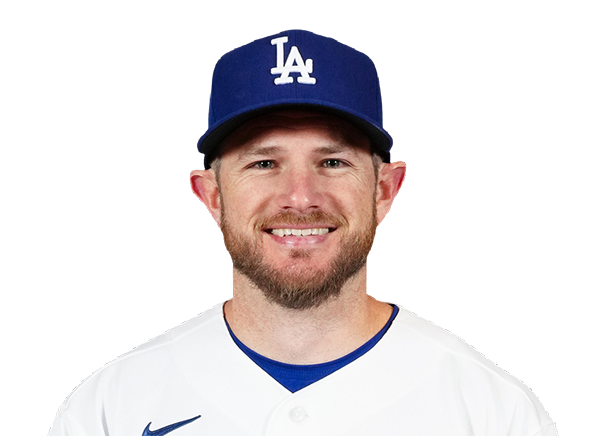 Max Muncy | 1-4 | 4 | 1 | 1 | 2 | 1 | 0 | 1 | 12 | .273 | .372 | .547 |
 Alex Call | 0-3 | 3 | 0 | 0 | 0 | 0 | 1 | 2 | 25 | .308 | .438 | .410 |
 Dalton Rushing | 0-4 | 4 | 0 | 0 | 0 | 0 | 0 | 1 | 9 | .302 | .371 | .667 |
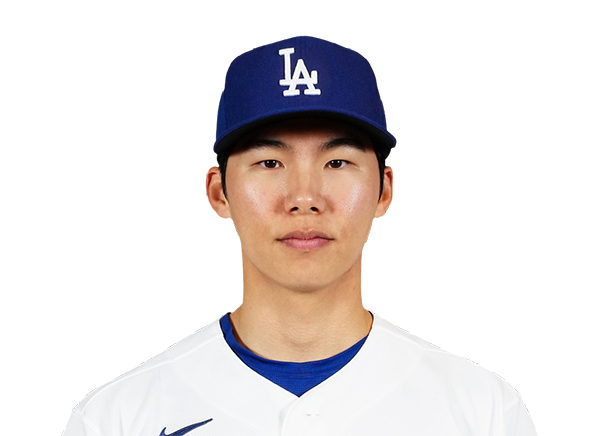 Hyeseong Kim | 0-3 | 3 | 0 | 0 | 0 | 0 | 0 | 3 | 20 | .289 | .353 | .395 |
 Alex Freeland | 0-4 | 4 | 0 | 0 | 0 | 0 | 0 | 2 | 12 | .235 | .309 | .337 |
Atlanta Braves
| Player | IP | H | R | ER | BB | K | HR | PC-ST | ERA | PC |
|---|---|---|---|---|---|---|---|---|---|---|
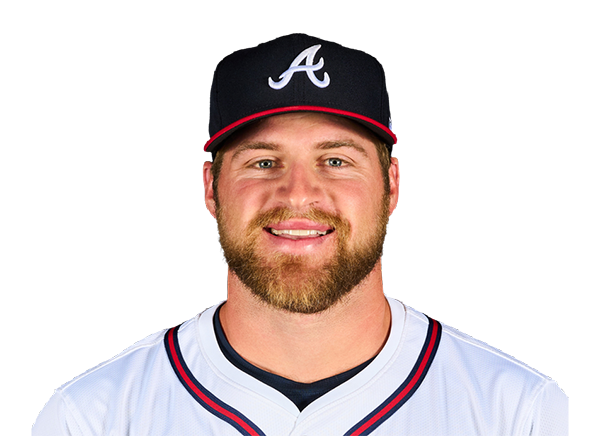 Bryce Elder | 5.2 | 1 | 0 | 0 | 4 | 8 | 0 | 83-46 | 1.81 | 83 |
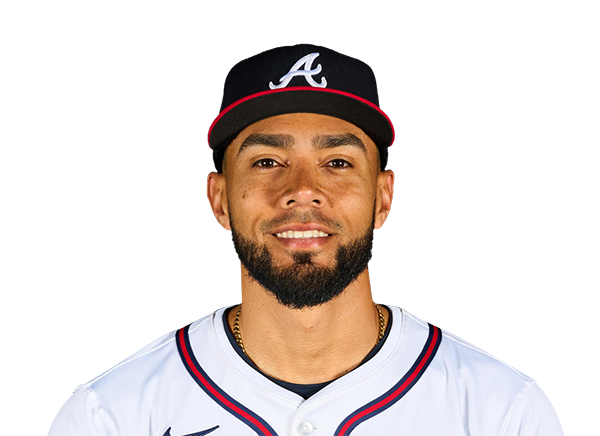 Robert Suarez | 1.1 | 0 | 0 | 0 | 1 | 0 | 0 | 30-17 | 0.53 | 30 |
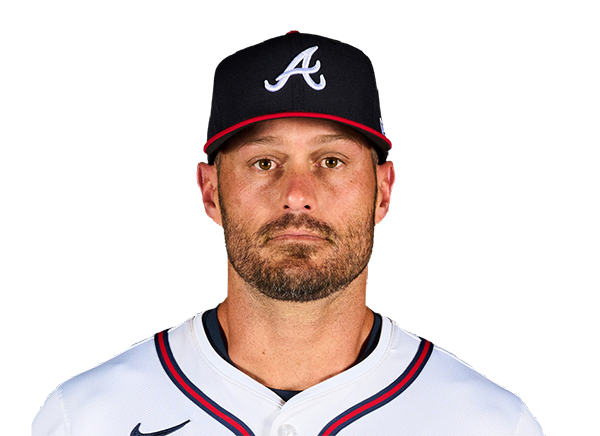 Tyler Kinley | 1.0 | 1 | 2 | 2 | 1 | 1 | 1 | 19-11 | 3.63 | 19 |
|
Raisel Iglesias | 1.0 | 0 | 0 | 0 | 0 | 1 | 0 | 6-6 | 0.00 | 6 |
Los Angeles Dodgers
| Player | IP | H | R | ER | BB | K | HR | PC-ST | ERA | PC |
|---|---|---|---|---|---|---|---|---|---|---|
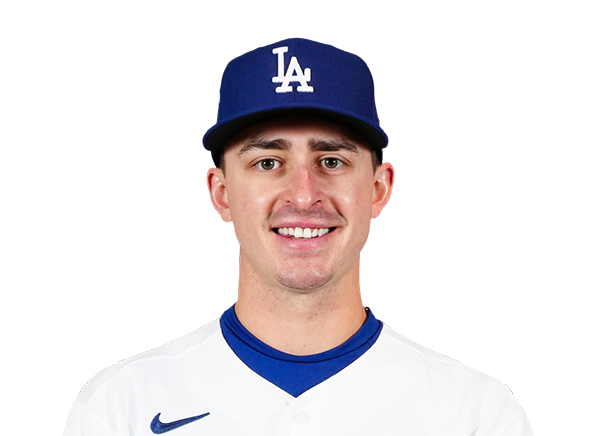 Justin Wrobleski | 8.2 | 7 | 7 | 7 | 1 | 7 | 2 | 100-67 | 2.42 | 100 |
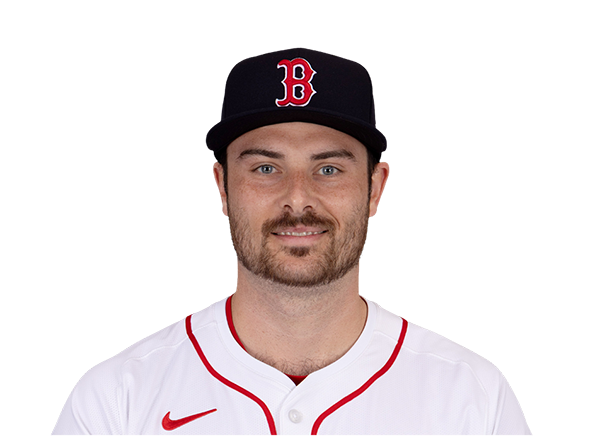 Wyatt Mills | 0.1 | 2 | 0 | 0 | 0 | 0 | 0 | 11-8 | 0.00 | 11 |
H2H / Season Series
LAD2–7
ATL
LAD2–7
ATL
LAD3–1
ATL
Last 5 Games
| Date | Opponent | Result |
|---|---|---|
| Aug 22 |  @ MIL | L1–4 |
| Aug 21 | @ MIL | L1–2 |
| Aug 20 |  @ CHW | W2–0 |
| Aug 19 |  @ MIN | L4–6 |
| Aug 18 | @ MIN | L1–4 |
| Date | Opponent | Result |
|---|---|---|
| Aug 22 |  vs PIT | W4–3 |
| Aug 21 | vs PIT | W5–4 |
| Aug 19 |  @ COL | W6–4 |
| Aug 18 | @ COL | W7–6 |
| Aug 17 | @ COL | W11–5 |
Standings
American League
| Team | W | L | PCT | GB | DIFF | STRK |
|---|---|---|---|---|---|---|
1 Rays | 76 | 53 | .589 | - | +42 | L3 |
| 2White Sox | 67 | 62 | .519 | 9 | +42 | L1 |
3 Astros | 65 | 65 | .500 | 11.5 | -43 | L1 |
4 Yankees | 73 | 56 | .566 | 3 | +95 | L1 |
5 Red Sox | 70 | 59 | .543 | 6 | +98 | W2 |
6 Rangers | 64 | 66 | .492 | 12.5 | -48 | L1 |
7 Guardians | 64 | 66 | .492 | 12.5 | -14 | W3 |
8 Blue Jays | 64 | 67 | .489 | 13 | -50 | W1 |
| 9Twins | 63 | 67 | .485 | 13.5 | -47 | L2 |
10 Orioles | 63 | 67 | .485 | 13.5 | -33 | W2 |
11 Mariners | 62 | 68 | .477 | 14.5 | -44 | W2 |
12 Tigers | 61 | 68 | .473 | 15 | +77 | L4 |
13 Royals | 57 | 74 | .435 | 20 | -95 | W7 |
14 Angels | 52 | 78 | .400 | 24.5 | -68 | W1 |
15 Athletics | 50 | 80 | .385 | 26.5 | -188 | W1 |
National League
| Team | W | L | PCT | GB | DIFF | STRK |
|---|---|---|---|---|---|---|
| 1Brewers | 81 | 49 | .623 | - | +163 | W3 |
| 2Dodgers | 79 | 51 | .608 | 2 | +147 | W5 |
| 3Braves | 75 | 55 | .577 | 6 | +108 | L2 |
4 Cubs | 74 | 56 | .569 | 7 | +98 | L3 |
5 Phillies | 72 | 58 | .554 | 9 | +25 | W8 |
6 Padres | 70 | 60 | .538 | 11 | +9 | W2 |
7 Diamondbacks | 68 | 62 | .523 | 13 | +7 | L1 |
8 Marlins | 66 | 64 | .508 | 15 | +17 | W2 |
9 Cardinals | 66 | 65 | .504 | 15.5 | 0 | L2 |
| 10Pirates | 63 | 68 | .481 | 18.5 | +29 | L2 |
11 Reds | 62 | 68 | .477 | 19 | -92 | W1 |
12 Nationals | 61 | 70 | .466 | 20.5 | +14 | L3 |
13 Mets | 59 | 71 | .454 | 22 | -39 | W1 |
14 Giants | 52 | 77 | .403 | 28.5 | -79 | L3 |
| 15Rockies | 50 | 79 | .388 | 30.5 | -131 | L5 |
ATL
VS
LAD
Pitchers
Raisel Iglesias
Bryce Elder
Robert Suarez
Tyler Kinley
Catchers
Drake Baldwin
Sean Murphy
Infielders
Ozzie Albies
Matt Olson
Austin Riley
Jorge Mateo
Outfielders
Mauricio Dubon
Michael Harris II
Eli White
Mike Yastrzemski
Other Players
Dominic Smith
Pitchers
Justin Wrobleski
Wyatt Mills
Catchers
Dalton Rushing
Infielders
Freddie Freeman
Max Muncy
Hyeseong Kim
Alex Freeland
Outfielders
Andy Pages
Kyle Tucker
Alex Call
Designated Hitters
Shohei Ohtani
Braves
VS
Dodgers
Batting
130
Team Games Played
130
4395
At Bats
4385
1081
Hits
1134
585
Runs Batted In
614
167
Home Runs
167
63
Stolen Bases
51
.246
Batting Average
.259
610
Runs
649
207
Doubles
213
9
Triples
14
1807
Total Bases
1876
378
Walks
481
1052
Strikeouts
1024
.310
On Base Percentage
.335
.411
Slugging Percentage
.428
.721
OBP Pct + SLG Pct
.763
130
Games Played
130
130
Games Started
130
48
Hit By Pitch
45
0.0
Wins Above Replacement
0.0
0.0
Offensive Wins Above Replacement
0.0
21
Caught Stealing
18
1
Is Qualified
1
571.9
Runs Created
630.6
4.5
Runs Created Per 27 Outs
5.0
.078
Walks Per Plate Appearance
.097
0.36
Walk To Strikeout Ratio
0.47
.165
Isolated Power
.169
.261
Secondary Average
.286
3.89
Pitches Per Plate Appearance
3.93
383
Extra Base Hits
394
4868
Plate Appearances
4968
26.3
At Bats Per Home Run
26.3
7
Sacrifice Hit
12
37
Sacrifice Flies
42
Pitching
130
Team Games Played
130
49
Quality Starts
69
75
Wins
79
55
Losses
51
39
Saves
37
92
Holds
86
991
Hits
934
463
Earned runs
473
146
Home Runs
148
442
Walks
404
1106
Strikeouts
1183
8.6
Strikeouts Per 9 Innings
9.2
144.5
Pitches Per Start
143.8
1.24
Walks Plus Hits Per Inning Pitched
1.16
3.61
Earned Run Average
3.70
55
Losses
51
1153.0
Innings pitched
1151.2
.577
Win Percentage
.608
56
Save Opportunities
56
.230
Opponent Batting Average
.218
.307
Opponent's On-base pct.
.293
.378
Opponent's Slugging pct.
.371
.685
Opponent's OPB Pct + SLG Pct
.664
4301
At Bats
4281
164
Doubles
189
17
Triples
11
45
Batters Hit
55
95
Stolen Bases
76
130
Games Played
130
0
Complete Games
1
8
Shutouts
10
26
Wild Pitches
30
482
Runs Batted In
476
4
Balks
4
1153.0
Innings pitched
1151.2
8.6
Strikeouts Per 9 Innings
9.2
17
Caught Stealing
20
130
Games Started
130
0.0
Wins Above Replacement
0.0
1
Is Qualified
1
502
Runs
502
463
Earned Runs
473
1627
Total Bases
1589
Fielding
130
Team Games Played
130
1153
Full Innings
1152
4571
Total Chances
4560
3459
Putouts
3455
1053
Assists
1053
59
Errors
52
207
Double Plays
213
0.987
Fielding Percentage
0.989
35.2
Range Factor
35.2
0.0
Zone Rating
0.0
130
Games Played
130
0
Games Started
0
0.0
Defensive Wins Above Replacement
0.0
1
Qualified
1