

Braves vs Marlins Live Score (19 May, 2026)
Game Information
Stage
Standard
Season
2026
First Pitch
Tue, May 19, 4:10 pm
Venue
loanDepot park
Location
Miami, Florida
Attendance
7,521
Live Situation
1Balls
3Strikes
0Outs
—Pitcher
—At Bat
Pitch Sequence
1
BALL
Four-seam FB
94 MPH
2
STRIKE BUNTED FOUL
Changeup
87 MPH
3
STRIKE FOUL
Four-seam FB
95 MPH
4
STRIKE SWINGING
Four-seam FB
95 MPH
Injury Report

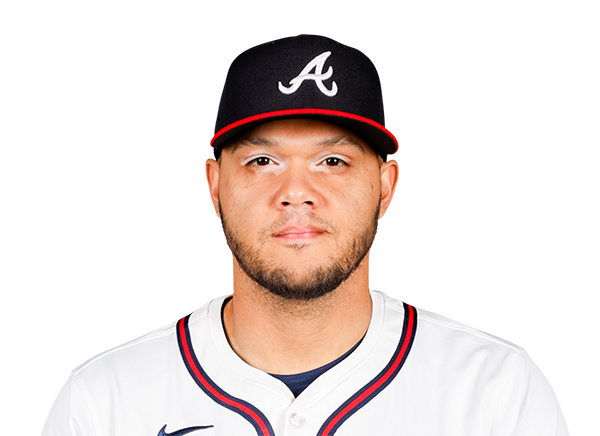
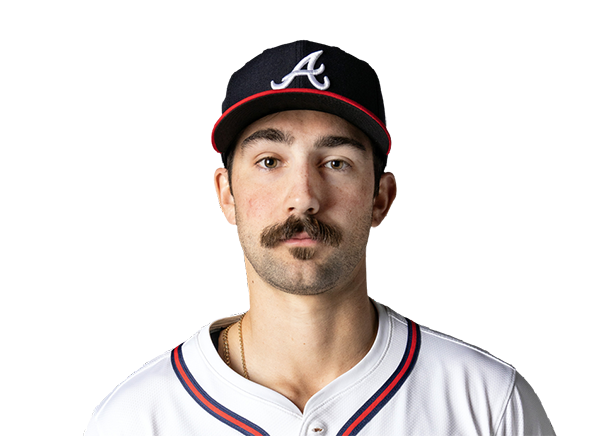
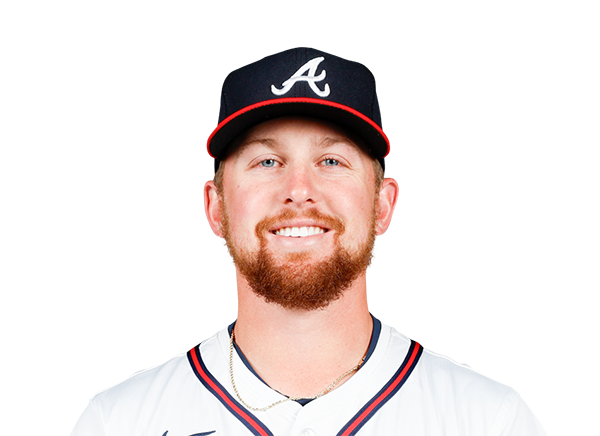
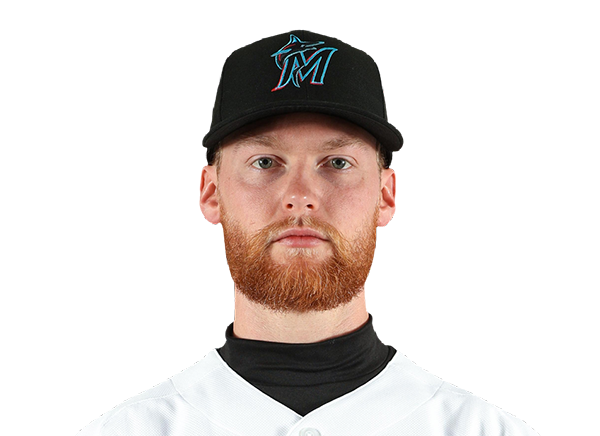

Team Stats
 ATL
MIA

8
Runs
4
10
Hits
8
1
Errors
0
1
Home Runs
1
8
Walks
4
11
Strikeouts
13
Player Box Score
Atlanta Braves
| Player | H-AB | AB | R | H | RBI | HR | BB | K | #P | AVG | OBP | SLG |
|---|---|---|---|---|---|---|---|---|---|---|---|---|
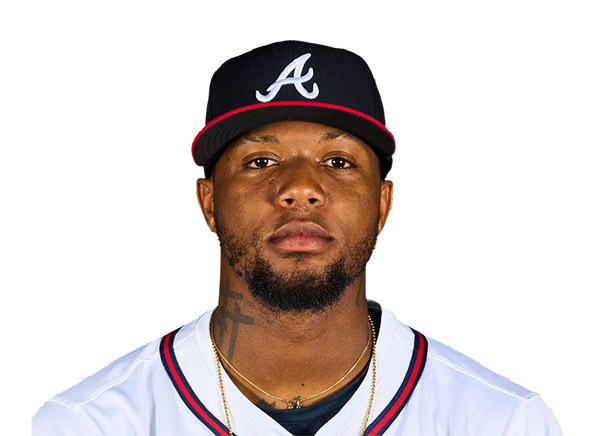 Ronald Acuna Jr. |
1-4 | 4 | 3 | 1 | 0 | 0 | 2 | 1 | 26 | .252 | .367 | .382 |
 Mauricio Dubon |
3-5 | 5 | 1 | 3 | 1 | 0 | 0 | 0 | 26 | .256 | .312 | .395 |
 Matt Olson |
2-3 | 3 | 0 | 2 | 3 | 0 | 2 | 0 | 18 | .283 | .364 | .594 |
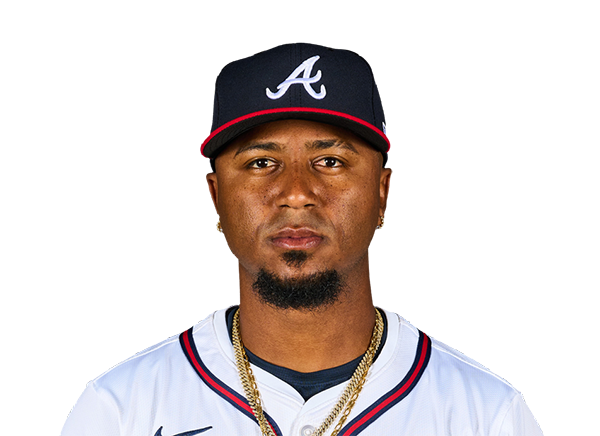 Ozzie Albies |
0-2 | 2 | 0 | 0 | 1 | 0 | 2 | 0 | 22 | .271 | .329 | .441 |
 Austin Riley |
0-4 | 4 | 1 | 0 | 0 | 0 | 0 | 3 | 23 | .211 | .279 | .368 |
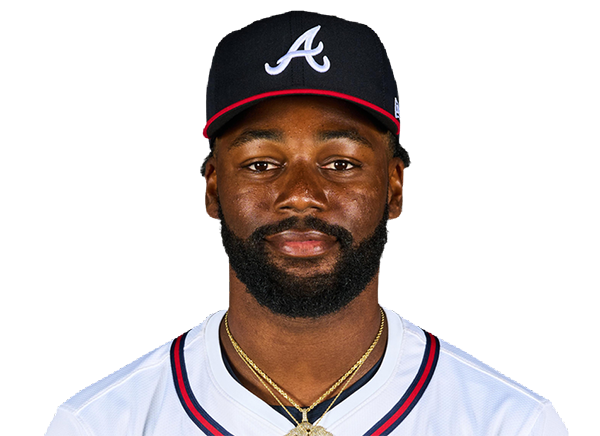 Michael Harris II |
2-5 | 5 | 1 | 2 | 2 | 1 | 0 | 1 | 13 | .291 | .319 | .494 |
 Jose Azocar |
0-1 | 1 | 0 | 0 | 0 | 0 | 0 | 0 | 5 | .333 | .375 | .467 |
 Mike Yastrzemski |
0-3 | 3 | 1 | 0 | 0 | 0 | 1 | 3 | 20 | .223 | .299 | .331 |
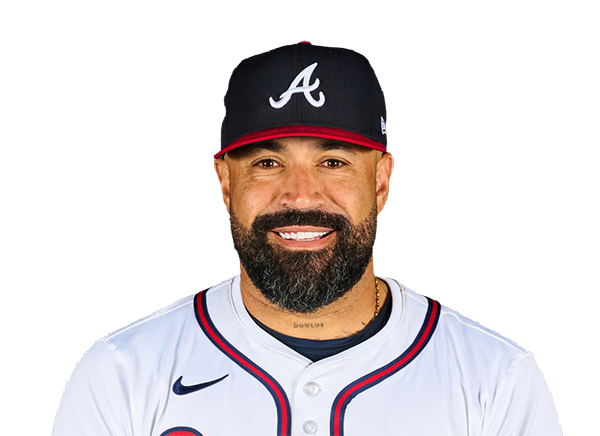 Sandy Leon |
0-3 | 3 | 0 | 0 | 0 | 0 | 0 | 2 | 13 | .182 | .182 | .182 |
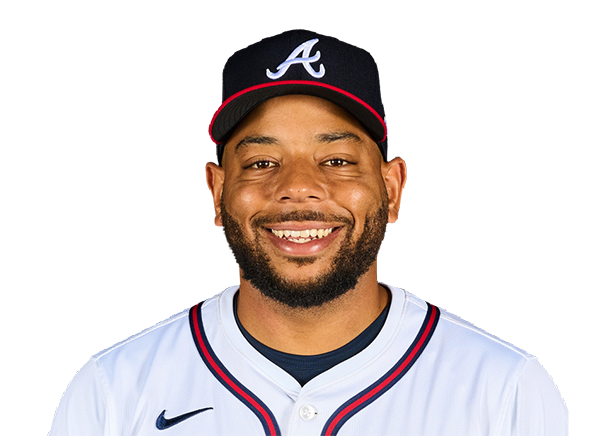 Dominic Smith |
0-1 | 1 | 0 | 0 | 0 | 0 | 0 | 1 | 4 | .330 | .356 | .489 |
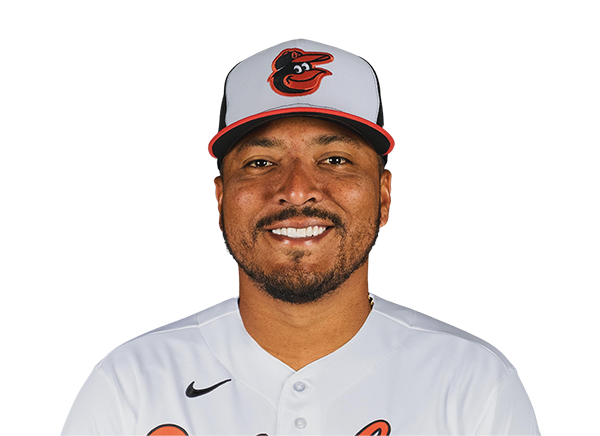 Chadwick Tromp |
1-1 | 1 | 0 | 1 | 0 | 0 | 0 | 0 | 4 | 1.000 | 1.000 | 1.000 |
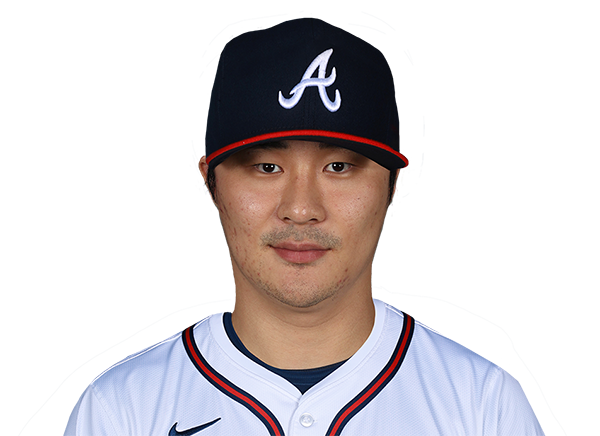 Ha-Seong Kim |
1-4 | 4 | 1 | 1 | 1 | 0 | 1 | 0 | 16 | .087 | .192 | .087 |
Miami Marlins
| Player | H-AB | AB | R | H | RBI | HR | BB | K | #P | AVG | OBP | SLG |
|---|---|---|---|---|---|---|---|---|---|---|---|---|
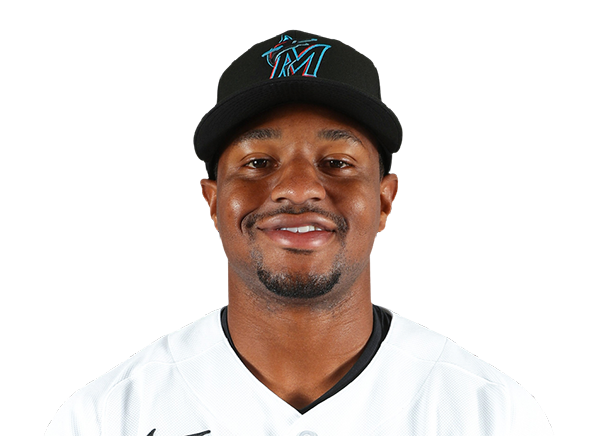 Xavier Edwards |
1-5 | 5 | 1 | 1 | 1 | 1 | 0 | 1 | 15 | .319 | .401 | .495 |
 Otto Lopez |
3-4 | 4 | 2 | 3 | 0 | 0 | 1 | 0 | 16 | .346 | .377 | .497 |
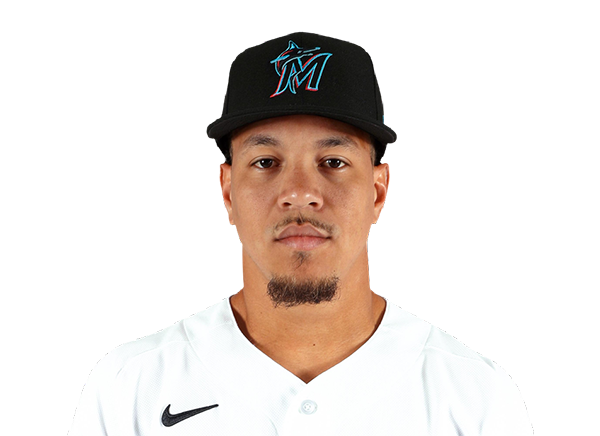 Heriberto Hernandez |
1-4 | 4 | 0 | 1 | 0 | 0 | 0 | 2 | 11 | .173 | .280 | .235 |
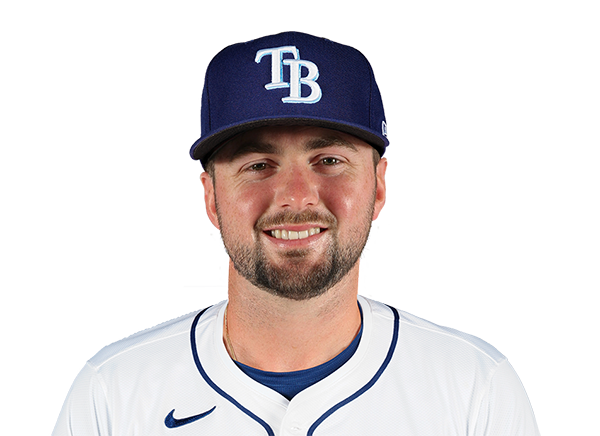 Liam Hicks |
1-1 | 1 | 0 | 1 | 0 | 0 | 0 | 0 | 2 | .293 | .357 | .500 |
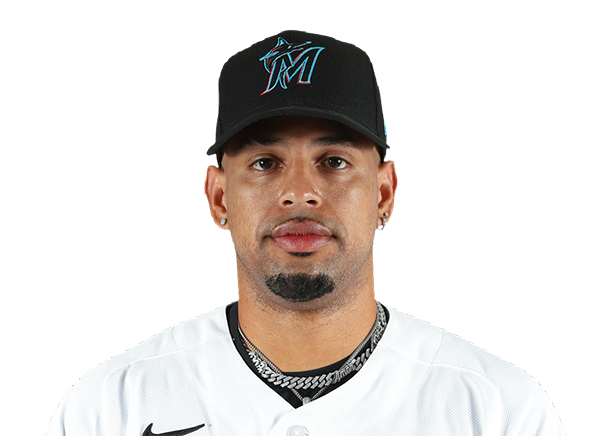 Christopher Morel |
1-4 | 4 | 0 | 1 | 0 | 0 | 0 | 3 | 18 | .152 | .204 | .196 |
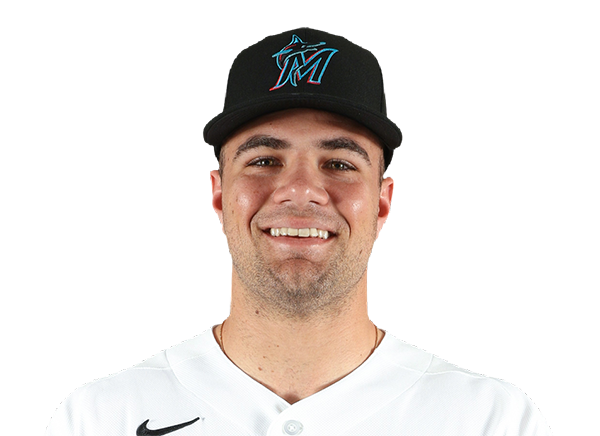 Jakob Marsee |
0-1 | 1 | 0 | 0 | 0 | 0 | 0 | 1 | 4 | .208 | .333 | .324 |
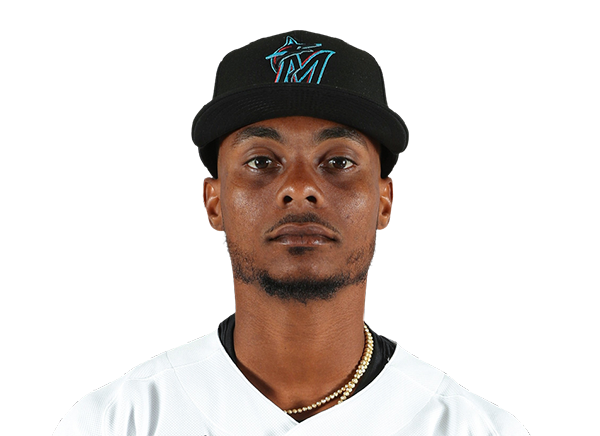 Esteury Ruiz |
0-2 | 2 | 1 | 0 | 1 | 0 | 1 | 1 | 17 | .200 | .219 | .467 |
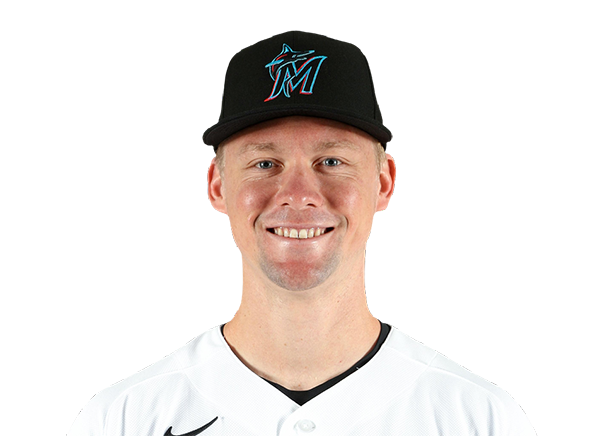 Kyle Stowers |
1-4 | 4 | 0 | 1 | 2 | 0 | 0 | 1 | 15 | .216 | .321 | .299 |
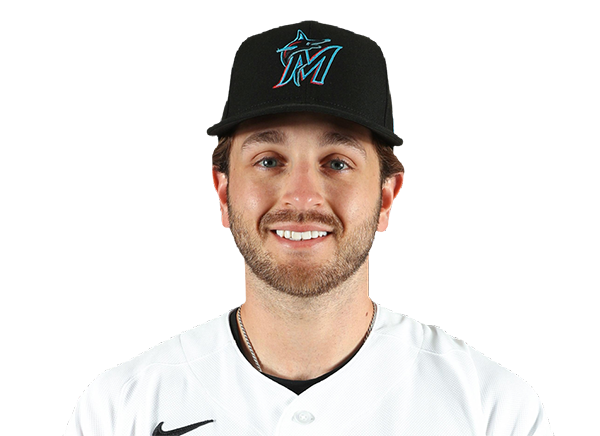 Connor Norby |
0-3 | 3 | 0 | 0 | 0 | 0 | 1 | 0 | 16 | .231 | .335 | .378 |
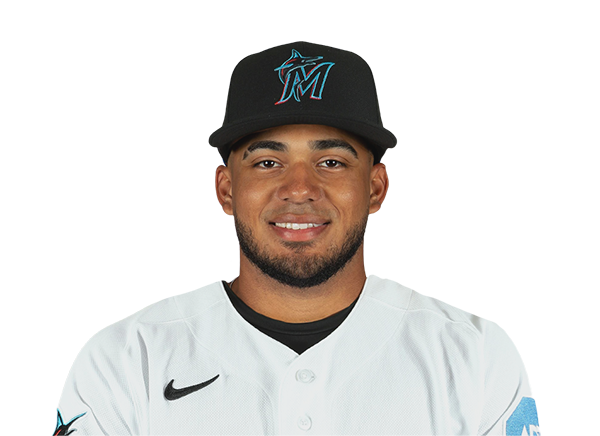 Leo Jimenez |
0-3 | 3 | 0 | 0 | 0 | 0 | 1 | 1 | 19 | .214 | .320 | .238 |
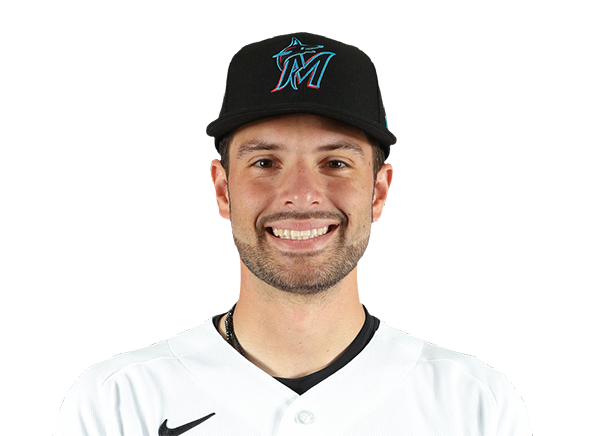 Joe Mack |
0-4 | 4 | 0 | 0 | 0 | 0 | 0 | 3 | 17 | .205 | .239 | .273 |
Atlanta Braves
| Player | IP | H | R | ER | BB | K | HR | PC-ST | ERA | PC |
|---|---|---|---|---|---|---|---|---|---|---|
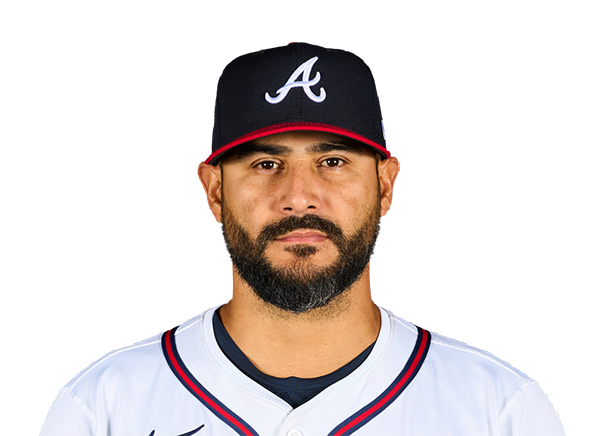 Martin Perez |
5.0 | 5 | 4 | 4 | 2 | 10 | 1 | 78-55 | 2.85 | 78 |
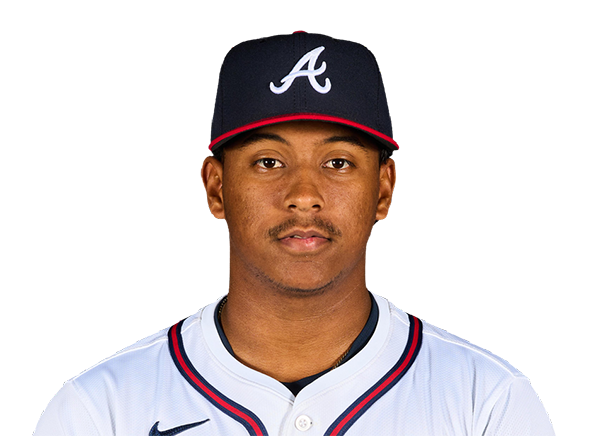 Didier Fuentes |
0.2 | 0 | 0 | 0 | 1 | 0 | 0 | 17-9 | 2.95 | 17 |
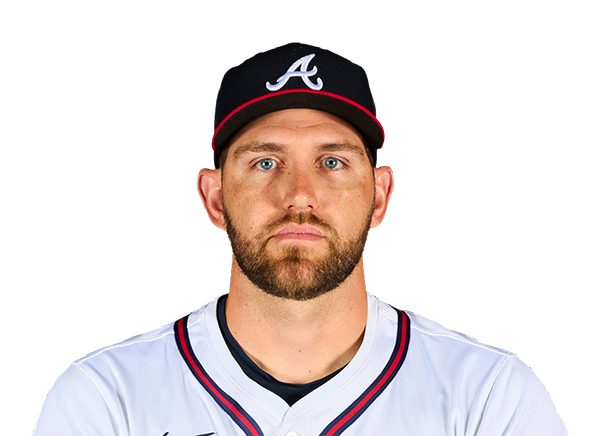 Dylan Lee |
1.1 | 2 | 0 | 0 | 0 | 2 | 0 | 25-15 | 0.79 | 25 |
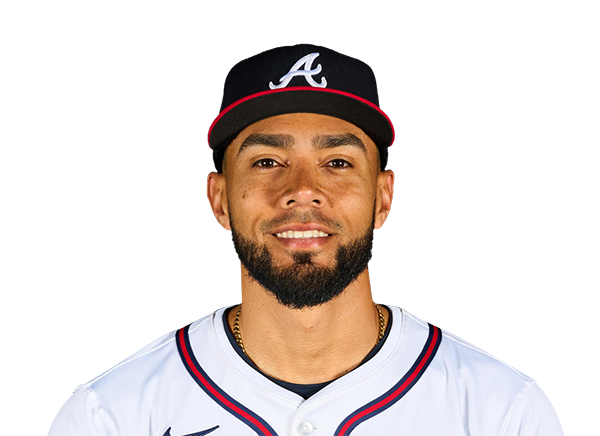 Robert Suarez |
1.0 | 0 | 0 | 0 | 1 | 0 | 0 | 17-10 | 0.44 | 17 |
 Raisel Iglesias |
1.0 | 1 | 0 | 0 | 0 | 1 | 0 | 13-10 | 0.00 | 13 |
Miami Marlins
| Player | IP | H | R | ER | BB | K | HR | PC-ST | ERA | PC |
|---|---|---|---|---|---|---|---|---|---|---|
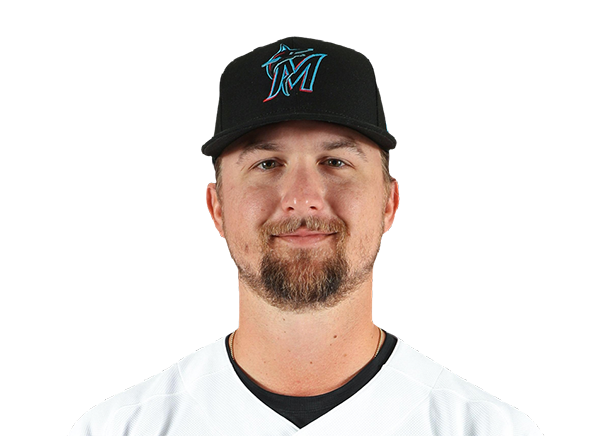 Braxton Garrett |
3.0 | 3 | 2 | 2 | 3 | 2 | 0 | 65-35 | 14.54 | 65 |
 Anthony Bender |
1.1 | 1 | 1 | 1 | 0 | 1 | 0 | 22-15 | 3.79 | 22 |
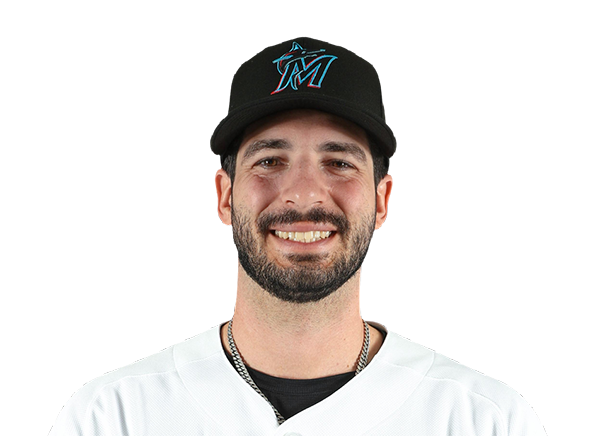 Andrew Nardi |
1.1 | 2 | 1 | 1 | 0 | 3 | 1 | 20-15 | 5.21 | 20 |
 Michael Petersen |
1.1 | 0 | 0 | 0 | 2 | 1 | 0 | 26-15 | 4.08 | 26 |
 Calvin Faucher |
0.2 | 2 | 3 | 3 | 3 | 2 | 0 | 33-19 | 4.19 | 33 |
 Lake Bachar |
1.1 | 2 | 1 | 1 | 0 | 2 | 0 | 24-13 | 2.84 | 24 |
H2H / Season Series
ATL11–3
MIA
ATL4–1
MIA
ATL4–2
MIA
MIA3–9
ATL
MIA1–9
ATL
MIA4–8
ATL
MIA12–0
ATL
ATL6–3
MIA
ATL6–5
MIA
ATL4–10
MIA
Last 5 Games
| Date | Opponent | Result |
|---|---|---|
| Aug 22 |  @ MIL | L1–4 |
| Aug 21 | @ MIL | L1–2 |
| Aug 20 |  @ CHW | W2–0 |
| Aug 19 |  @ MIN | L4–6 |
| Aug 18 | @ MIN | L1–4 |
| Date | Opponent | Result |
|---|---|---|
| Aug 22 |  vs WSH | W4–2 |
| Aug 21 | vs WSH | W3–2 |
| Aug 19 |  @ PHI | L1–4 |
| Aug 18 | @ PHI | L4–6 |
| Aug 17 | @ PHI | L5–6 |
Standings
American League
| Team | W | L | PCT | GB | DIFF | STRK |
|---|---|---|---|---|---|---|
1 Rays | 76 | 53 | .589 | - | +42 | L3 |
| 2White Sox | 67 | 62 | .519 | 9 | +42 | L1 |
3 Astros | 65 | 65 | .500 | 11.5 | -43 | L1 |
4 Yankees | 73 | 56 | .566 | 3 | +95 | L1 |
5 Red Sox | 70 | 59 | .543 | 6 | +98 | W2 |
6 Rangers | 64 | 66 | .492 | 12.5 | -48 | L1 |
7 Guardians | 64 | 66 | .492 | 12.5 | -14 | W3 |
8 Blue Jays | 64 | 67 | .489 | 13 | -50 | W1 |
| 9Twins | 63 | 67 | .485 | 13.5 | -47 | L2 |
10 Orioles | 63 | 67 | .485 | 13.5 | -33 | W2 |
11 Mariners | 62 | 68 | .477 | 14.5 | -44 | W2 |
12 Tigers | 61 | 68 | .473 | 15 | +77 | L4 |
13 Royals | 57 | 74 | .435 | 20 | -95 | W7 |
14 Angels | 52 | 78 | .400 | 24.5 | -68 | W1 |
15 Athletics | 50 | 80 | .385 | 26.5 | -188 | W1 |
National League
| Team | W | L | PCT | GB | DIFF | STRK |
|---|---|---|---|---|---|---|
| 1Brewers | 81 | 49 | .623 | - | +163 | W3 |
2 Dodgers | 79 | 51 | .608 | 2 | +147 | W5 |
| 3Braves | 75 | 55 | .577 | 6 | +108 | L2 |
4 Cubs | 74 | 56 | .569 | 7 | +98 | L3 |
| 5Phillies | 72 | 58 | .554 | 9 | +25 | W8 |
6 Padres | 70 | 60 | .538 | 11 | +9 | W2 |
7 Diamondbacks | 68 | 62 | .523 | 13 | +7 | L1 |
| 8Marlins | 66 | 64 | .508 | 15 | +17 | W2 |
9 Cardinals | 66 | 65 | .504 | 15.5 | 0 | L2 |
10 Pirates | 63 | 68 | .481 | 18.5 | +29 | L2 |
11 Reds | 62 | 68 | .477 | 19 | -92 | W1 |
| 12Nationals | 61 | 70 | .466 | 20.5 | +14 | L3 |
13 Mets | 59 | 71 | .454 | 22 | -39 | W1 |
14 Giants | 52 | 77 | .403 | 28.5 | -79 | L3 |
15 Rockies | 50 | 79 | .388 | 30.5 | -131 | L5 |
ATL
VS
MIA
Pitchers
Martin Perez
Didier Fuentes
Dylan Lee
Robert Suarez
Raisel Iglesias
Catchers
Sandy Leon
Chadwick Tromp
Infielders
Matt Olson
Ozzie Albies
Austin Riley
Ha-Seong Kim
Outfielders
Mauricio Dubon
Michael Harris II
Jose Azocar
Mike Yastrzemski
Designated Hitters
Ronald Acuna Jr.
Other Players
Dominic Smith
Pitchers
Braxton Garrett
Anthony Bender
Andrew Nardi
Michael Petersen
Calvin Faucher
Lake Bachar
Catchers
Joe Mack
Infielders
Xavier Edwards
Otto Lopez
Christopher Morel
Leo Jimenez
Outfielders
Heriberto Hernandez
Esteury Ruiz
Kyle Stowers
Designated Hitters
Connor Norby
Other Players
Liam Hicks
Jakob Marsee
Braves
VS
Marlins
Batting
129
Team Games Played
129
4363
At Bats
4283
1074
Hits
1068
584
Runs Batted In
540
167
Home Runs
131
63
Stolen Bases
131
.246
Batting Average
.249
609
Runs
563
206
Doubles
202
9
Triples
28
1799
Total Bases
1719
375
Walks
438
1046
Strikeouts
1053
.310
On Base Percentage
.326
.412
Slugging Percentage
.401
.723
OBP Pct + SLG Pct
.728
129
Games Played
129
129
Games Started
129
48
Hit By Pitch
69
0.0
Wins Above Replacement
0.0
0.0
Offensive Wins Above Replacement
0.0
21
Caught Stealing
42
1
Is Qualified
1
570.3
Runs Created
580.7
4.5
Runs Created Per 27 Outs
4.6
.078
Walks Per Plate Appearance
.090
0.36
Walk To Strikeout Ratio
0.42
.166
Isolated Power
.152
.262
Secondary Average
.275
3.88
Pitches Per Plate Appearance
3.81
382
Extra Base Hits
361
4833
Plate Appearances
4849
26.1
At Bats Per Home Run
32.7
7
Sacrifice Hit
19
37
Sacrifice Flies
39
Pitching
129
Team Games Played
129
49
Quality Starts
45
75
Wins
65
54
Losses
64
39
Saves
29
92
Holds
69
983
Hits
989
462
Earned runs
495
145
Home Runs
129
439
Walks
429
1101
Strikeouts
1062
8.7
Strikeouts Per 9 Innings
8.5
144.4
Pitches Per Start
143.3
1.24
Walks Plus Hits Per Inning Pitched
1.25
3.63
Earned Run Average
3.94
54
Losses
64
1145.0
Innings pitched
1130.0
.581
Win Percentage
.504
56
Save Opportunities
46
.230
Opponent Batting Average
.233
.307
Opponent's On-base pct.
.311
.378
Opponent's Slugging pct.
.376
.685
Opponent's OPB Pct + SLG Pct
.686
4270
At Bats
4249
162
Doubles
182
17
Triples
19
45
Batters Hit
64
95
Stolen Bases
109
129
Games Played
129
0
Complete Games
1
8
Shutouts
12
26
Wild Pitches
37
478
Runs Batted In
519
4
Balks
4
1145.0
Innings pitched
1130.0
8.7
Strikeouts Per 9 Innings
8.5
17
Caught Stealing
33
129
Games Started
129
0.0
Wins Above Replacement
0.0
1
Is Qualified
1
498
Runs
548
462
Earned Runs
495
1614
Total Bases
1596
Fielding
129
Team Games Played
129
1145
Full Innings
1130
4538
Total Chances
4538
3435
Putouts
3390
1045
Assists
1066
58
Errors
82
206
Double Plays
202
0.987
Fielding Percentage
0.982
35.2
Range Factor
35.5
0.0
Zone Rating
0.0
129
Games Played
129
0
Games Started
0
0.0
Defensive Wins Above Replacement
0.0
1
Qualified
1