

Braves vs Phillies Live Score (6 Sep, 2026)
Game Information
Stage
STD
Season
2026
First Pitch
Sun, Sep 6, 1:10 pm
Venue
Citizens Bank Park
Location
Philadelphia, Pennsylvania
Venue Type
Outdoor
Broadcast
NBC
Attendance
42,793
Live Situation
0Balls
3Strikes
0Outs
—Pitcher
—At Bat
Pitch Sequence
1
STRIKE SWINGING
Sinker
94 MPH
2
STRIKE SWINGING
Changeup
88 MPH
3
STRIKE SWINGING
Changeup
88 MPH
Injury Report

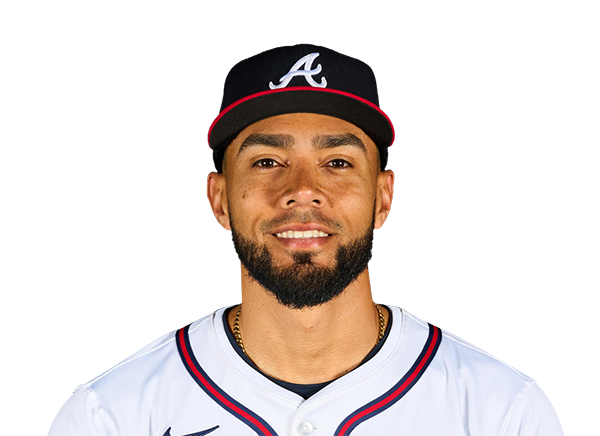
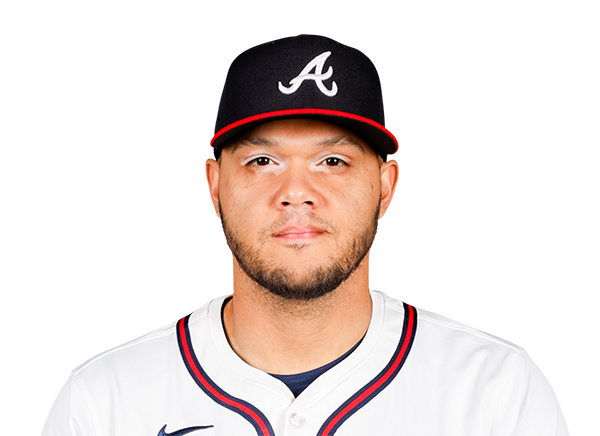
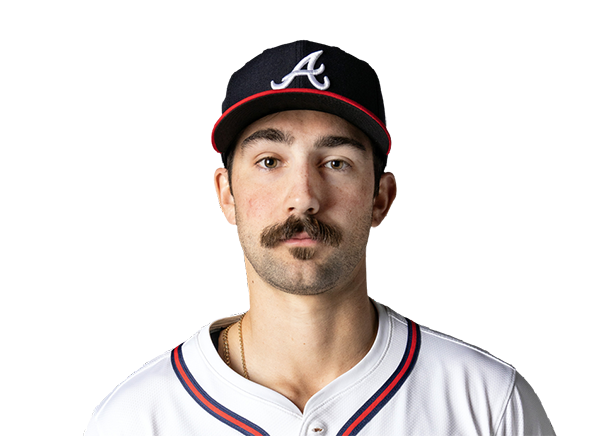
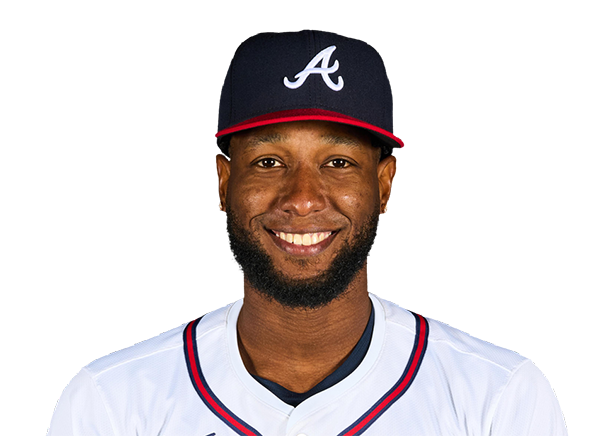




Team Stats
 ATL
PHI


5
Runs
4
10
Hits
7
1
Errors
0
1
Home Runs
2
1
Walks
1
7
Strikeouts
6
Player Box Score
Atlanta Braves
| Player | H-AB | AB | R | H | RBI | HR | BB | K | #P | AVG | OBP | SLG |
|---|---|---|---|---|---|---|---|---|---|---|---|---|
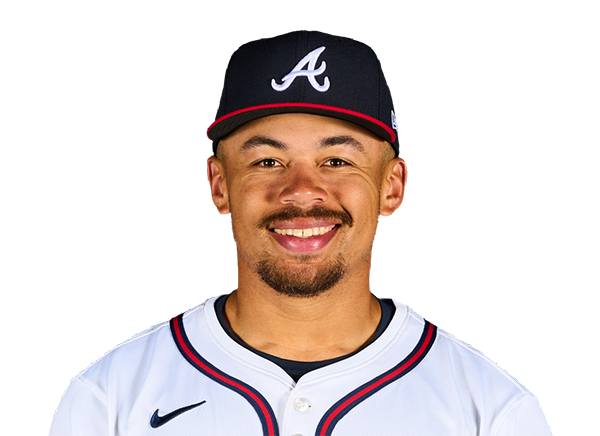 Drake Baldwin | 2-5 | 5 | 1 | 2 | 0 | 0 | 0 | 2 | 15 | .278 | .355 | .451 |
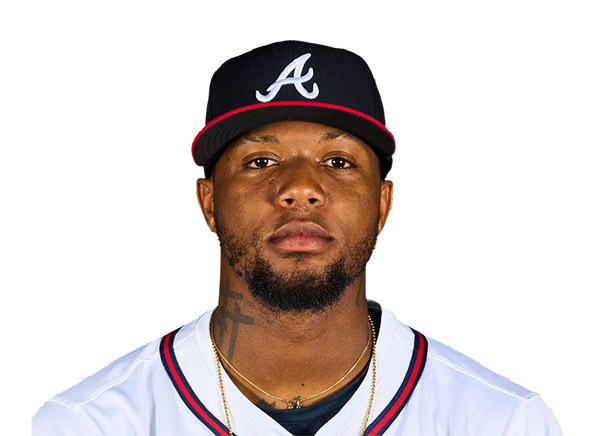 Ronald Acuna Jr. | 2-3 | 3 | 1 | 2 | 4 | 1 | 0 | 0 | 14 | .255 | .351 | .446 |
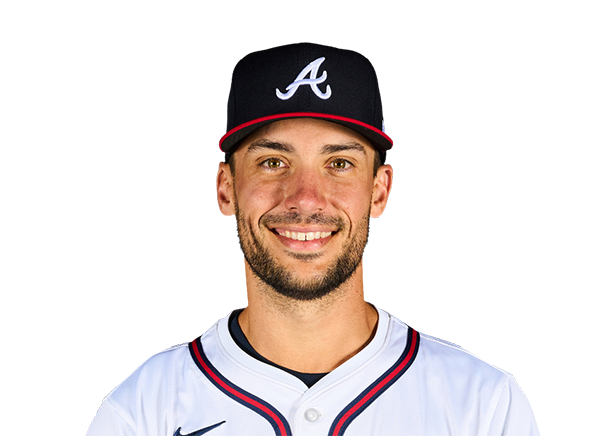 Matt Olson | 0-4 | 4 | 0 | 0 | 0 | 0 | 0 | 1 | 14 | .249 | .324 | .508 |
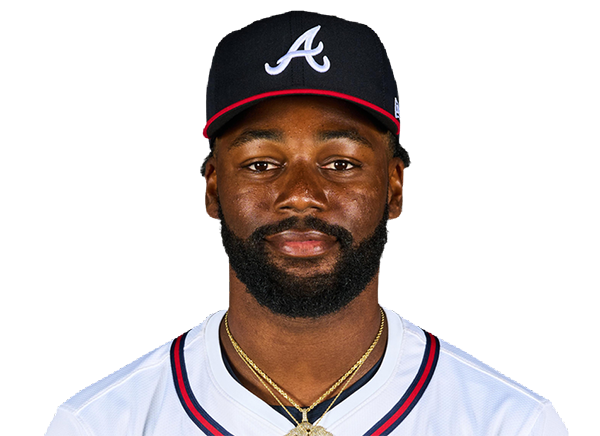 Michael Harris II | 1-4 | 4 | 0 | 1 | 0 | 0 | 0 | 0 | 11 | .291 | .318 | .495 |
 Mauricio Dubon | 2-4 | 4 | 0 | 2 | 0 | 0 | 0 | 0 | 13 | .267 | .311 | .390 |
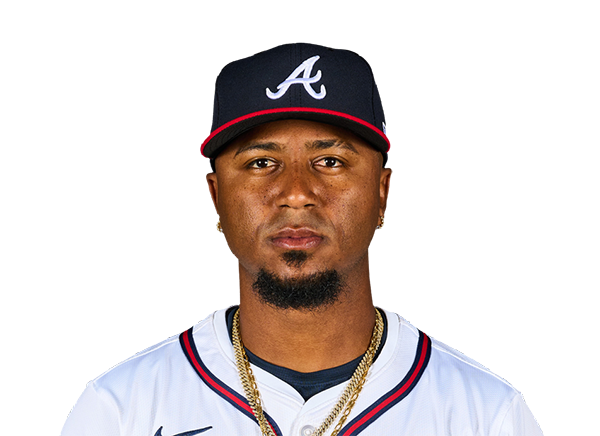 Ozzie Albies | 1-4 | 4 | 1 | 1 | 0 | 0 | 0 | 0 | 9 | .252 | .307 | .414 |
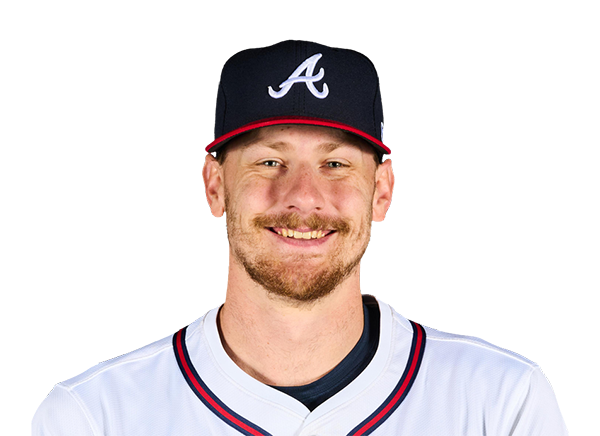 Sean Murphy | 0-4 | 4 | 0 | 0 | 0 | 0 | 0 | 2 | 11 | .221 | .284 | .397 |
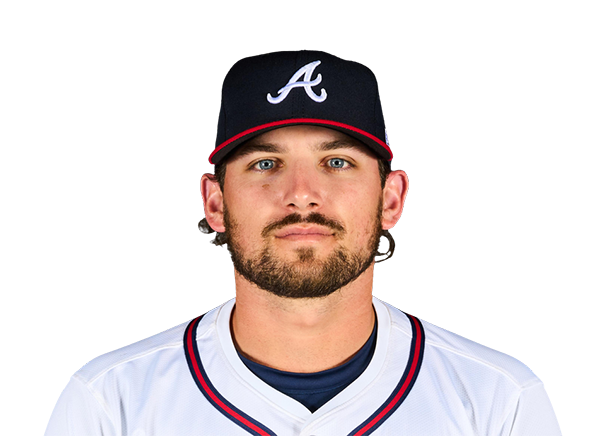 Austin Riley | 1-4 | 4 | 0 | 1 | 1 | 0 | 0 | 0 | 15 | .224 | .294 | .368 |
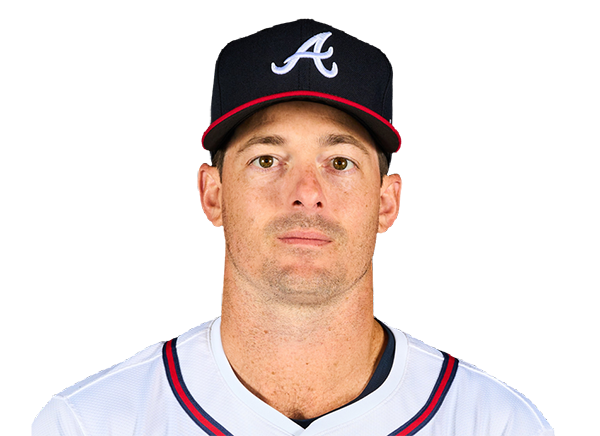 Mike Yastrzemski | 1-3 | 3 | 2 | 1 | 0 | 0 | 1 | 2 | 26 | .226 | .312 | .373 |
Philadelphia Phillies
| Player | H-AB | AB | R | H | RBI | HR | BB | K | #P | AVG | OBP | SLG |
|---|---|---|---|---|---|---|---|---|---|---|---|---|
 Kyle Schwarber | 1-3 | 3 | 2 | 1 | 1 | 1 | 1 | 0 | 15 | .241 | .357 | .524 |
 Trea Turner | 1-4 | 4 | 1 | 1 | 0 | 0 | 0 | 0 | 16 | .239 | .293 | .377 |
 Bryce Harper | 0-4 | 4 | 0 | 0 | 0 | 0 | 0 | 3 | 16 | .272 | .390 | .501 |
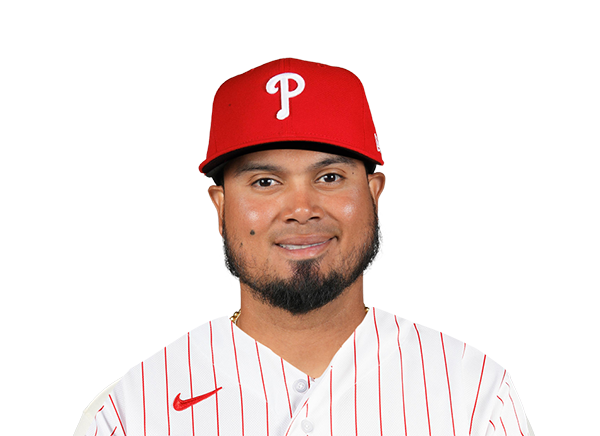 Luis Arraez | 1-3 | 3 | 0 | 1 | 1 | 0 | 0 | 0 | 20 | .318 | .349 | .431 |
 Alec Bohm | 1-4 | 4 | 0 | 1 | 1 | 0 | 0 | 1 | 22 | .247 | .308 | .390 |
 Bryson Stott | 1-4 | 4 | 0 | 1 | 0 | 0 | 0 | 0 | 13 | .253 | .328 | .399 |
 Brandon Marsh | 0-2 | 2 | 0 | 0 | 0 | 0 | 0 | 0 | 5 | .267 | .313 | .419 |
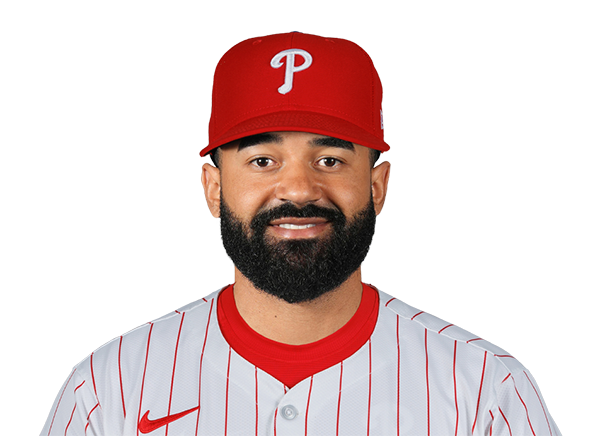 Derek Hill | 1-2 | 2 | 1 | 1 | 1 | 1 | 0 | 0 | 3 | .249 | .298 | .443 |
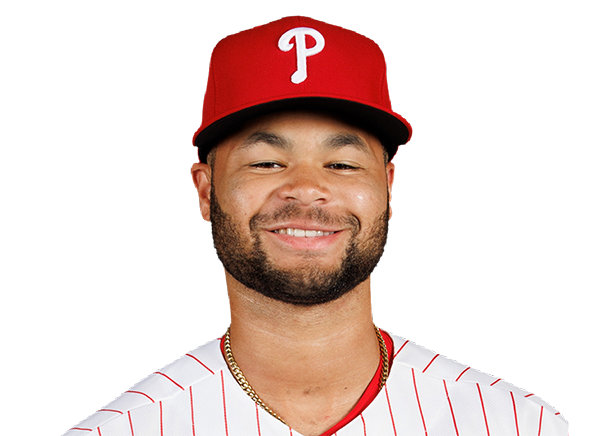 Justin Crawford | 0-2 | 2 | 0 | 0 | 0 | 0 | 0 | 0 | 8 | .264 | .313 | .347 |
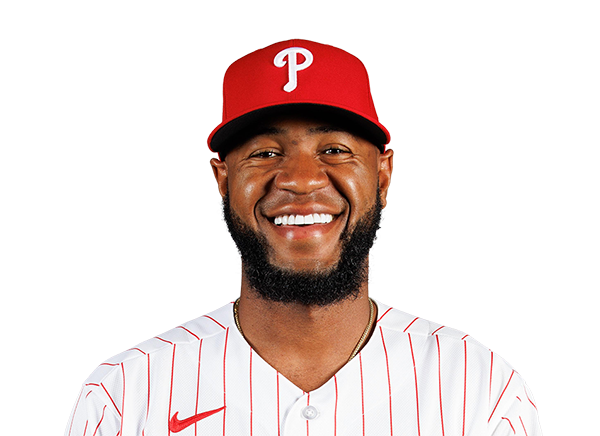 Bryan De La Cruz | 0-2 | 2 | 0 | 0 | 0 | 0 | 0 | 0 | 13 | .321 | .356 | .491 |
 Garrett Stubbs | 1-3 | 3 | 0 | 1 | 0 | 0 | 0 | 1 | 8 | .167 | .220 | .167 |
 Edmundo Sosa | 0-1 | 1 | 0 | 0 | 0 | 0 | 0 | 1 | 3 | .233 | .274 | .390 |
Atlanta Braves
| Player | IP | H | R | ER | BB | K | HR | PC-ST | ERA | PC |
|---|---|---|---|---|---|---|---|---|---|---|
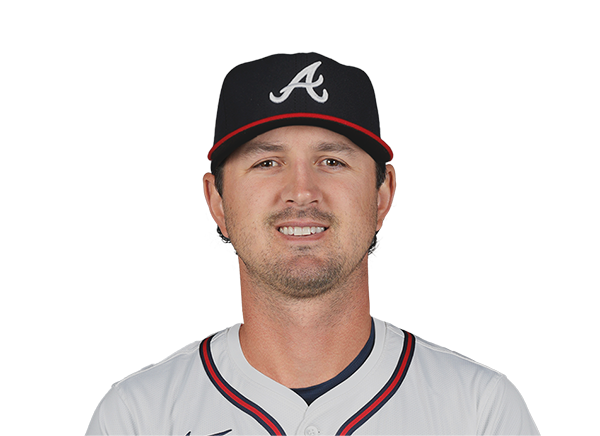 Tyler Mahle | 6.0 | 4 | 2 | 0 | 1 | 3 | 0 | 94-61 | 4.05 | 94 |
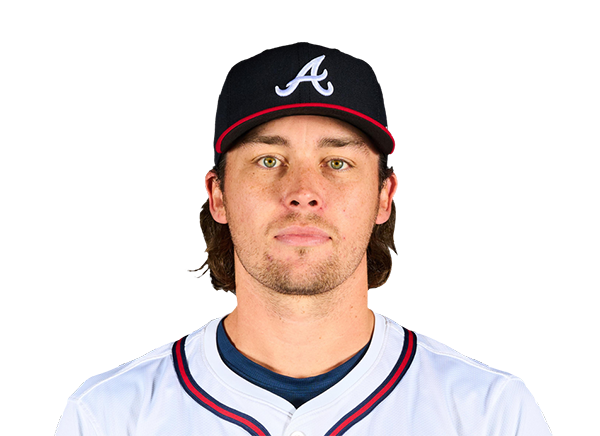 Dylan Dodd | 1.0 | 2 | 2 | 2 | 0 | 1 | 2 | 22-16 | 2.38 | 22 |
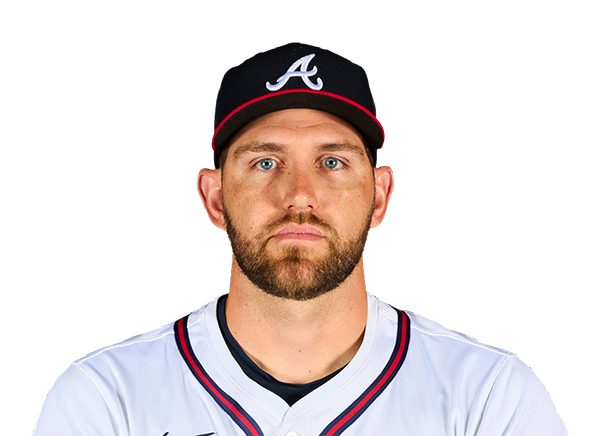 Dylan Lee | 1.0 | 0 | 0 | 0 | 0 | 1 | 0 | 13-9 | 2.61 | 13 |
 Raisel Iglesias | 1.0 | 1 | 0 | 0 | 0 | 1 | 0 | 13-10 | 2.72 | 13 |
Philadelphia Phillies
| Player | IP | H | R | ER | BB | K | HR | PC-ST | ERA | PC |
|---|---|---|---|---|---|---|---|---|---|---|
 Aaron Nola | 7.0 | 4 | 1 | 1 | 1 | 5 | 0 | 93-65 | 4.76 | 93 |
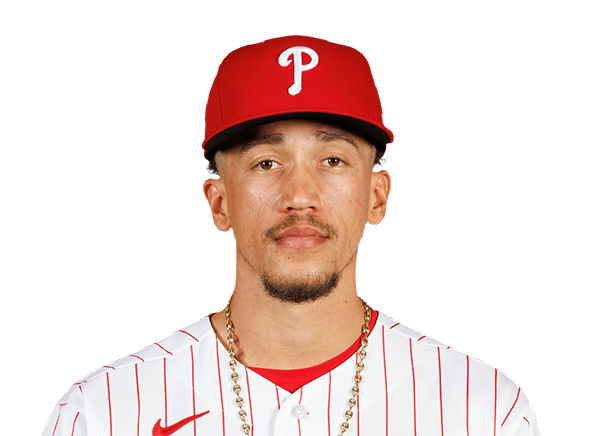 Alex McFarlane | 0.1 | 3 | 3 | 3 | 0 | 0 | 1 | 13-10 | 3.09 | 13 |
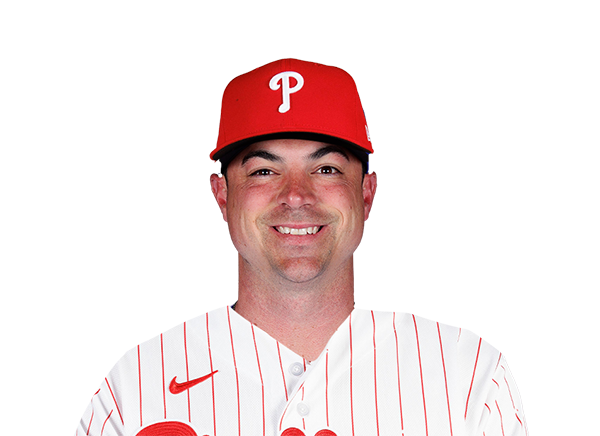 Brooks Raley | 0.2 | 1 | 0 | 0 | 0 | 0 | 0 | 9-7 | 2.17 | 9 |
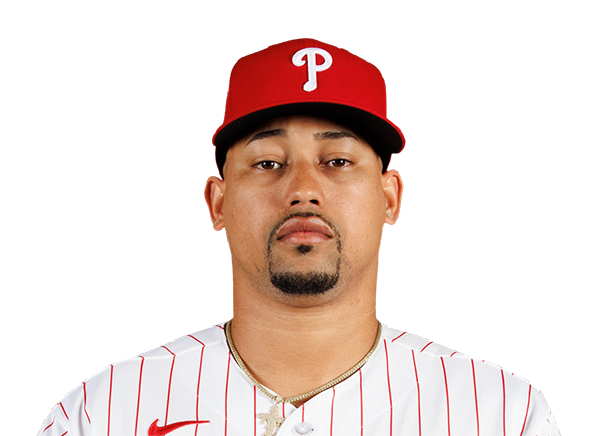 Jhoan Duran | 1.0 | 2 | 1 | 1 | 0 | 2 | 0 | 13-11 | 1.72 | 13 |
H2H / Season Series
PHI4–5
ATL
PHI4–2
ATL
PHI2–5
ATL
ATL6–2
PHI
ATL5–8
PHI
ATL5–3
PHI
PHI2–4
ATL
PHI1–3
ATL
PHI0–9
ATL
ATL3–2
PHI
Last 5 Games
| Date | Opponent | Result |
|---|---|---|
| Sep 6 | @ PHI | W5–4 |
| Sep 5 | @ PHI | L2–4 |
| Sep 4 | @ PHI | W5–2 |
| Sep 2 |  @ WSH | W9–0 |
| Sep 1 | @ WSH | L5–9 |
| Date | Opponent | Result |
|---|---|---|
| Sep 6 | vs ATL | L4–5 |
| Sep 5 | vs ATL | W4–2 |
| Sep 4 | vs ATL | L2–5 |
| Sep 2 |  @ ARI | L0–1 |
| Sep 1 | @ ARI | W7–1 |
Standings
American League
| Team | W | L | PCT | GB | DIFF | STRK |
|---|---|---|---|---|---|---|
1 Rays | 85 | 58 | .594 | - | +47 | L1 |
2 White Sox | 75 | 68 | .524 | 10 | +49 | W1 |
3 Astros | 73 | 71 | .507 | 12.5 | -38 | L2 |
4 Yankees | 81 | 62 | .566 | 4 | +117 | L1 |
5 Red Sox | 79 | 65 | .549 | 6.5 | +86 | W4 |
6 Guardians | 73 | 71 | .507 | 12.5 | -14 | W1 |
7 Blue Jays | 72 | 72 | .500 | 13.5 | -38 | L1 |
8 Rangers | 71 | 73 | .493 | 14.5 | -44 | W1 |
9 Orioles | 69 | 75 | .479 | 16.5 | -29 | L6 |
10 Twins | 68 | 75 | .476 | 17 | -48 | L1 |
11 Mariners | 67 | 77 | .465 | 18.5 | -71 | W1 |
12 Tigers | 65 | 78 | .455 | 20 | +50 | L1 |
13 Royals | 64 | 80 | .444 | 21.5 | -88 | W1 |
14 Athletics | 57 | 87 | .396 | 28.5 | -188 | L1 |
15 Angels | 54 | 89 | .378 | 31 | -77 | L1 |
National League
| Team | W | L | PCT | GB | DIFF | STRK |
|---|---|---|---|---|---|---|
1 Brewers | 88 | 56 | .611 | - | +168 | L2 |
2 Dodgers | 85 | 57 | .599 | 2 | +150 | W3 |
| 3Braves | 85 | 58 | .594 | 2.5 | +120 | W1 |
4 Cubs | 81 | 63 | .563 | 7 | +132 | L1 |
| 5Phillies | 80 | 63 | .559 | 7.5 | +34 | L1 |
| 6Diamondbacks | 76 | 68 | .528 | 12 | -1 | W2 |
7 Padres | 75 | 68 | .524 | 12.5 | +8 | W1 |
8 Marlins | 72 | 72 | .500 | 16 | +15 | W1 |
9 Cardinals | 72 | 72 | .500 | 16 | -9 | W1 |
10 Pirates | 71 | 73 | .493 | 17 | +26 | W1 |
11 Reds | 69 | 74 | .483 | 18.5 | -105 | W2 |
| 12Nationals | 67 | 77 | .465 | 21 | +11 | L3 |
13 Mets | 65 | 78 | .455 | 22.5 | -48 | W1 |
14 Giants | 59 | 85 | .410 | 29 | -75 | L1 |
15 Rockies | 55 | 88 | .385 | 32.5 | -140 | L1 |
ATL
VS
PHI
Pitchers
Tyler Mahle
Catchers
Sean Murphy
Infielders
Matt Olson
Mauricio Dubon
Ozzie Albies
Austin Riley
Outfielders
Ronald Acuna Jr.
Michael Harris II
Mike Yastrzemski
Designated Hitters
Drake Baldwin
Pitchers
Aaron Nola
Catchers
Garrett Stubbs
Infielders
Trea Turner
Luis Arraez
Alec Bohm
Bryson Stott
Outfielders
Bryce Harper
Brandon Marsh
Justin Crawford
Designated Hitters
Kyle Schwarber
Braves
VS
Phillies
Batting
143
Team Games Played
143
4834
At Bats
4795
1200
Hits
1161
638
Runs Batted In
621
182
Home Runs
169
76
Stolen Bases
97
.248
Batting Average
.242
665
Runs
641
231
Doubles
207
10
Triples
22
1997
Total Bases
1919
414
Walks
457
1165
Strikeouts
1183
.312
On Base Percentage
.312
.413
Slugging Percentage
.400
.725
OBP Pct + SLG Pct
.713
143
Games Played
143
143
Games Started
143
50
Hit By Pitch
55
0.0
Wins Above Replacement
0.0
0.0
Offensive Wins Above Replacement
0.0
22
Caught Stealing
18
1
Is Qualified
1
634.7
Runs Created
613.9
4.5
Runs Created Per 27 Outs
4.4
.077
Walks Per Plate Appearance
.085
0.36
Walk To Strikeout Ratio
0.39
.165
Isolated Power
.158
.262
Secondary Average
.270
3.89
Pitches Per Plate Appearance
3.90
423
Extra Base Hits
398
5350
Plate Appearances
5371
26.6
At Bats Per Home Run
28.4
9
Sacrifice Hit
11
40
Sacrifice Flies
50
Pitching
143
Team Games Played
143
54
Quality Starts
66
85
Wins
80
58
Losses
63
45
Saves
39
100
Holds
66
1101
Hits
1192
503
Earned runs
563
156
Home Runs
167
480
Walks
430
1209
Strikeouts
1399
8.6
Strikeouts Per 9 Innings
9.9
144.2
Pitches Per Start
148.7
1.25
Walks Plus Hits Per Inning Pitched
1.28
3.57
Earned Run Average
3.99
58
Losses
63
1269.0
Innings pitched
1269.2
.594
Win Percentage
.559
64
Save Opportunities
58
.232
Opponent Batting Average
.245
.307
Opponent's On-base pct.
.313
.377
Opponent's Slugging pct.
.399
.685
Opponent's OPB Pct + SLG Pct
.712
4744
At Bats
4857
181
Doubles
196
20
Triples
24
52
Batters Hit
62
101
Stolen Bases
83
143
Games Played
143
1
Complete Games
1
10
Shutouts
16
28
Wild Pitches
37
524
Runs Batted In
576
4
Balks
3
1269.0
Innings pitched
1269.2
8.6
Strikeouts Per 9 Innings
9.9
17
Caught Stealing
35
143
Games Started
143
0.0
Wins Above Replacement
0.0
1
Is Qualified
1
545
Runs
607
503
Earned Runs
563
1790
Total Bases
1937
Fielding
143
Team Games Played
143
1269
Full Innings
1270
5034
Total Chances
5059
3807
Putouts
3809
1165
Assists
1179
62
Errors
71
231
Double Plays
207
0.988
Fielding Percentage
0.986
35.3
Range Factor
35.4
0.0
Zone Rating
0.0
143
Games Played
143
0
Games Started
0
0.0
Defensive Wins Above Replacement
0.0
1
Qualified
1