

Braves vs Phillies Live Score (7 Sep, 2026)
Game Information
Stage
STD
Season
2026
First Pitch
Mon, Sep 7, 1:05 pm
Venue
Citizens Bank Park
Location
Philadelphia, Pennsylvania
Venue Type
Outdoor
Broadcast
MLB.TV
Attendance
41,820
Live Situation
0Balls
0Strikes
0Outs
—Pitcher
—At Bat
Pitch Sequence
1
BALL IN PLAY
Changeup
87 MPH
Injury Report

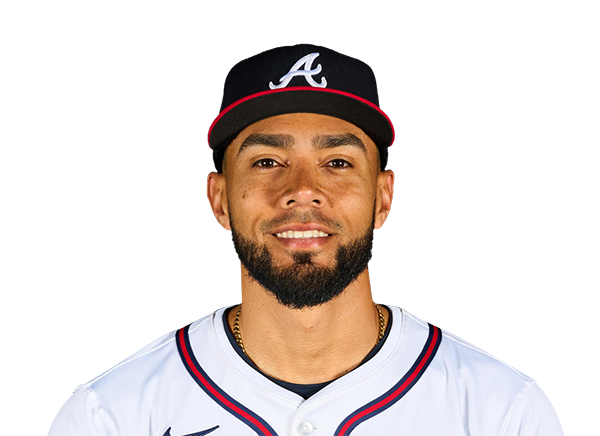
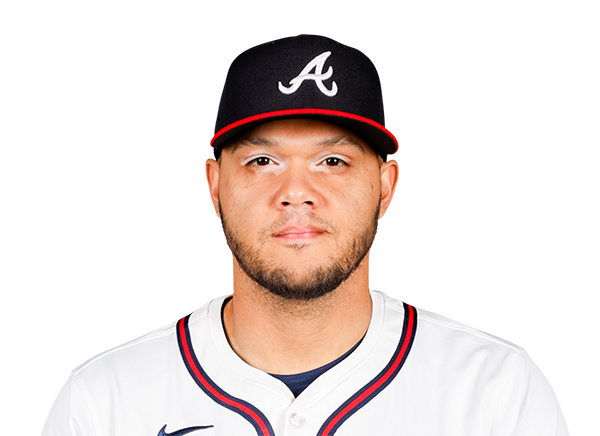
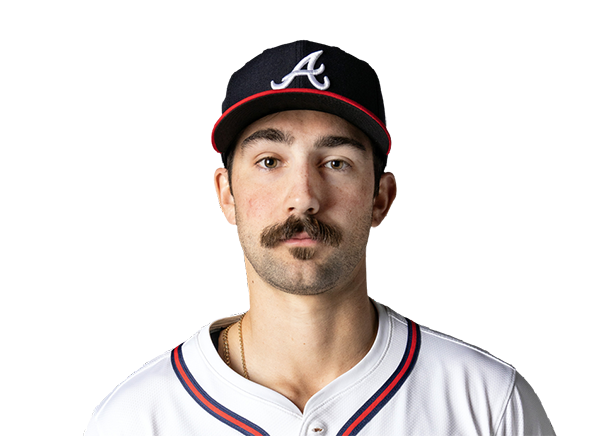
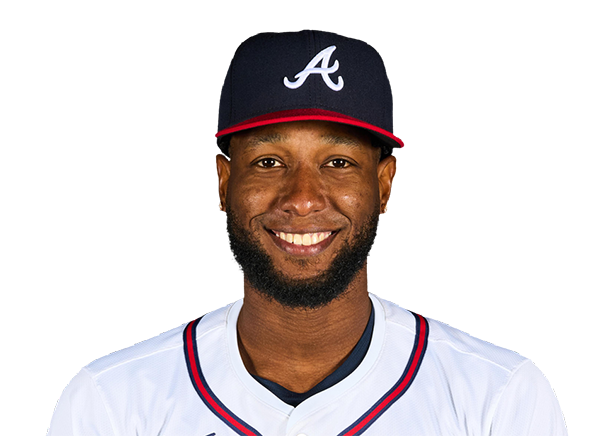





Team Stats
 ATL
PHI

0
Runs
1
2
Hits
4
0
Errors
0
0
Home Runs
1
1
Walks
2
12
Strikeouts
10
Player Box Score
Atlanta Braves
| Player | H-AB | AB | R | H | RBI | HR | BB | K | #P | AVG | OBP | SLG |
|---|---|---|---|---|---|---|---|---|---|---|---|---|
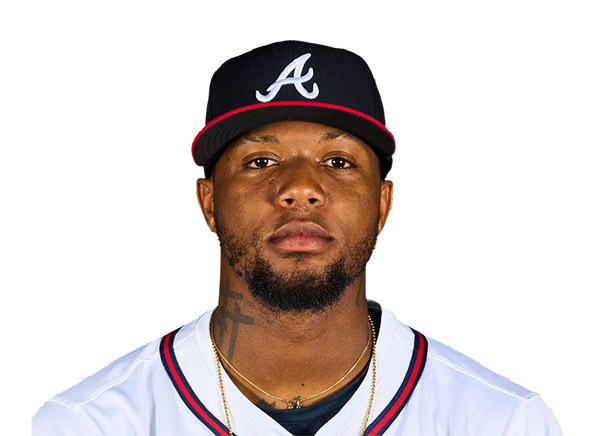 Ronald Acuna Jr. |
0-3 | 3 | 0 | 0 | 0 | 0 | 1 | 1 | 11 | .253 | .350 | .442 |
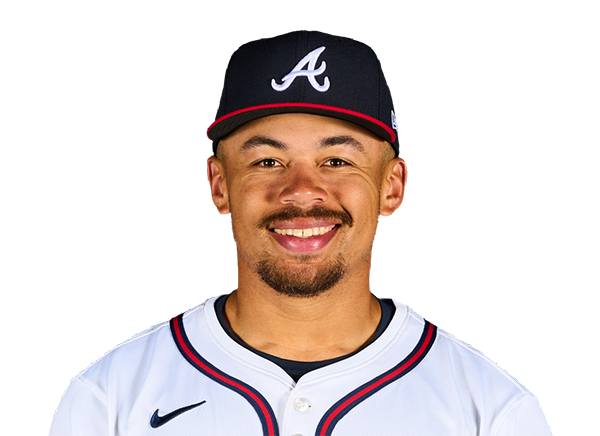 Drake Baldwin |
0-4 | 4 | 0 | 0 | 0 | 0 | 0 | 2 | 20 | .276 | .353 | .448 |
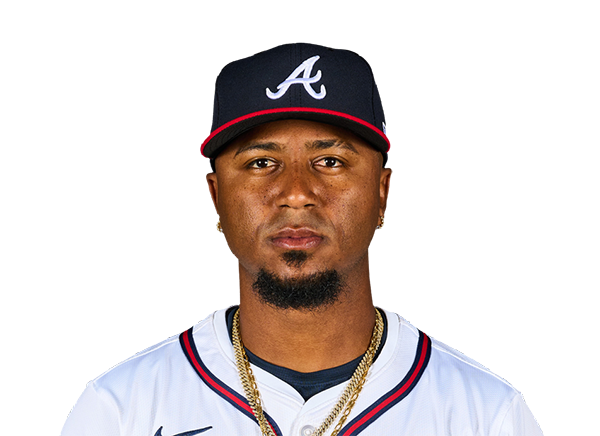 Ozzie Albies |
0-4 | 4 | 0 | 0 | 0 | 0 | 0 | 1 | 12 | .250 | .305 | .411 |
 Matt Olson |
1-3 | 3 | 0 | 1 | 0 | 0 | 0 | 1 | 9 | .249 | .324 | .507 |
 Lane Thomas |
0-3 | 3 | 0 | 0 | 0 | 0 | 0 | 2 | 12 | .224 | .318 | .383 |
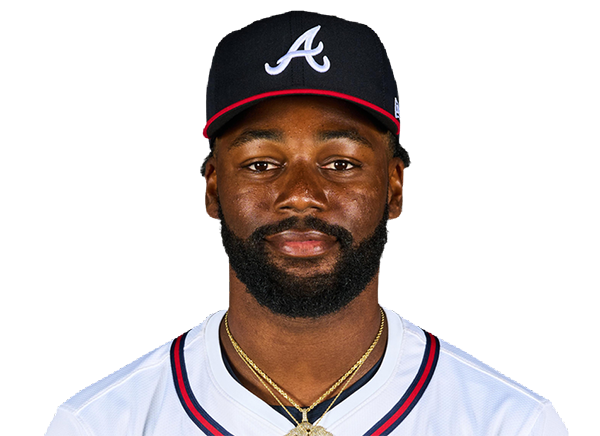 Michael Harris II |
1-3 | 3 | 0 | 1 | 0 | 0 | 0 | 1 | 10 | .291 | .318 | .494 |
 Mauricio Dubon |
0-3 | 3 | 0 | 0 | 0 | 0 | 0 | 0 | 8 | .266 | .309 | .388 |
 Austin Riley |
0-2 | 2 | 0 | 0 | 0 | 0 | 0 | 2 | 11 | .223 | .294 | .367 |
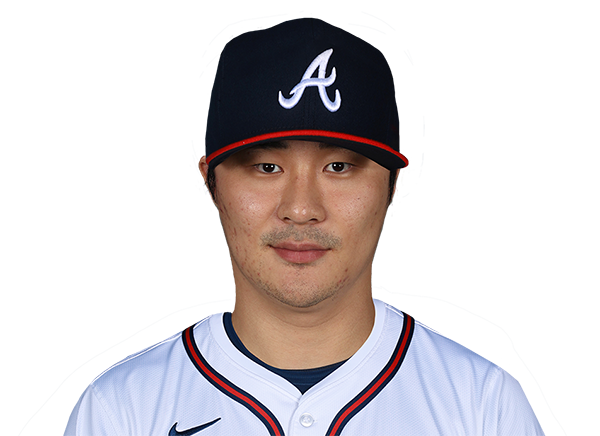 Ha-Seong Kim |
0-3 | 3 | 0 | 0 | 0 | 0 | 0 | 2 | 16 | .110 | .198 | .120 |
Philadelphia Phillies
| Player | H-AB | AB | R | H | RBI | HR | BB | K | #P | AVG | OBP | SLG |
|---|---|---|---|---|---|---|---|---|---|---|---|---|
 Kyle Schwarber |
2-4 | 4 | 1 | 2 | 1 | 1 | 0 | 1 | 18 | .243 | .358 | .530 |
 Trea Turner |
1-4 | 4 | 0 | 1 | 0 | 0 | 0 | 1 | 12 | .240 | .292 | .378 |
 Bryce Harper |
0-2 | 2 | 0 | 0 | 0 | 0 | 1 | 1 | 13 | .271 | .389 | .499 |
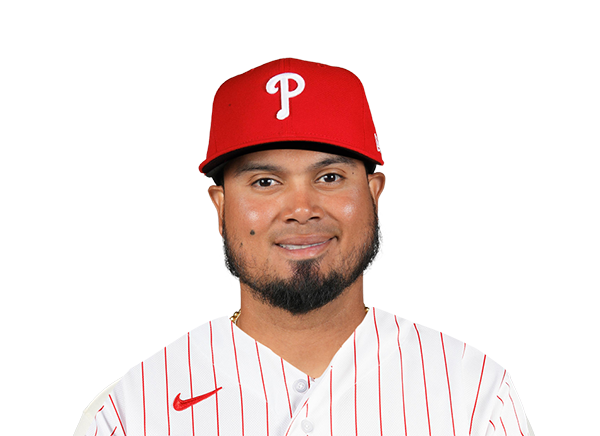 Luis Arraez |
0-3 | 3 | 0 | 0 | 0 | 0 | 0 | 1 | 13 | .316 | .347 | .429 |
 Alec Bohm |
0-2 | 2 | 0 | 0 | 0 | 0 | 1 | 1 | 15 | .246 | .308 | .388 |
 Bryson Stott |
0-3 | 3 | 0 | 0 | 0 | 0 | 0 | 1 | 10 | .252 | .326 | .396 |
 Brandon Marsh |
1-3 | 3 | 0 | 1 | 0 | 0 | 0 | 0 | 10 | .267 | .313 | .418 |
 J.T. Realmuto |
0-3 | 3 | 0 | 0 | 0 | 0 | 0 | 3 | 16 | .217 | .293 | .348 |
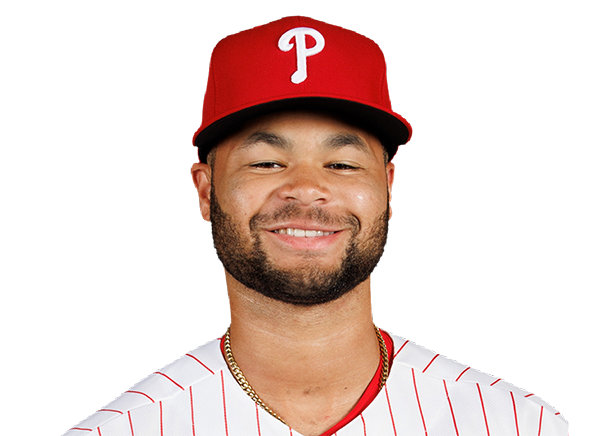 Justin Crawford |
0-3 | 3 | 0 | 0 | 0 | 0 | 0 | 1 | 11 | .262 | .311 | .344 |
Atlanta Braves
| Player | IP | H | R | ER | BB | K | HR | PC-ST | ERA | PC |
|---|---|---|---|---|---|---|---|---|---|---|
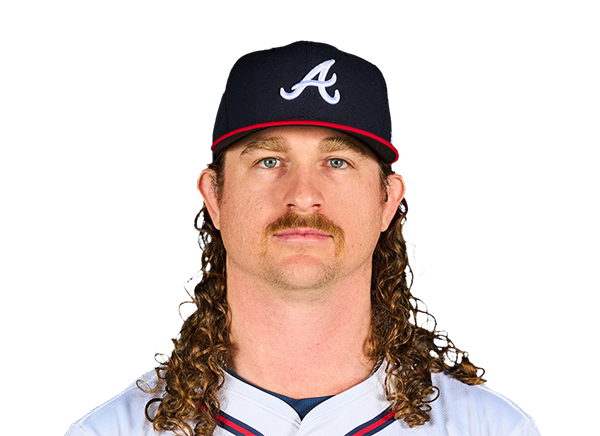 Grant Holmes |
6.0 | 3 | 0 | 0 | 2 | 6 | 0 | 89-56 | 3.46 | 89 |
 Didier Fuentes |
2.0 | 1 | 1 | 1 | 0 | 4 | 1 | 29-20 | 2.34 | 29 |
Philadelphia Phillies
| Player | IP | H | R | ER | BB | K | HR | PC-ST | ERA | PC |
|---|---|---|---|---|---|---|---|---|---|---|
 Jesus Luzardo |
9.0 | 2 | 0 | 0 | 1 | 12 | 0 | 109-78 | 2.87 | 109 |
H2H / Season Series
PHI1–0
ATL
PHI4–5
ATL
PHI4–2
ATL
PHI2–5
ATL
ATL6–2
PHI
ATL5–8
PHI
ATL5–3
PHI
PHI2–4
ATL
PHI1–3
ATL
PHI0–9
ATL
Last 5 Games
| Date | Opponent | Result |
|---|---|---|
| Sep 7 | @ PHI | L0–1 |
| Sep 6 | @ PHI | W5–4 |
| Sep 5 | @ PHI | L2–4 |
| Sep 4 | @ PHI | W5–2 |
| Sep 2 |  @ WSH | W9–0 |
| Date | Opponent | Result |
|---|---|---|
| Sep 7 | vs ATL | W1–0 |
| Sep 6 | vs ATL | L4–5 |
| Sep 5 | vs ATL | W4–2 |
| Sep 4 | vs ATL | L2–5 |
| Sep 2 |  @ ARI | L0–1 |
Standings
American League
| Team | W | L | PCT | GB | DIFF | STRK |
|---|---|---|---|---|---|---|
1 Rays | 85 | 58 | .594 | - | +47 | L1 |
2 White Sox | 75 | 68 | .524 | 10 | +49 | W1 |
3 Astros | 73 | 71 | .507 | 12.5 | -38 | L2 |
4 Yankees | 81 | 62 | .566 | 4 | +117 | L1 |
5 Red Sox | 80 | 65 | .552 | 6 | +89 | W5 |
6 Guardians | 73 | 72 | .503 | 13 | -16 | L1 |
7 Blue Jays | 72 | 72 | .500 | 13.5 | -38 | L1 |
8 Rangers | 71 | 73 | .493 | 14.5 | -44 | W1 |
9 Orioles | 70 | 75 | .483 | 16 | -27 | W1 |
10 Twins | 68 | 76 | .472 | 17.5 | -49 | L2 |
11 Mariners | 67 | 77 | .465 | 18.5 | -71 | W1 |
12 Tigers | 66 | 78 | .458 | 19.5 | +51 | W1 |
13 Royals | 64 | 81 | .441 | 22 | -89 | L1 |
14 Athletics | 57 | 87 | .396 | 28.5 | -188 | L1 |
15 Angels | 54 | 90 | .375 | 31.5 | -80 | L2 |
National League
| Team | W | L | PCT | GB | DIFF | STRK |
|---|---|---|---|---|---|---|
1 Brewers | 89 | 56 | .614 | - | +169 | W1 |
2 Dodgers | 87 | 57 | .604 | 1.5 | +155 | W5 |
| 3Braves | 85 | 59 | .590 | 3.5 | +119 | L1 |
| 4Phillies | 81 | 63 | .563 | 7.5 | +35 | W1 |
5 Cubs | 81 | 64 | .559 | 8 | +131 | L2 |
| 6Diamondbacks | 77 | 68 | .531 | 12 | 0 | W3 |
7 Padres | 76 | 68 | .528 | 12.5 | +9 | W2 |
8 Marlins | 72 | 73 | .497 | 17 | +10 | L1 |
9 Cardinals | 72 | 73 | .497 | 17 | -10 | L1 |
10 Pirates | 71 | 73 | .493 | 17.5 | +26 | W1 |
11 Reds | 69 | 75 | .479 | 19.5 | -108 | L1 |
| 12Nationals | 67 | 79 | .459 | 22.5 | +8 | L5 |
13 Mets | 66 | 78 | .458 | 22.5 | -43 | W2 |
14 Giants | 60 | 85 | .414 | 29 | -74 | W1 |
15 Rockies | 55 | 88 | .385 | 33 | -140 | L1 |
ATL
VS
PHI
Pitchers
Grant Holmes
Catchers
Drake Baldwin
Infielders
Ozzie Albies
Matt Olson
Austin Riley
Ha-Seong Kim
Outfielders
Lane Thomas
Michael Harris II
Mauricio Dubon
Designated Hitters
Ronald Acuna Jr.
Pitchers
Jesus Luzardo
Catchers
J.T. Realmuto
Infielders
Trea Turner
Luis Arraez
Alec Bohm
Bryson Stott
Outfielders
Bryce Harper
Brandon Marsh
Justin Crawford
Designated Hitters
Kyle Schwarber
Braves
VS
Phillies
Batting
144
Team Games Played
144
4862
At Bats
4822
1202
Hits
1165
638
Runs Batted In
622
182
Home Runs
170
76
Stolen Bases
97
.247
Batting Average
.242
665
Runs
642
231
Doubles
208
10
Triples
22
1999
Total Bases
1927
415
Walks
459
1177
Strikeouts
1193
.311
On Base Percentage
.312
.411
Slugging Percentage
.400
.722
OBP Pct + SLG Pct
.711
144
Games Played
144
144
Games Started
144
51
Hit By Pitch
55
0.0
Wins Above Replacement
0.0
0.0
Offensive Wins Above Replacement
0.0
22
Caught Stealing
18
1
Is Qualified
1
633.1
Runs Created
615.0
4.5
Runs Created Per 27 Outs
4.3
.077
Walks Per Plate Appearance
.085
0.35
Walk To Strikeout Ratio
0.38
.164
Isolated Power
.158
.260
Secondary Average
.270
3.89
Pitches Per Plate Appearance
3.90
423
Extra Base Hits
400
5380
Plate Appearances
5400
26.7
At Bats Per Home Run
28.4
9
Sacrifice Hit
11
40
Sacrifice Flies
50
Pitching
144
Team Games Played
144
55
Quality Starts
67
85
Wins
81
59
Losses
63
45
Saves
39
100
Holds
66
1105
Hits
1194
504
Earned runs
563
157
Home Runs
167
482
Walks
431
1219
Strikeouts
1411
8.6
Strikeouts Per 9 Innings
9.9
144.0
Pitches Per Start
148.4
1.24
Walks Plus Hits Per Inning Pitched
1.27
3.55
Earned Run Average
3.96
59
Losses
63
1277.0
Innings pitched
1278.2
.590
Win Percentage
.563
64
Save Opportunities
58
.232
Opponent Batting Average
.244
.307
Opponent's On-base pct.
.312
.377
Opponent's Slugging pct.
.397
.684
Opponent's OPB Pct + SLG Pct
.709
4771
At Bats
4885
182
Doubles
196
20
Triples
24
52
Batters Hit
63
101
Stolen Bases
83
144
Games Played
144
1
Complete Games
2
10
Shutouts
17
28
Wild Pitches
37
525
Runs Batted In
576
4
Balks
3
1277.0
Innings pitched
1278.2
8.6
Strikeouts Per 9 Innings
9.9
17
Caught Stealing
35
144
Games Started
144
0.0
Wins Above Replacement
0.0
1
Is Qualified
1
546
Runs
607
504
Earned Runs
563
1798
Total Bases
1939
Fielding
144
Team Games Played
144
1277
Full Innings
1279
5062
Total Chances
5093
3831
Putouts
3836
1169
Assists
1186
62
Errors
71
231
Double Plays
208
0.988
Fielding Percentage
0.986
35.2
Range Factor
35.3
0.0
Zone Rating
0.0
144
Games Played
144
0
Games Started
0
0.0
Defensive Wins Above Replacement
0.0
1
Qualified
1