

Braves vs Red Sox Live Score (27 May, 2026)
Game Information
Stage
Standard
Season
2026
First Pitch
Wed, May 27, 6:45 pm
Venue
Fenway Park
Location
Boston, Massachusetts
Attendance
34,093
Live Situation
2Balls
2Strikes
0Outs
—Pitcher
—At Bat
Pitch Sequence
1
STRIKE LOOKING
Sweeper
83 MPH
2
BALL
Sweeper
85 MPH
3
BALL
Sinker
93 MPH
4
STRIKE SWINGING
Four-seam FB
94 MPH
5
BALL IN PLAY
Sweeper
86 MPH
Injury Report


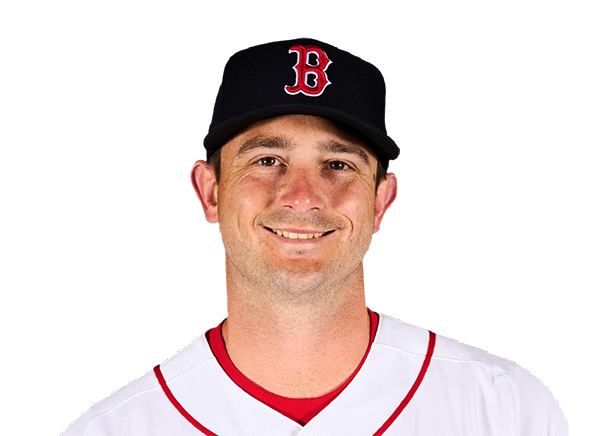
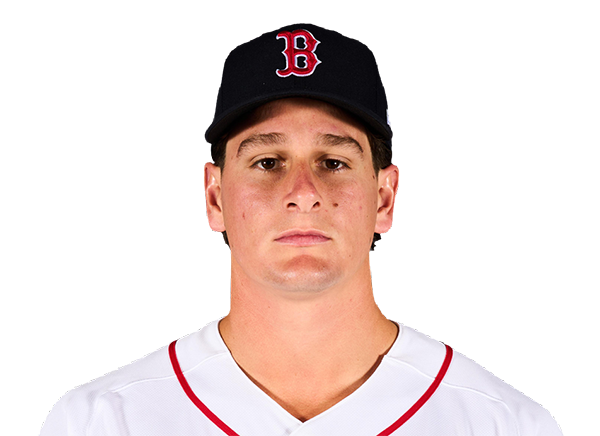
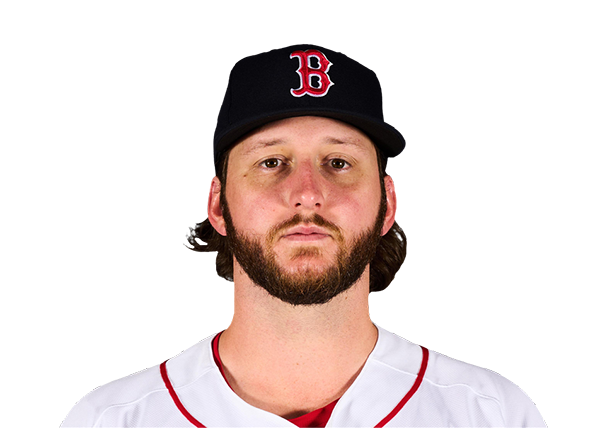
Team Stats
 ATL
BOS


0
Runs
8
5
Hits
15
3
Errors
1
0
Home Runs
1
4
Walks
1
8
Strikeouts
3
Player Box Score
Atlanta Braves
| Player | H-AB | AB | R | H | RBI | HR | BB | K | #P | AVG | OBP | SLG |
|---|---|---|---|---|---|---|---|---|---|---|---|---|
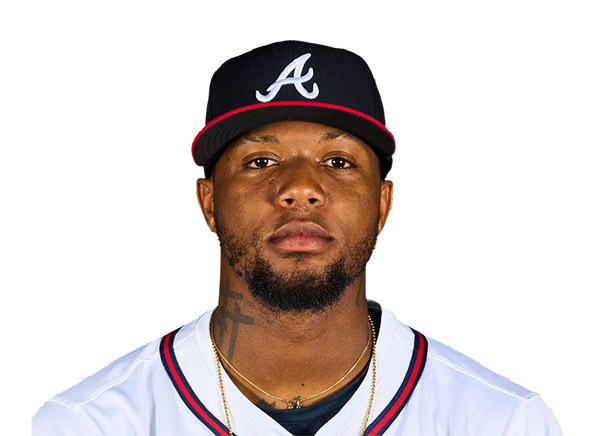 Ronald Acuna Jr. | 0-3 | 3 | 0 | 0 | 0 | 0 | 1 | 1 | 20 | .236 | .351 | .344 |
 Mauricio Dubon | 1-4 | 4 | 0 | 1 | 0 | 0 | 0 | 0 | 10 | .259 | .311 | .386 |
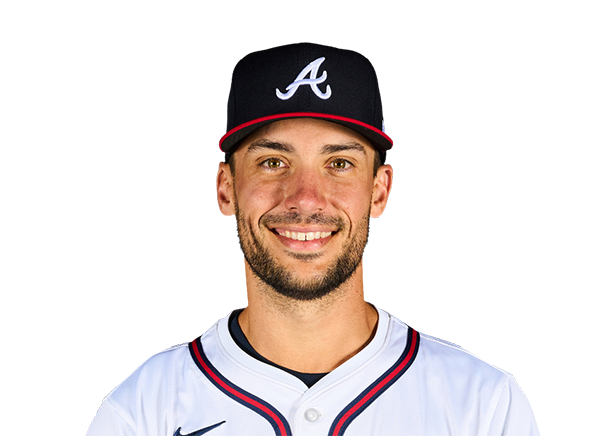 Matt Olson | 0-3 | 3 | 0 | 0 | 0 | 0 | 1 | 0 | 16 | .259 | .341 | .546 |
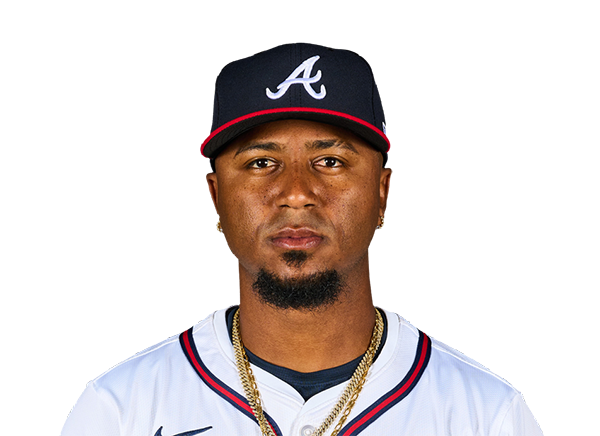 Ozzie Albies | 1-3 | 3 | 0 | 1 | 0 | 0 | 1 | 0 | 20 | .269 | .328 | .417 |
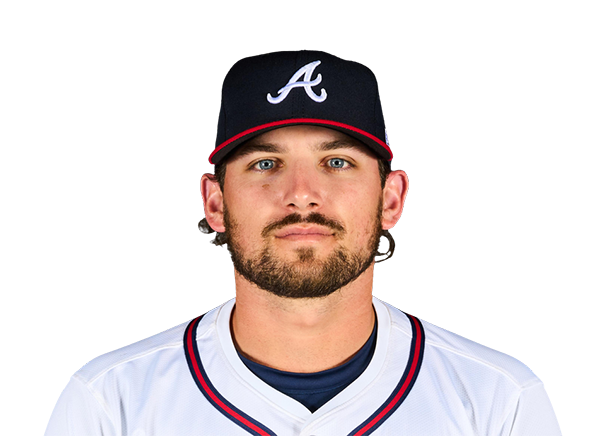 Austin Riley | 0-3 | 3 | 0 | 0 | 0 | 0 | 1 | 2 | 17 | .221 | .294 | .385 |
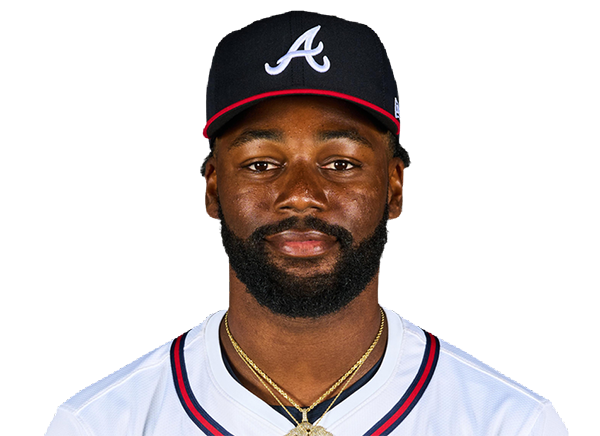 Michael Harris II | 0-4 | 4 | 0 | 0 | 0 | 0 | 0 | 2 | 10 | .298 | .325 | .521 |
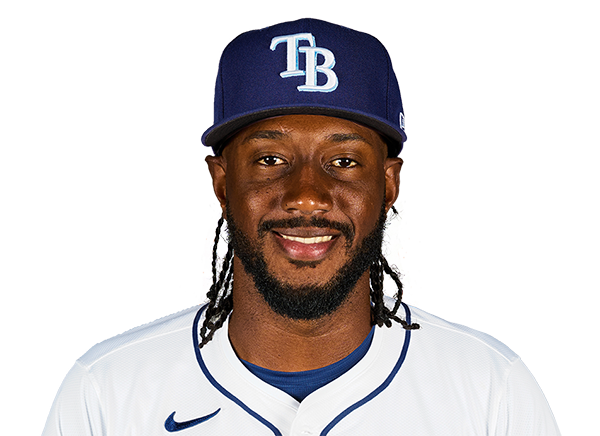 Jorge Mateo | 2-4 | 4 | 0 | 2 | 0 | 0 | 0 | 0 | 8 | .313 | .353 | .453 |
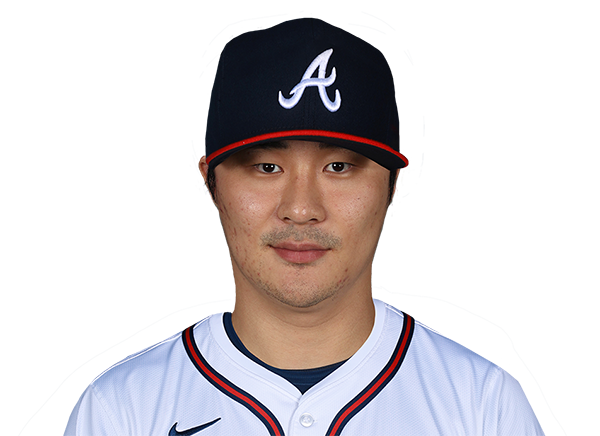 Ha-Seong Kim | 0-4 | 4 | 0 | 0 | 0 | 0 | 0 | 2 | 17 | .095 | .191 | .095 |
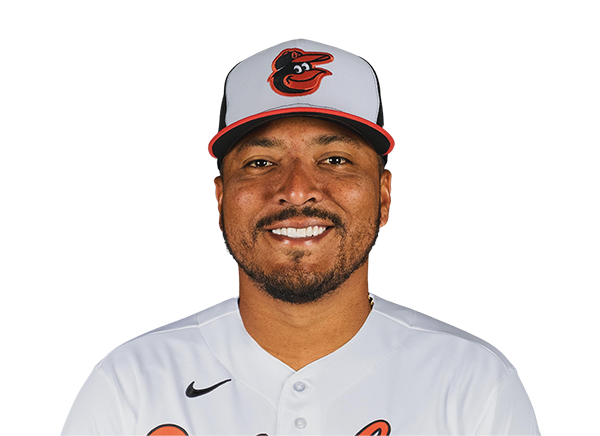 Chadwick Tromp | 1-4 | 4 | 0 | 1 | 0 | 0 | 0 | 1 | 13 | .313 | .313 | .375 |
Boston Red Sox
| Player | H-AB | AB | R | H | RBI | HR | BB | K | #P | AVG | OBP | SLG |
|---|---|---|---|---|---|---|---|---|---|---|---|---|
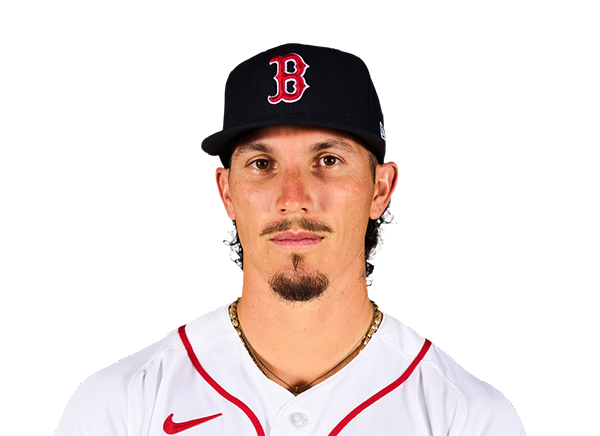 Jarren Duran | 4-5 | 5 | 2 | 4 | 1 | 1 | 0 | 0 | 16 | .213 | .281 | .391 |
 Ceddanne Rafaela | 3-5 | 5 | 1 | 3 | 2 | 0 | 0 | 0 | 8 | .285 | .350 | .441 |
 Wilyer Abreu | 1-5 | 5 | 0 | 1 | 2 | 0 | 0 | 0 | 16 | .285 | .349 | .430 |
 Willson Contreras | 1-5 | 5 | 0 | 1 | 0 | 0 | 0 | 2 | 30 | .283 | .374 | .513 |
 Masataka Yoshida | 1-4 | 4 | 1 | 1 | 0 | 0 | 0 | 0 | 13 | .255 | .347 | .363 |
 Mickey Gasper | 1-3 | 3 | 2 | 1 | 0 | 0 | 1 | 0 | 14 | .326 | .370 | .372 |
 Nick Sogard | 1-3 | 3 | 0 | 1 | 0 | 0 | 0 | 0 | 10 | .300 | .400 | .433 |
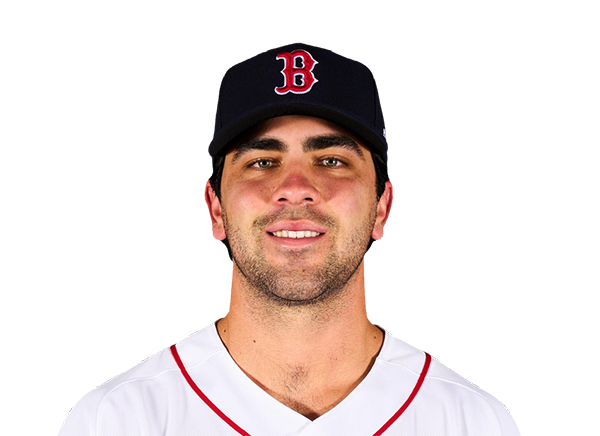 Marcelo Mayer | 2-4 | 4 | 1 | 2 | 1 | 0 | 0 | 0 | 7 | .219 | .280 | .301 |
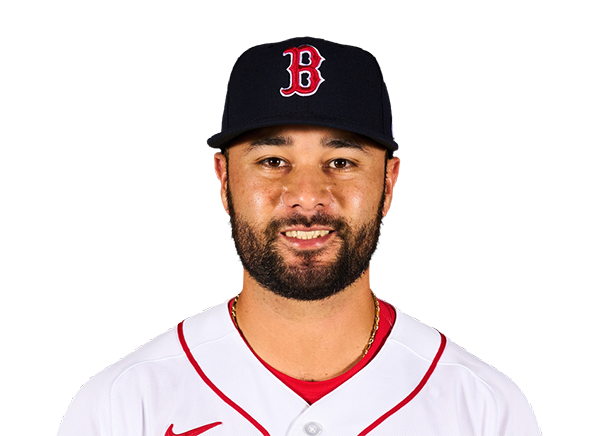 Isiah Kiner-Falefa | 1-4 | 4 | 1 | 1 | 1 | 0 | 0 | 1 | 12 | .276 | .344 | .362 |
Atlanta Braves
| Player | IP | H | R | ER | BB | K | HR | PC-ST | ERA | PC |
|---|---|---|---|---|---|---|---|---|---|---|
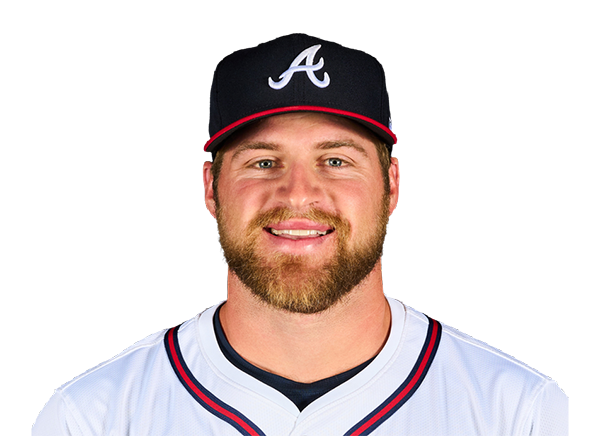 Bryce Elder | 3.1 | 9 | 6 | 5 | 1 | 1 | 0 | 59-41 | 2.50 | 59 |
 Dylan Dodd | 0.2 | 1 | 0 | 0 | 0 | 0 | 0 | 21-15 | 1.04 | 21 |
 Carlos Carrasco | 4.0 | 5 | 2 | 2 | 0 | 2 | 1 | 46-34 | 2.45 | 46 |
Boston Red Sox
| Player | IP | H | R | ER | BB | K | HR | PC-ST | ERA | PC |
|---|---|---|---|---|---|---|---|---|---|---|
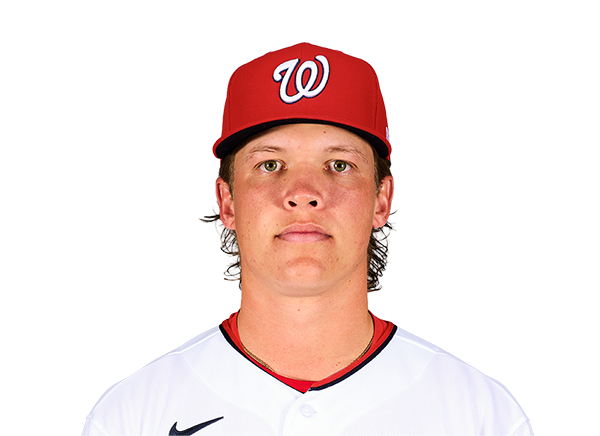 Connelly Early | 7.0 | 4 | 0 | 0 | 3 | 7 | 0 | 97-65 | 2.95 | 97 |
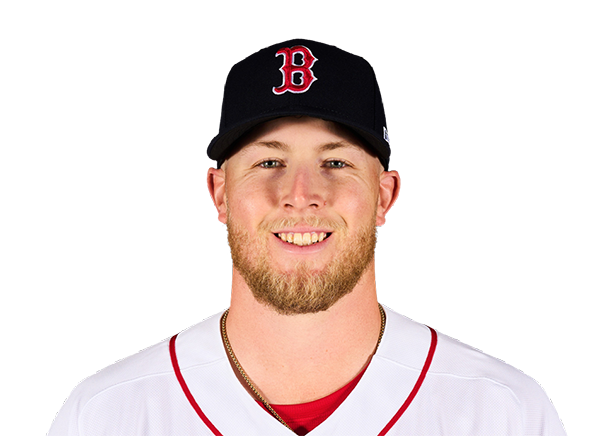 Ryan Watson | 2.0 | 1 | 0 | 0 | 1 | 1 | 0 | 34-22 | 4.96 | 34 |
H2H / Season Series
BOS2–10
ATL
BOS8–0
ATL
BOS6–7
ATL
ATL8–1
BOS
ATL2–3
BOS
ATL3–2
BOS
BOS1–6
ATL
BOS4–3
ATL
ATL10–1
BOS
ATL15–8
BOS
Last 5 Games
| Date | Opponent | Result |
|---|---|---|
| Aug 22 |  @ MIL | L1–4 |
| Aug 21 | @ MIL | L1–2 |
| Aug 20 |  @ CHW | W2–0 |
| Aug 19 |  @ MIN | L4–6 |
| Aug 18 | @ MIN | L1–4 |
| Date | Opponent | Result |
|---|---|---|
| Aug 22 |  vs SF | W3–2 |
| Aug 21 | vs SF | W6–4 |
| Aug 19 |  vs ARI | L6–7 |
| Aug 18 | vs ARI | W9–4 |
| Aug 17 | vs ARI | W11–1 |
Standings
American League
| Team | W | L | PCT | GB | DIFF | STRK |
|---|---|---|---|---|---|---|
1 Rays | 76 | 53 | .589 | - | +42 | L3 |
| 2White Sox | 67 | 62 | .519 | 9 | +42 | L1 |
3 Astros | 65 | 65 | .500 | 11.5 | -43 | L1 |
4 Yankees | 73 | 56 | .566 | 3 | +95 | L1 |
| 5Red Sox | 70 | 59 | .543 | 6 | +98 | W2 |
6 Rangers | 64 | 66 | .492 | 12.5 | -48 | L1 |
7 Guardians | 64 | 66 | .492 | 12.5 | -14 | W3 |
8 Blue Jays | 64 | 67 | .489 | 13 | -50 | W1 |
| 9Twins | 63 | 67 | .485 | 13.5 | -47 | L2 |
10 Orioles | 63 | 67 | .485 | 13.5 | -33 | W2 |
11 Mariners | 62 | 68 | .477 | 14.5 | -44 | W2 |
12 Tigers | 61 | 68 | .473 | 15 | +77 | L4 |
13 Royals | 57 | 74 | .435 | 20 | -95 | W7 |
14 Angels | 52 | 78 | .400 | 24.5 | -68 | W1 |
15 Athletics | 50 | 80 | .385 | 26.5 | -188 | W1 |
National League
| Team | W | L | PCT | GB | DIFF | STRK |
|---|---|---|---|---|---|---|
| 1Brewers | 81 | 49 | .623 | - | +163 | W3 |
2 Dodgers | 79 | 51 | .608 | 2 | +147 | W5 |
| 3Braves | 75 | 55 | .577 | 6 | +108 | L2 |
4 Cubs | 74 | 56 | .569 | 7 | +98 | L3 |
5 Phillies | 72 | 58 | .554 | 9 | +25 | W8 |
6 Padres | 70 | 60 | .538 | 11 | +9 | W2 |
| 7Diamondbacks | 68 | 62 | .523 | 13 | +7 | L1 |
8 Marlins | 66 | 64 | .508 | 15 | +17 | W2 |
9 Cardinals | 66 | 65 | .504 | 15.5 | 0 | L2 |
10 Pirates | 63 | 68 | .481 | 18.5 | +29 | L2 |
11 Reds | 62 | 68 | .477 | 19 | -92 | W1 |
12 Nationals | 61 | 70 | .466 | 20.5 | +14 | L3 |
13 Mets | 59 | 71 | .454 | 22 | -39 | W1 |
| 14Giants | 52 | 77 | .403 | 28.5 | -79 | L3 |
15 Rockies | 50 | 79 | .388 | 30.5 | -131 | L5 |
ATL
VS
BOS
Pitchers
Bryce Elder
Dylan Dodd
Carlos Carrasco
Catchers
Chadwick Tromp
Infielders
Matt Olson
Ozzie Albies
Austin Riley
Ha-Seong Kim
Outfielders
Ronald Acuna Jr.
Mauricio Dubon
Michael Harris II
Designated Hitters
Jorge Mateo
Pitchers
Connelly Early
Ryan Watson
Catchers
Mickey Gasper
Infielders
Willson Contreras
Nick Sogard
Marcelo Mayer
Isiah Kiner-Falefa
Outfielders
Jarren Duran
Ceddanne Rafaela
Wilyer Abreu
Designated Hitters
Masataka Yoshida
Braves
VS
Red Sox
Batting
130
Team Games Played
129
4395
At Bats
4320
1081
Hits
1083
585
Runs Batted In
559
167
Home Runs
132
63
Stolen Bases
96
.246
Batting Average
.251
610
Runs
584
207
Doubles
234
9
Triples
20
1807
Total Bases
1753
378
Walks
414
1052
Strikeouts
1046
.310
On Base Percentage
.324
.411
Slugging Percentage
.406
.721
OBP Pct + SLG Pct
.730
130
Games Played
129
130
Games Started
129
48
Hit By Pitch
77
0.0
Wins Above Replacement
0.0
0.0
Offensive Wins Above Replacement
0.0
21
Caught Stealing
35
1
Is Qualified
1
571.9
Runs Created
581.4
4.5
Runs Created Per 27 Outs
4.6
.078
Walks Per Plate Appearance
.085
0.36
Walk To Strikeout Ratio
0.40
.165
Isolated Power
.155
.261
Secondary Average
.265
3.89
Pitches Per Plate Appearance
3.83
383
Extra Base Hits
386
4868
Plate Appearances
4887
26.3
At Bats Per Home Run
32.7
7
Sacrifice Hit
29
37
Sacrifice Flies
45
Pitching
130
Team Games Played
129
49
Quality Starts
52
75
Wins
70
55
Losses
59
39
Saves
35
92
Holds
79
991
Hits
1033
463
Earned runs
448
146
Home Runs
125
442
Walks
368
1106
Strikeouts
1105
8.6
Strikeouts Per 9 Innings
8.7
144.5
Pitches Per Start
139.8
1.24
Walks Plus Hits Per Inning Pitched
1.22
3.61
Earned Run Average
3.51
55
Losses
59
1153.0
Innings pitched
1147.1
.577
Win Percentage
.543
56
Save Opportunities
46
.230
Opponent Batting Average
.239
.307
Opponent's On-base pct.
.304
.378
Opponent's Slugging pct.
.376
.685
Opponent's OPB Pct + SLG Pct
.680
4301
At Bats
4321
164
Doubles
201
17
Triples
8
45
Batters Hit
50
95
Stolen Bases
87
130
Games Played
129
0
Complete Games
0
8
Shutouts
13
26
Wild Pitches
27
482
Runs Batted In
469
4
Balks
3
1153.0
Innings pitched
1147.1
8.6
Strikeouts Per 9 Innings
8.7
17
Caught Stealing
17
130
Games Started
129
0.0
Wins Above Replacement
0.0
1
Is Qualified
1
502
Runs
486
463
Earned Runs
448
1627
Total Bases
1625
Fielding
130
Team Games Played
129
1153
Full Innings
1147
4571
Total Chances
4630
3459
Putouts
3442
1053
Assists
1125
59
Errors
63
207
Double Plays
234
0.987
Fielding Percentage
0.986
35.2
Range Factor
35.8
0.0
Zone Rating
0.0
130
Games Played
129
0
Games Started
0
0.0
Defensive Wins Above Replacement
0.0
1
Qualified
1