

Brewers vs Cubs Live Score (20 May, 2026)
Game Information
Stage
Standard
Season
2026
First Pitch
Wed, May 20, 7:40 pm
Venue
Wrigley Field
Location
Chicago, Illinois
Attendance
39,459
Live Situation
3Balls
3Strikes
0Outs
—Pitcher
—At Bat
Pitch Sequence
1
BALL
Changeup
84 MPH
2
BALL
Sinker
95 MPH
3
STRIKE LOOKING
Sinker
93 MPH
4
BALL
Sinker
94 MPH
5
STRIKE FOUL
Sinker
93 MPH
6
STRIKE LOOKING
Curve
79 MPH
Injury Report

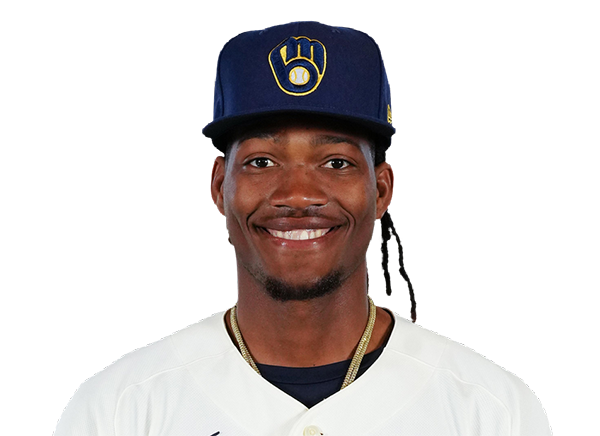
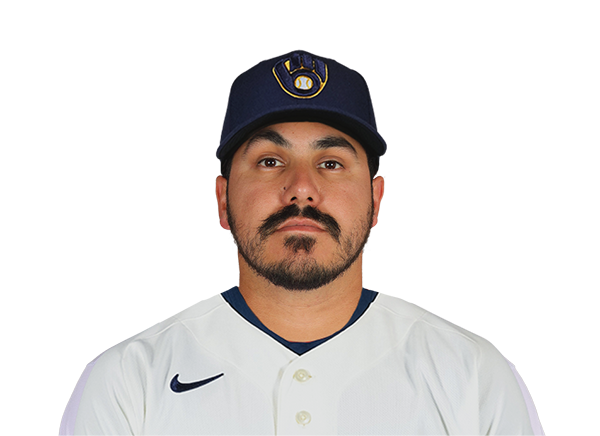
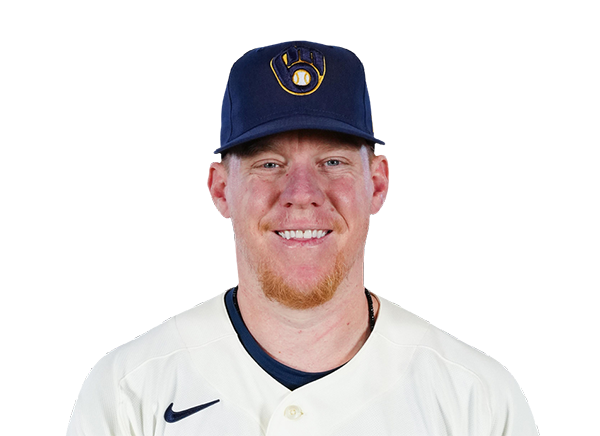
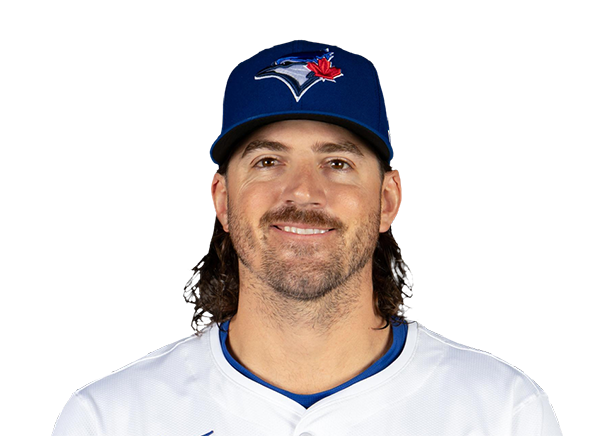
Team Stats
 MIL
CHC

5
Runs
0
8
Hits
2
0
Errors
3
0
Home Runs
0
4
Walks
2
9
Strikeouts
13
Player Box Score
Milwaukee Brewers
| Player | H-AB | AB | R | H | RBI | HR | BB | K | #P | AVG | OBP | SLG |
|---|---|---|---|---|---|---|---|---|---|---|---|---|
 Jackson Chourio |
0-4 | 4 | 0 | 0 | 0 | 0 | 1 | 1 | 23 | .286 | .328 | .413 |
 Brice Turang |
1-4 | 4 | 0 | 1 | 0 | 0 | 1 | 2 | 20 | .291 | .413 | .491 |
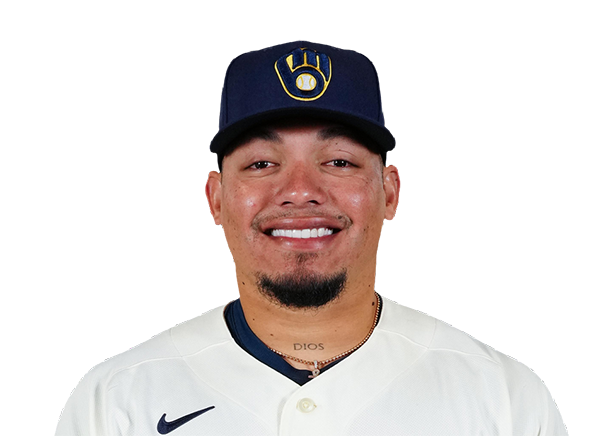 William Contreras |
3-4 | 4 | 1 | 3 | 0 | 0 | 1 | 1 | 20 | .294 | .366 | .389 |
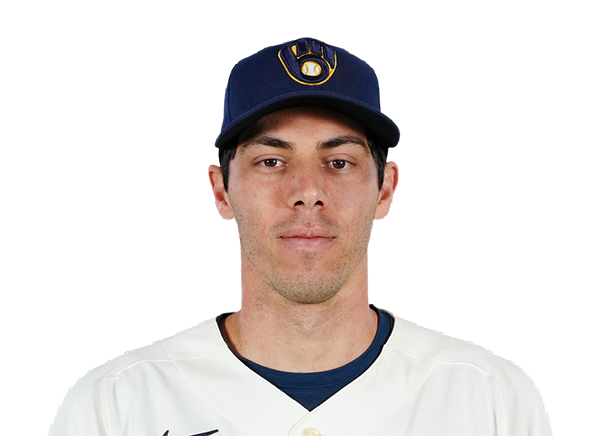 Christian Yelich |
0-5 | 5 | 0 | 0 | 0 | 0 | 0 | 2 | 20 | .270 | .325 | .473 |
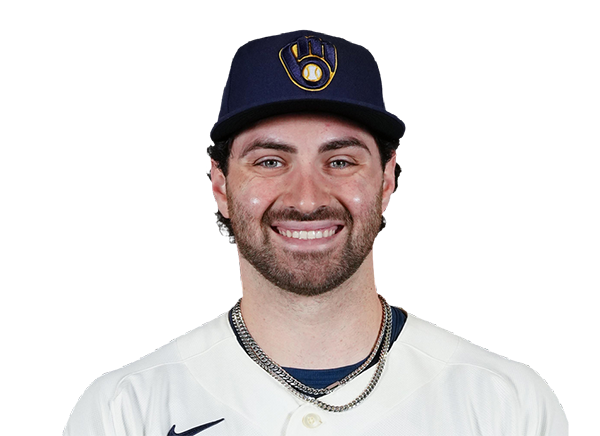 Garrett Mitchell |
0-2 | 2 | 0 | 0 | 0 | 0 | 0 | 1 | 7 | .220 | .342 | .346 |
 Blake Perkins |
0-2 | 2 | 0 | 0 | 0 | 0 | 0 | 1 | 9 | .105 | .203 | .158 |
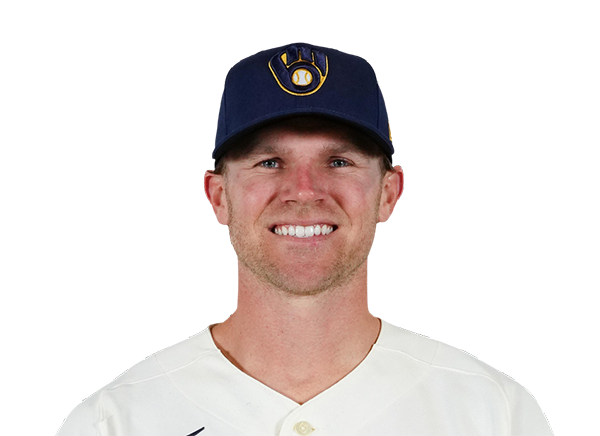 Jake Bauers |
1-4 | 4 | 0 | 1 | 1 | 0 | 0 | 1 | 15 | .291 | .360 | .500 |
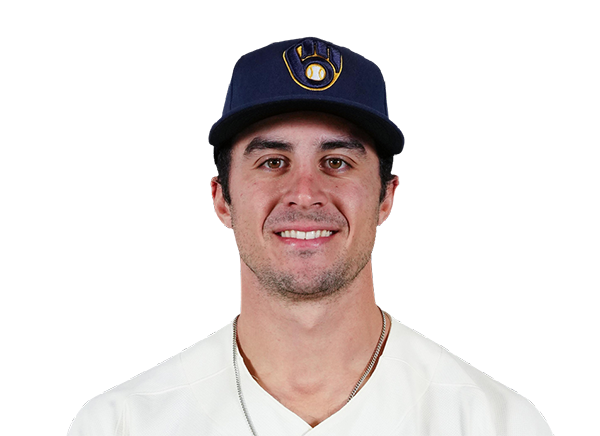 Sal Frelick |
0-3 | 3 | 1 | 0 | 0 | 0 | 0 | 0 | 9 | .222 | .297 | .307 |
 Joey Ortiz |
0-3 | 3 | 1 | 0 | 0 | 0 | 1 | 0 | 17 | .196 | .282 | .245 |
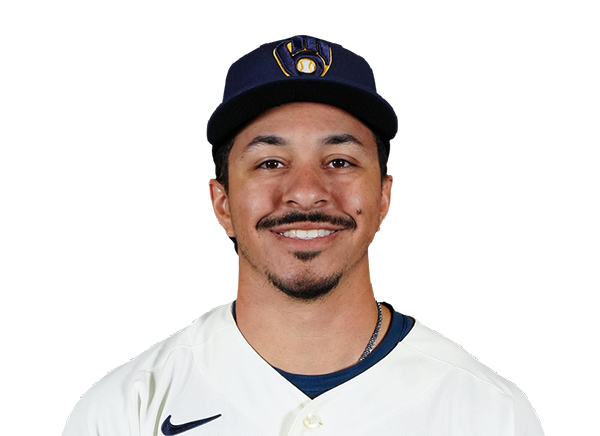 David Hamilton |
3-4 | 4 | 2 | 3 | 1 | 0 | 0 | 0 | 15 | .248 | .344 | .284 |
Chicago Cubs
| Player | H-AB | AB | R | H | RBI | HR | BB | K | #P | AVG | OBP | SLG |
|---|---|---|---|---|---|---|---|---|---|---|---|---|
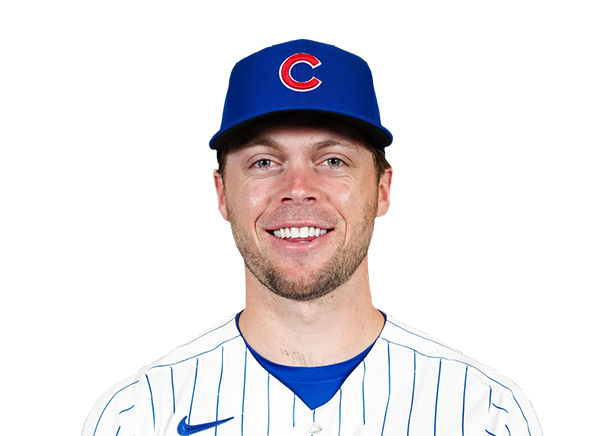 Nico Hoerner |
1-4 | 4 | 0 | 1 | 0 | 0 | 0 | 0 | 17 | .264 | .348 | .391 |
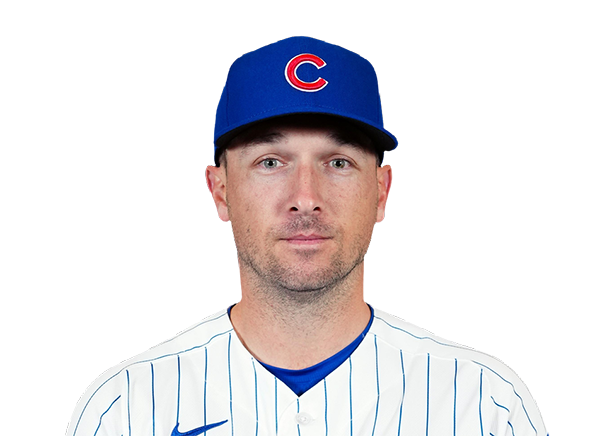 Alex Bregman |
1-4 | 4 | 0 | 1 | 0 | 0 | 0 | 1 | 14 | .249 | .332 | .350 |
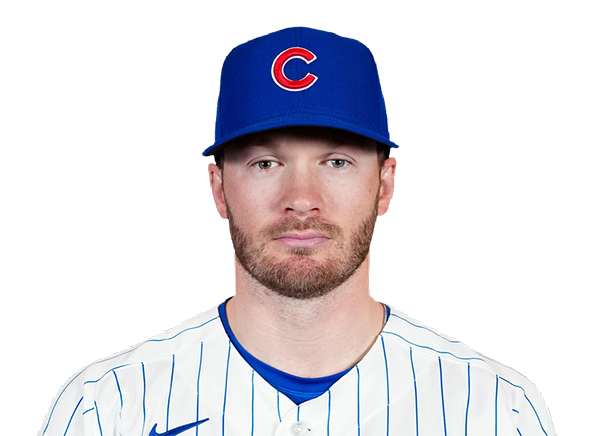 Ian Happ |
0-3 | 3 | 0 | 0 | 0 | 0 | 0 | 3 | 11 | .215 | .353 | .429 |
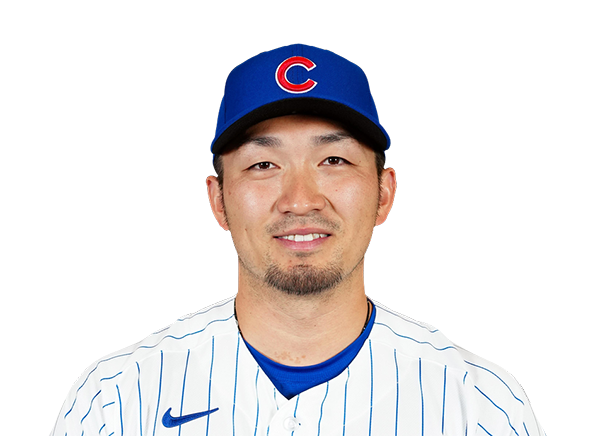 Seiya Suzuki |
0-2 | 2 | 0 | 0 | 0 | 0 | 1 | 1 | 17 | .261 | .363 | .448 |
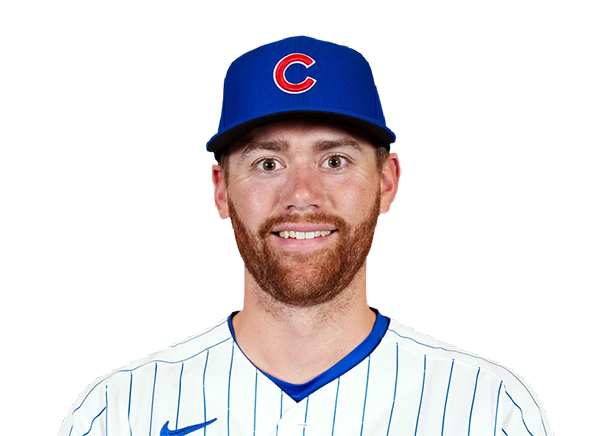 Carson Kelly |
0-3 | 3 | 0 | 0 | 0 | 0 | 0 | 2 | 16 | .297 | .381 | .398 |
 Michael Busch |
0-2 | 2 | 0 | 0 | 0 | 0 | 1 | 1 | 11 | .233 | .360 | .375 |
 Dansby Swanson |
0-3 | 3 | 0 | 0 | 0 | 0 | 0 | 2 | 10 | .191 | .295 | .358 |
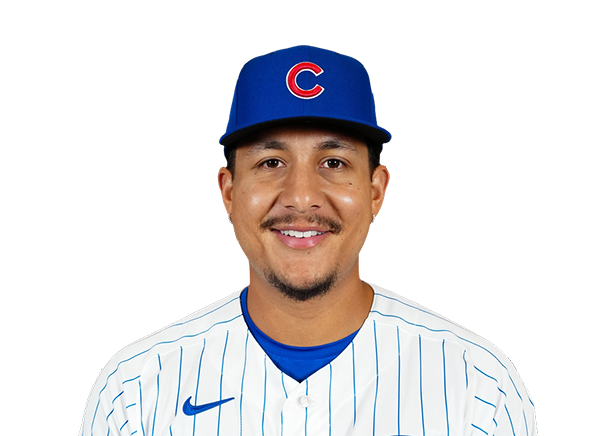 Miguel Amaya |
0-3 | 3 | 0 | 0 | 0 | 0 | 0 | 1 | 11 | .236 | .353 | .389 |
 Pete Crow-Armstrong |
0-3 | 3 | 0 | 0 | 0 | 0 | 0 | 2 | 14 | .225 | .302 | .357 |
Milwaukee Brewers
| Player | IP | H | R | ER | BB | K | HR | PC-ST | ERA | PC |
|---|---|---|---|---|---|---|---|---|---|---|
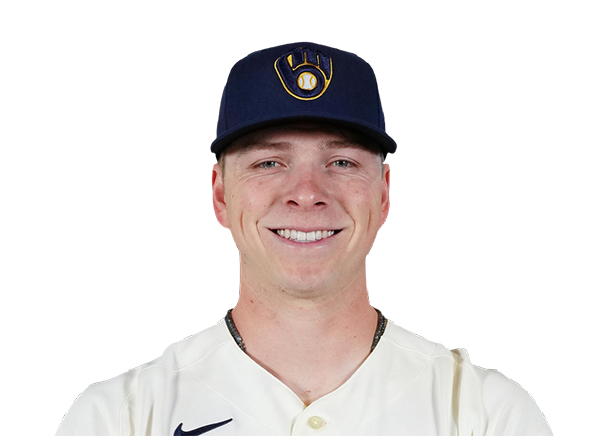 Kyle Harrison |
7.0 | 2 | 0 | 0 | 1 | 11 | 0 | 94-65 | 1.77 | 94 |
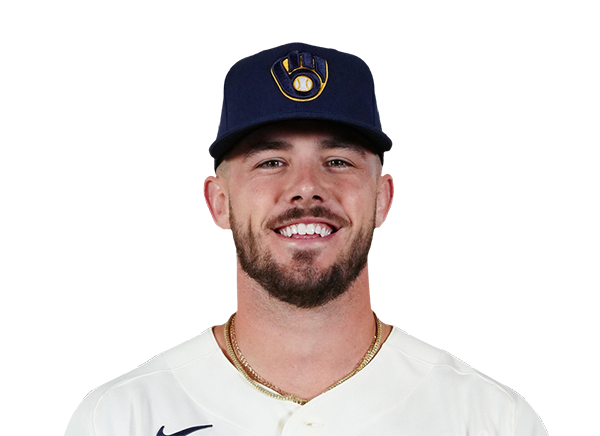 DL Hall |
2.0 | 0 | 0 | 0 | 1 | 2 | 0 | 27-15 | 1.54 | 27 |
Chicago Cubs
| Player | IP | H | R | ER | BB | K | HR | PC-ST | ERA | PC |
|---|---|---|---|---|---|---|---|---|---|---|
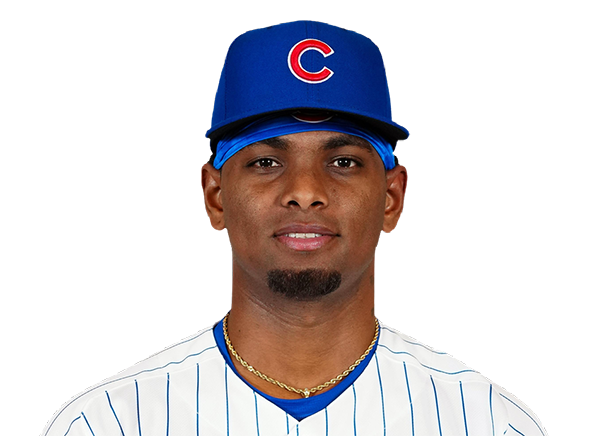 Edward Cabrera |
3.0 | 4 | 4 | 1 | 2 | 2 | 0 | 61-32 | 4.00 | 61 |
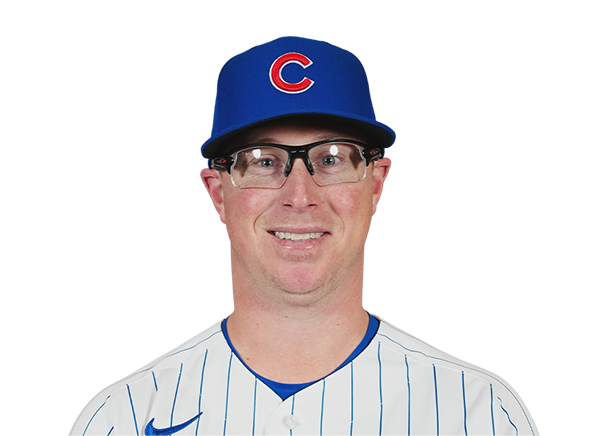 Trent Thornton |
1.2 | 0 | 0 | 0 | 0 | 2 | 0 | 18-14 | 2.35 | 18 |
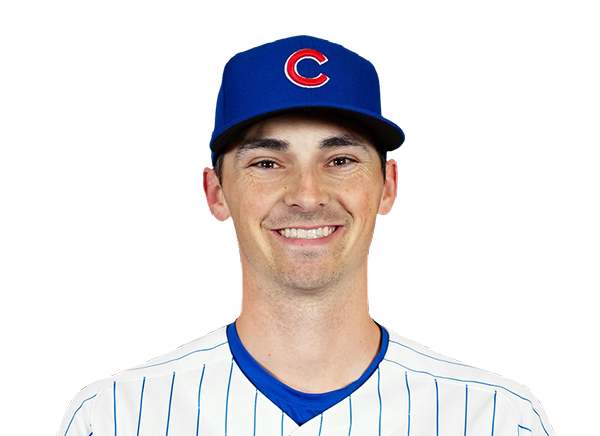 Hoby Milner |
1.1 | 0 | 0 | 0 | 0 | 1 | 0 | 16-11 | 1.96 | 16 |
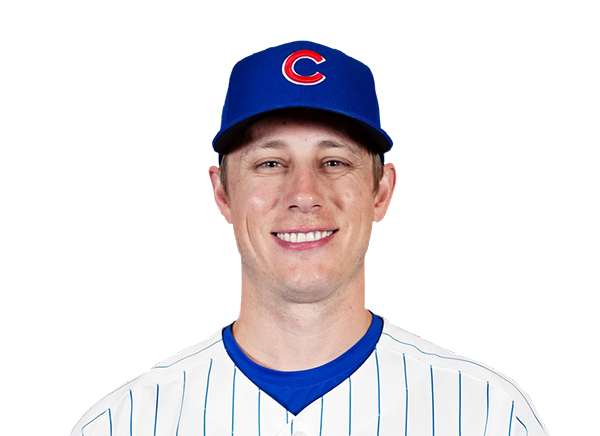 Phil Maton |
0.2 | 2 | 1 | 1 | 1 | 1 | 0 | 16-9 | 9.00 | 16 |
 Ryan Rolison |
1.2 | 0 | 0 | 0 | 0 | 1 | 0 | 20-14 | 3.86 | 20 |
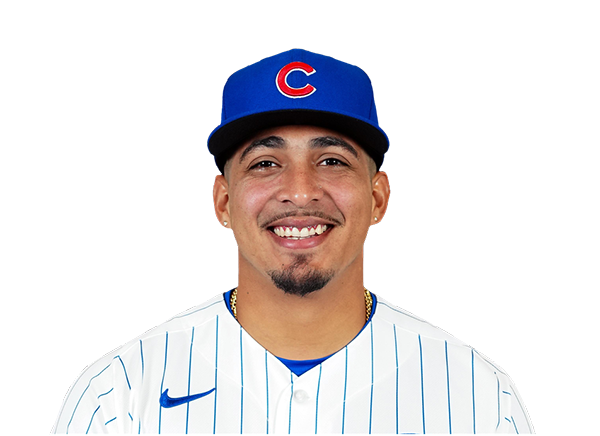 Daniel Palencia |
0.2 | 2 | 0 | 0 | 1 | 2 | 0 | 24-15 | 1.86 | 24 |
H2H / Season Series
MIL3–4
CHC
MIL2–8
CHC
MIL6–2
CHC
CHC0–5
MIL
CHC2–5
MIL
CHC3–9
MIL
CHC12–0
MIL
MIL1–4
CHC
Last 5 Games
| Date | Opponent | Result |
|---|---|---|
| Aug 22 |  vs ATL | W4–1 |
| Aug 21 | vs ATL | W2–1 |
| Aug 20 |  vs SEA | W7–4 |
| Aug 19 | vs SEA | L5–7 |
| Aug 18 | vs SEA | W22–0 |
| Date | Opponent | Result |
|---|---|---|
| Aug 22 | @ SEA | L4–5 |
| Aug 21 | @ SEA | L5–6 |
| Aug 19 |  vs CHW | L0–3 |
| Aug 18 | vs CHW | W4–3 |
| Aug 17 | vs CHW | W7–5 |
Standings
American League
| Team | W | L | PCT | GB | DIFF | STRK |
|---|---|---|---|---|---|---|
1 Rays | 76 | 53 | .589 | - | +42 | L3 |
| 2White Sox | 67 | 62 | .519 | 9 | +42 | L1 |
3 Astros | 65 | 65 | .500 | 11.5 | -43 | L1 |
4 Yankees | 73 | 56 | .566 | 3 | +95 | L1 |
5 Red Sox | 70 | 59 | .543 | 6 | +98 | W2 |
6 Rangers | 64 | 66 | .492 | 12.5 | -48 | L1 |
7 Guardians | 64 | 66 | .492 | 12.5 | -14 | W3 |
8 Blue Jays | 64 | 67 | .489 | 13 | -50 | W1 |
9 Twins | 63 | 67 | .485 | 13.5 | -47 | L2 |
10 Orioles | 63 | 67 | .485 | 13.5 | -33 | W2 |
| 11Mariners | 62 | 68 | .477 | 14.5 | -44 | W2 |
12 Tigers | 61 | 68 | .473 | 15 | +77 | L4 |
13 Royals | 57 | 74 | .435 | 20 | -95 | W7 |
14 Angels | 52 | 78 | .400 | 24.5 | -68 | W1 |
15 Athletics | 50 | 80 | .385 | 26.5 | -188 | W1 |
National League
| Team | W | L | PCT | GB | DIFF | STRK |
|---|---|---|---|---|---|---|
| 1Brewers | 81 | 49 | .623 | - | +163 | W3 |
2 Dodgers | 79 | 51 | .608 | 2 | +147 | W5 |
| 3Braves | 75 | 55 | .577 | 6 | +108 | L2 |
| 4Cubs | 74 | 56 | .569 | 7 | +98 | L3 |
5 Phillies | 72 | 58 | .554 | 9 | +25 | W8 |
6 Padres | 70 | 60 | .538 | 11 | +9 | W2 |
7 Diamondbacks | 68 | 62 | .523 | 13 | +7 | L1 |
8 Marlins | 66 | 64 | .508 | 15 | +17 | W2 |
9 Cardinals | 66 | 65 | .504 | 15.5 | 0 | L2 |
10 Pirates | 63 | 68 | .481 | 18.5 | +29 | L2 |
11 Reds | 62 | 68 | .477 | 19 | -92 | W1 |
12 Nationals | 61 | 70 | .466 | 20.5 | +14 | L3 |
13 Mets | 59 | 71 | .454 | 22 | -39 | W1 |
14 Giants | 52 | 77 | .403 | 28.5 | -79 | L3 |
15 Rockies | 50 | 79 | .388 | 30.5 | -131 | L5 |
MIL
VS
CHC
Pitchers
Kyle Harrison
DL Hall
Catchers
William Contreras
Infielders
Brice Turang
Jake Bauers
Joey Ortiz
David Hamilton
Outfielders
Jackson Chourio
Garrett Mitchell
Blake Perkins
Sal Frelick
Designated Hitters
Christian Yelich
Pitchers
Edward Cabrera
Trent Thornton
Hoby Milner
Phil Maton
Ryan Rolison
Daniel Palencia
Catchers
Carson Kelly
Infielders
Nico Hoerner
Alex Bregman
Michael Busch
Dansby Swanson
Outfielders
Ian Happ
Seiya Suzuki
Pete Crow-Armstrong
Designated Hitters
Miguel Amaya
Brewers
VS
Cubs
Batting
130
Team Games Played
130
4392
At Bats
4465
1112
Hits
1108
609
Runs Batted In
626
120
Home Runs
170
129
Stolen Bases
97
.253
Batting Average
.248
648
Runs
665
228
Doubles
219
20
Triples
20
1740
Total Bases
1877
540
Walks
549
1089
Strikeouts
1122
.337
On Base Percentage
.337
.396
Slugging Percentage
.420
.733
OBP Pct + SLG Pct
.757
130
Games Played
130
130
Games Started
130
32
Hit By Pitch
66
0.0
Wins Above Replacement
0.0
0.0
Offensive Wins Above Replacement
0.0
41
Caught Stealing
17
1
Is Qualified
1
612.8
Runs Created
657.8
4.8
Runs Created Per 27 Outs
5.1
.107
Walks Per Plate Appearance
.107
0.50
Walk To Strikeout Ratio
0.49
.143
Isolated Power
.172
.286
Secondary Average
.313
4.00
Pitches Per Plate Appearance
3.97
368
Extra Base Hits
409
5036
Plate Appearances
5122
36.6
At Bats Per Home Run
26.3
30
Sacrifice Hit
6
35
Sacrifice Flies
35
Pitching
130
Team Games Played
130
46
Quality Starts
40
81
Wins
74
49
Losses
56
43
Saves
29
68
Holds
49
940
Hits
1073
442
Earned runs
536
129
Home Runs
195
411
Walks
391
1259
Strikeouts
999
9.7
Strikeouts Per 9 Innings
7.7
145.3
Pitches Per Start
144.7
1.16
Walks Plus Hits Per Inning Pitched
1.26
3.42
Earned Run Average
4.15
49
Losses
56
1162.1
Innings pitched
1163.0
.623
Win Percentage
.569
61
Save Opportunities
50
.219
Opponent Batting Average
.244
.294
Opponent's On-base pct.
.312
.356
Opponent's Slugging pct.
.417
.650
Opponent's OPB Pct + SLG Pct
.729
4289
At Bats
4391
173
Doubles
154
13
Triples
10
52
Batters Hit
51
55
Stolen Bases
69
130
Games Played
130
1
Complete Games
0
9
Shutouts
5
44
Wild Pitches
28
466
Runs Batted In
548
6
Balks
2
1162.1
Innings pitched
1163.0
9.7
Strikeouts Per 9 Innings
7.7
29
Caught Stealing
25
130
Games Started
130
0.0
Wins Above Replacement
0.0
1
Is Qualified
1
485
Runs
567
442
Earned Runs
536
1526
Total Bases
1832
Fielding
130
Team Games Played
130
1162
Full Innings
1163
4556
Total Chances
4762
3487
Putouts
3489
1012
Assists
1225
57
Errors
48
228
Double Plays
219
0.987
Fielding Percentage
0.990
34.8
Range Factor
36.5
0.0
Zone Rating
0.0
130
Games Played
130
0
Games Started
0
0.0
Defensive Wins Above Replacement
0.0
1
Qualified
1