

Brewers vs Cubs Live Score (2 Sep, 2026)
Game Information
Stage
STD
Season
2026
First Pitch
Wed, Sep 2, 7:40 pm
Venue
Wrigley Field
Location
Chicago, Illinois
Venue Type
Outdoor
Broadcast
MLB.TV
Attendance
36,112
Live Situation
1Balls
1Strikes
0Outs
—Pitcher
—At Bat
Pitch Sequence
1
STRIKE LOOKING
Knuckle Curve
88 MPH
2
BALL
Knuckle Curve
88 MPH
3
BALL IN PLAY
Knuckle Curve
87 MPH
Injury Report

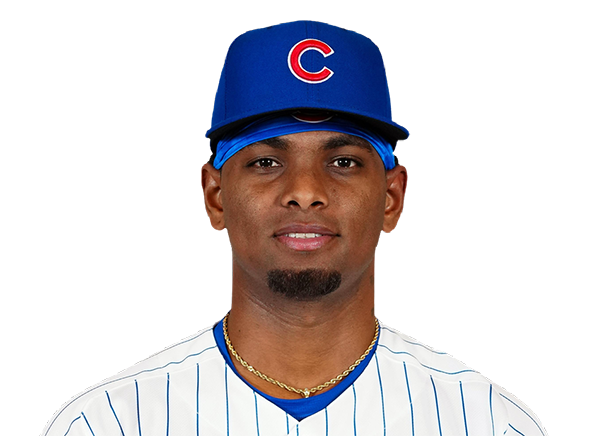

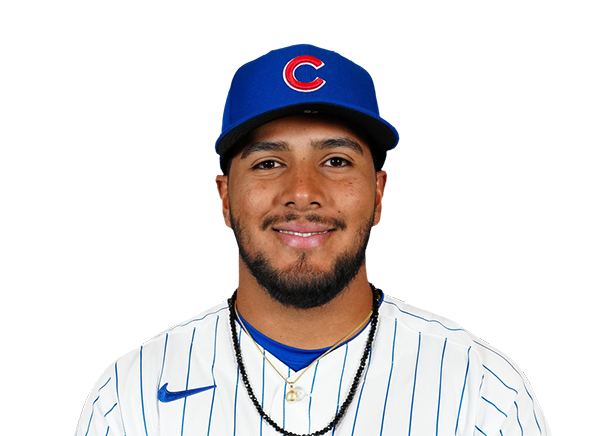
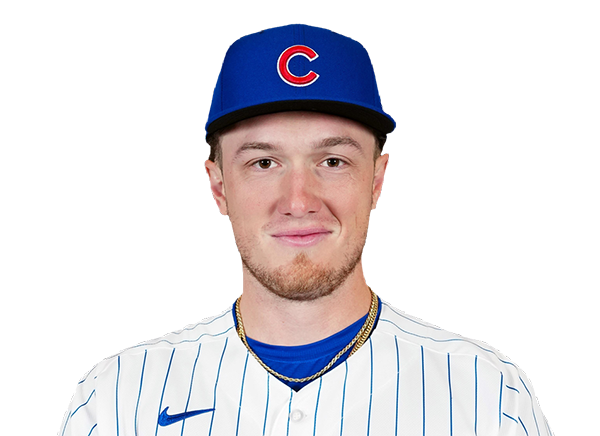
Team Stats
 MIL
CHC


9
Runs
5
14
Hits
6
0
Errors
1
1
Home Runs
1
5
Walks
5
9
Strikeouts
9
Player Box Score
Milwaukee Brewers
| Player | H-AB | AB | R | H | RBI | HR | BB | K | #P | AVG | OBP | SLG |
|---|---|---|---|---|---|---|---|---|---|---|---|---|
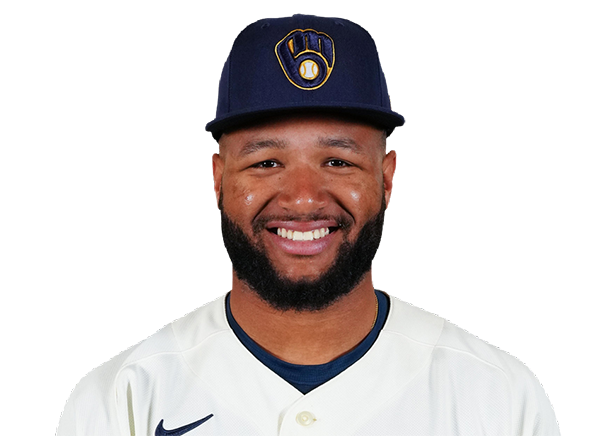 Jackson Chourio | 4-6 | 6 | 2 | 4 | 1 | 1 | 0 | 0 | 17 | .287 | .347 | .487 |
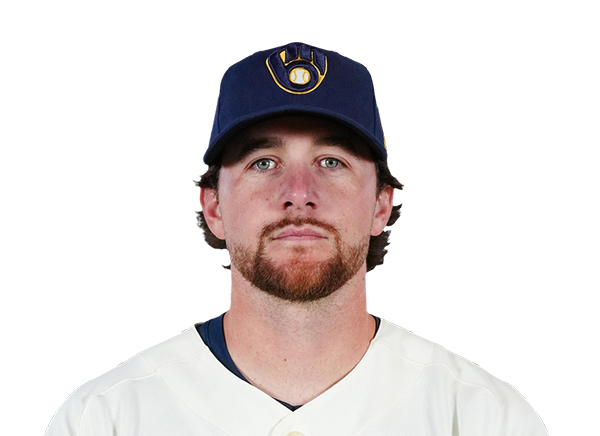 Brice Turang | 0-4 | 4 | 1 | 0 | 1 | 0 | 0 | 2 | 12 | .252 | .346 | .422 |
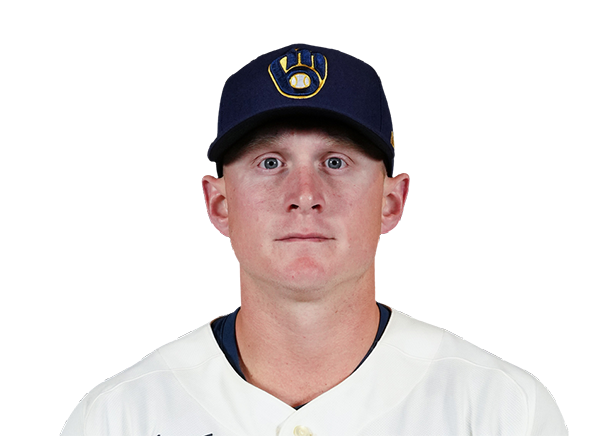 Andrew Vaughn | 2-3 | 3 | 1 | 2 | 1 | 0 | 0 | 1 | 15 | .314 | .399 | .453 |
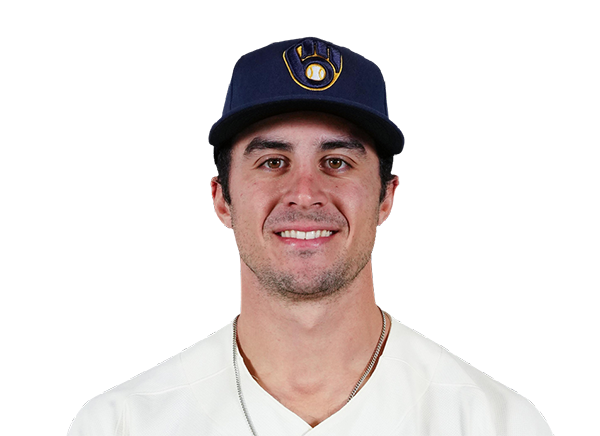 Sal Frelick | 0-2 | 2 | 0 | 0 | 0 | 0 | 0 | 0 | 7 | .238 | .305 | .332 |
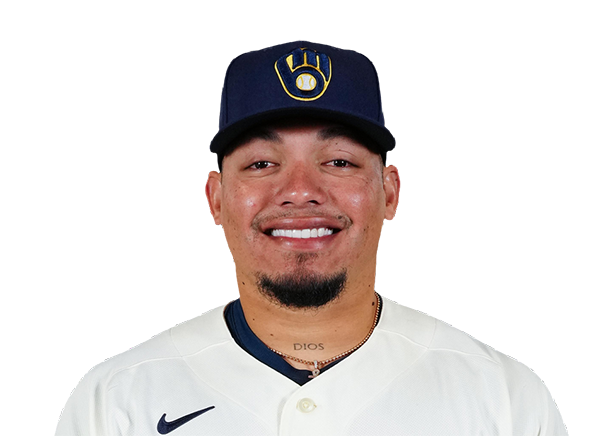 William Contreras | 2-5 | 5 | 1 | 2 | 1 | 0 | 0 | 1 | 14 | .274 | .343 | .405 |
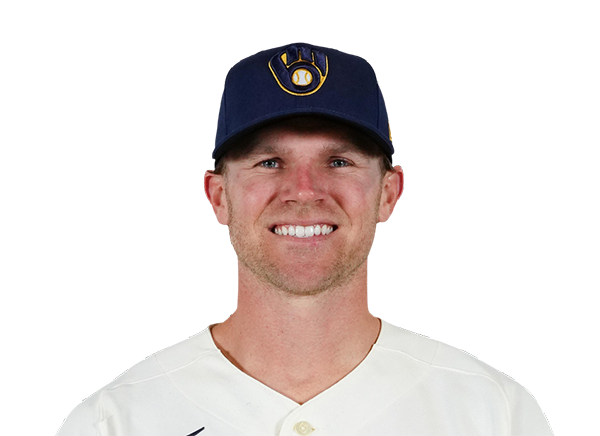 Jake Bauers | 0-4 | 4 | 0 | 0 | 0 | 0 | 1 | 2 | 24 | .270 | .390 | .490 |
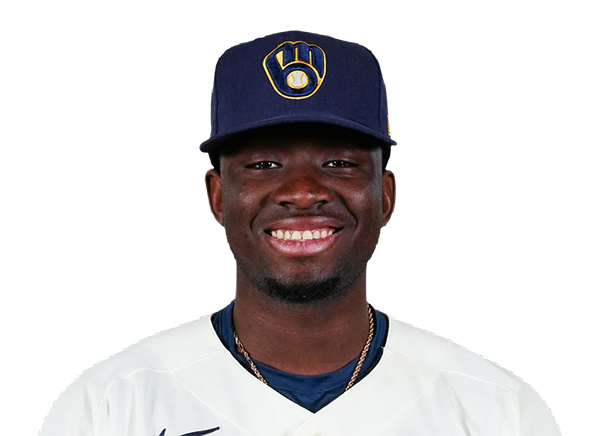 Luis Lara | 1-3 | 3 | 1 | 1 | 1 | 0 | 1 | 1 | 24 | .276 | .351 | .381 |
 Gary Sanchez | 0-1 | 1 | 0 | 0 | 1 | 0 | 1 | 0 | 9 | .205 | .347 | .425 |
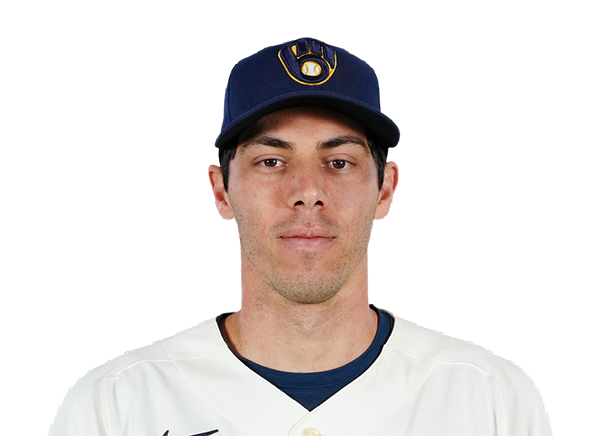 Christian Yelich | 2-3 | 3 | 2 | 2 | 0 | 0 | 0 | 1 | 11 | .241 | .322 | .393 |
 Joey Ortiz | 1-4 | 4 | 0 | 1 | 2 | 0 | 1 | 0 | 16 | .256 | .320 | .390 |
 Cooper Pratt | 2-4 | 4 | 1 | 2 | 1 | 0 | 1 | 1 | 28 | .275 | .344 | .371 |
Chicago Cubs
| Player | H-AB | AB | R | H | RBI | HR | BB | K | #P | AVG | OBP | SLG |
|---|---|---|---|---|---|---|---|---|---|---|---|---|
 Pete Crow-Armstrong | 1-3 | 3 | 2 | 1 | 0 | 0 | 2 | 1 | 20 | .280 | .375 | .568 |
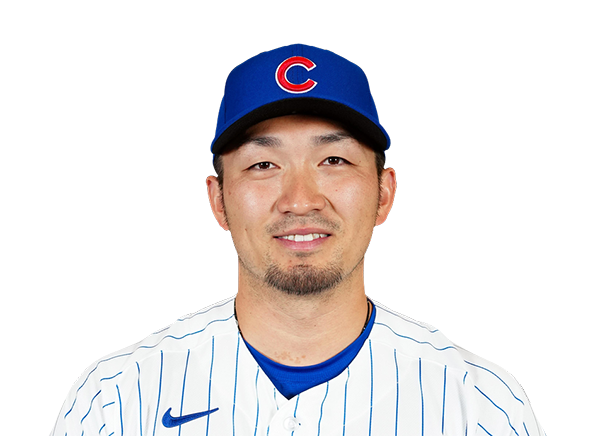 Seiya Suzuki | 0-3 | 3 | 0 | 0 | 0 | 0 | 2 | 0 | 26 | .275 | .371 | .489 |
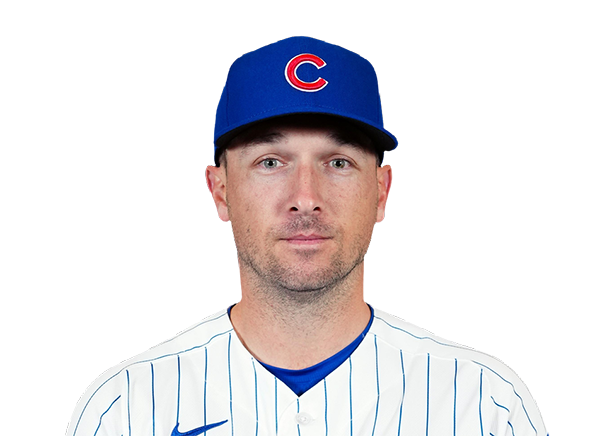 Alex Bregman | 2-4 | 4 | 1 | 2 | 4 | 1 | 0 | 0 | 16 | .260 | .346 | .444 |
 Michael Busch | 0-4 | 4 | 0 | 0 | 0 | 0 | 0 | 2 | 15 | .237 | .346 | .389 |
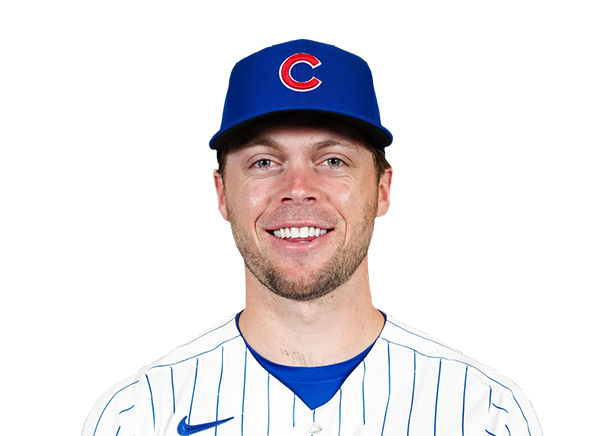 Nico Hoerner | 0-4 | 4 | 0 | 0 | 0 | 0 | 0 | 1 | 15 | .261 | .317 | .358 |
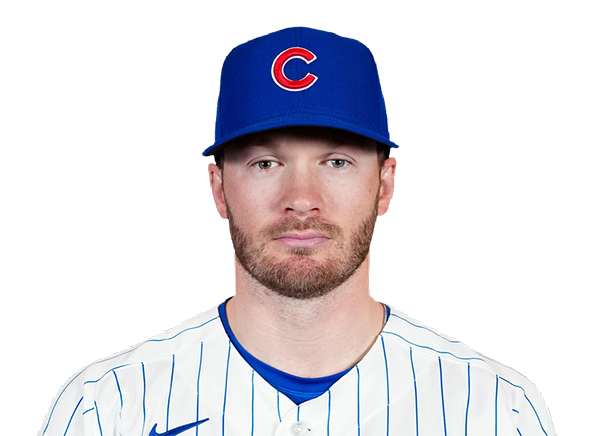 Ian Happ | 1-4 | 4 | 0 | 1 | 0 | 0 | 0 | 1 | 12 | .220 | .325 | .420 |
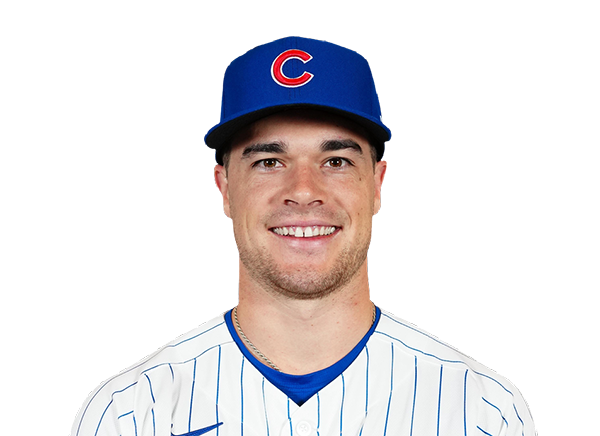 Matt Shaw | 1-4 | 4 | 1 | 1 | 0 | 0 | 0 | 0 | 15 | .250 | .331 | .451 |
 Tyrone Taylor | 1-3 | 3 | 1 | 1 | 1 | 0 | 0 | 0 | 10 | .284 | .333 | .515 |
 Michael Conforto | 0-1 | 1 | 0 | 0 | 0 | 0 | 0 | 1 | 4 | .234 | .324 | .477 |
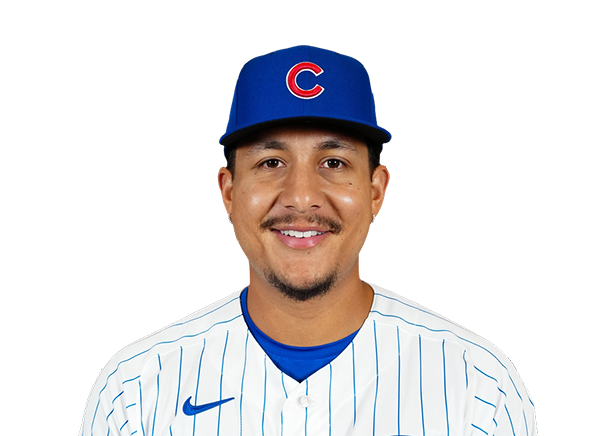 Miguel Amaya | 0-2 | 2 | 0 | 0 | 0 | 0 | 1 | 2 | 13 | .229 | .339 | .354 |
 B.J. Murray Jr. | 0-1 | 1 | 0 | 0 | 0 | 0 | 0 | 1 | 4 | .200 | .200 | .200 |
Milwaukee Brewers
| Player | IP | H | R | ER | BB | K | HR | PC-ST | ERA | PC |
|---|---|---|---|---|---|---|---|---|---|---|
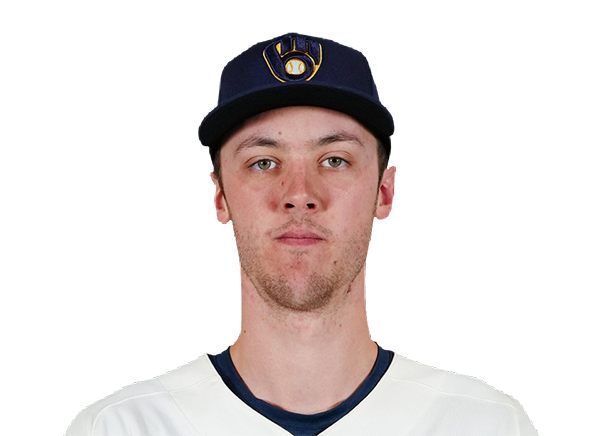 Jacob Misiorowski | 4.0 | 5 | 5 | 5 | 4 | 5 | 1 | 92-53 | 1.97 | 92 |
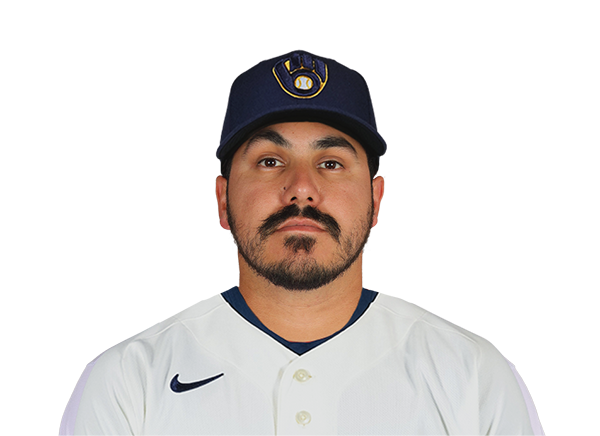 JoJo Romero | 1.0 | 0 | 0 | 0 | 0 | 1 | 0 | 11-7 | 3.22 | 11 |
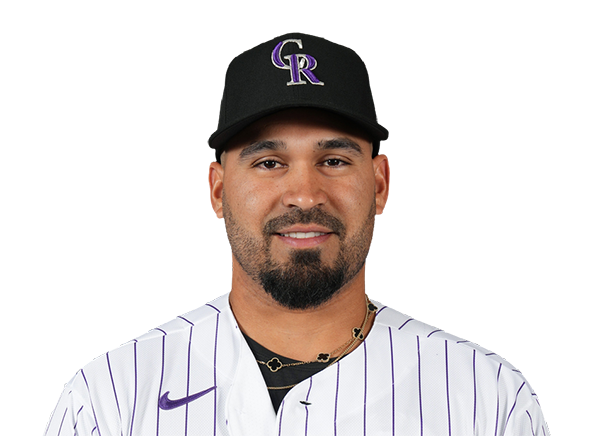 Antonio Senzatela | 1.0 | 0 | 0 | 0 | 1 | 0 | 0 | 12-5 | 3.74 | 12 |
 Abner Uribe | 1.0 | 0 | 0 | 0 | 0 | 1 | 0 | 12-9 | 1.97 | 12 |
 Aaron Ashby | 1.0 | 0 | 0 | 0 | 0 | 0 | 0 | 11-6 | 3.16 | 11 |
 Trevor Megill | 1.0 | 1 | 0 | 0 | 0 | 2 | 0 | 12-10 | 2.19 | 12 |
Chicago Cubs
| Player | IP | H | R | ER | BB | K | HR | PC-ST | ERA | PC |
|---|---|---|---|---|---|---|---|---|---|---|
 David Peterson | 3.2 | 7 | 6 | 6 | 4 | 4 | 1 | 96-57 | 5.39 | 96 |
 Trent Thornton | 0.2 | 2 | 0 | 0 | 1 | 2 | 0 | 23-14 | 3.40 | 23 |
 Ryan Rolison | 1.2 | 0 | 0 | 0 | 0 | 1 | 0 | 19-12 | 2.98 | 19 |
 Daniel Palencia | 1.0 | 2 | 1 | 1 | 0 | 0 | 0 | 13-8 | 5.14 | 13 |
 Caleb Thielbar | 1.0 | 0 | 0 | 0 | 0 | 2 | 0 | 11-9 | 4.98 | 11 |
 Jacob Webb | 0.1 | 1 | 2 | 2 | 0 | 0 | 0 | 7-3 | 3.15 | 7 |
 Colin Rea | 0.2 | 2 | 0 | 0 | 0 | 0 | 0 | 8-6 | 4.45 | 8 |
H2H / Season Series
CHC5–9
MIL
CHC4–9
MIL
CHC17–3
MIL
MIL3–4
CHC
MIL2–8
CHC
MIL6–2
CHC
CHC0–5
MIL
CHC2–5
MIL
CHC3–9
MIL
CHC12–0
MIL
Last 5 Games
| Date | Opponent | Result |
|---|---|---|
| Sep 2 | @ CHC | W9–5 |
| Sep 1 | @ CHC | W9–4 |
| Aug 31 | @ CHC | L3–17 |
| Aug 30 |  vs TEX | L4–7 |
| Aug 29 | vs TEX | W5–3 |
| Date | Opponent | Result |
|---|---|---|
| Sep 2 | vs MIL | L5–9 |
| Sep 1 | vs MIL | L4–9 |
| Aug 31 | vs MIL | W17–3 |
| Aug 30 |  vs CIN | L5–7 |
| Aug 29 | vs CIN | W17–5 |
Standings
American League
| Team | W | L | PCT | GB | DIFF | STRK |
|---|---|---|---|---|---|---|
1 Rays | 83 | 56 | .597 | - | +51 | L1 |
2 White Sox | 73 | 65 | .529 | 9.5 | +45 | W1 |
3 Astros | 70 | 69 | .504 | 13 | -44 | L1 |
4 Yankees | 79 | 60 | .568 | 4 | +112 | W1 |
5 Red Sox | 75 | 65 | .536 | 8.5 | +77 | L2 |
6 Guardians | 70 | 69 | .504 | 13 | -8 | L1 |
| 7Rangers | 69 | 71 | .493 | 14.5 | -48 | L1 |
8 Blue Jays | 69 | 71 | .493 | 14.5 | -44 | W1 |
9 Orioles | 69 | 71 | .493 | 14.5 | -20 | L2 |
10 Twins | 67 | 72 | .482 | 16 | -33 | W3 |
11 Mariners | 66 | 74 | .471 | 17.5 | -65 | W2 |
12 Tigers | 63 | 75 | .457 | 19.5 | +42 | L3 |
13 Royals | 62 | 77 | .446 | 21 | -86 | L2 |
14 Athletics | 54 | 86 | .386 | 29.5 | -194 | W1 |
15 Angels | 53 | 86 | .381 | 30 | -77 | L1 |
National League
| Team | W | L | PCT | GB | DIFF | STRK |
|---|---|---|---|---|---|---|
| 1Brewers | 86 | 53 | .619 | - | +168 | W1 |
2 Dodgers | 82 | 56 | .594 | 3.5 | +148 | L1 |
3 Braves | 83 | 57 | .593 | 3.5 | +118 | W1 |
4 Phillies | 79 | 61 | .564 | 7.5 | +36 | L1 |
| 5Cubs | 78 | 61 | .561 | 8 | +136 | L1 |
6 Diamondbacks | 74 | 67 | .525 | 13 | -1 | W1 |
7 Padres | 73 | 67 | .521 | 13.5 | +10 | L2 |
8 Marlins | 70 | 69 | .504 | 16 | +15 | W1 |
9 Cardinals | 69 | 70 | .496 | 17 | -10 | W1 |
10 Pirates | 68 | 72 | .486 | 18.5 | +26 | L1 |
| 11Reds | 67 | 73 | .479 | 19.5 | -108 | W2 |
12 Nationals | 67 | 75 | .472 | 20.5 | +14 | L1 |
13 Mets | 63 | 77 | .450 | 23.5 | -50 | W1 |
14 Giants | 58 | 82 | .414 | 28.5 | -70 | W1 |
15 Rockies | 54 | 86 | .386 | 32.5 | -140 | W2 |
MIL
VS
CHC
Pitchers
Jacob Misiorowski
Catchers
William Contreras
Infielders
Brice Turang
Andrew Vaughn
Joey Ortiz
Cooper Pratt
Outfielders
Jackson Chourio
Jake Bauers
Luis Lara
Designated Hitters
Gary Sanchez
Pitchers
David Peterson
Catchers
Miguel Amaya
Infielders
Alex Bregman
Michael Busch
Nico Hoerner
Matt Shaw
Outfielders
Pete Crow-Armstrong
Ian Happ
Tyrone Taylor
Designated Hitters
Seiya Suzuki
Brewers
VS
Cubs
Batting
140
Team Games Played
140
4752
At Bats
4832
1221
Hits
1217
664
Runs Batted In
709
130
Home Runs
197
136
Stolen Bases
101
.257
Batting Average
.252
704
Runs
751
246
Doubles
237
22
Triples
22
1901
Total Bases
2089
578
Walks
591
1166
Strikeouts
1188
.340
On Base Percentage
.340
.400
Slugging Percentage
.432
.740
OBP Pct + SLG Pct
.772
140
Games Played
140
140
Games Started
140
37
Hit By Pitch
71
0.0
Wins Above Replacement
0.0
0.0
Offensive Wins Above Replacement
0.0
44
Caught Stealing
18
1
Is Qualified
1
672.5
Runs Created
734.9
4.9
Runs Created Per 27 Outs
5.3
.106
Walks Per Plate Appearance
.107
0.50
Walk To Strikeout Ratio
0.50
.143
Isolated Power
.180
.284
Secondary Average
.320
4.00
Pitches Per Plate Appearance
3.96
398
Extra Base Hits
456
5443
Plate Appearances
5539
36.6
At Bats Per Home Run
24.5
31
Sacrifice Hit
6
38
Sacrifice Flies
38
Pitching
140
Team Games Played
140
48
Quality Starts
44
87
Wins
78
53
Losses
62
44
Saves
29
76
Holds
49
1026
Hits
1163
484
Earned runs
585
147
Home Runs
212
445
Walks
422
1340
Strikeouts
1082
9.6
Strikeouts Per 9 Innings
7.8
145.7
Pitches Per Start
145.2
1.18
Walks Plus Hits Per Inning Pitched
1.27
3.48
Earned Run Average
4.21
53
Losses
62
1251.2
Innings pitched
1251.2
.621
Win Percentage
.557
62
Save Opportunities
53
.221
Opponent Batting Average
.246
.296
Opponent's On-base pct.
.313
.362
Opponent's Slugging pct.
.419
.658
Opponent's OPB Pct + SLG Pct
.733
4638
At Bats
4734
185
Doubles
166
14
Triples
10
56
Batters Hit
55
61
Stolen Bases
76
140
Games Played
140
1
Complete Games
0
9
Shutouts
6
45
Wild Pitches
30
510
Runs Batted In
598
6
Balks
3
1251.2
Innings pitched
1251.2
9.6
Strikeouts Per 9 Innings
7.8
29
Caught Stealing
28
140
Games Started
140
0.0
Wins Above Replacement
0.0
1
Is Qualified
1
532
Runs
619
484
Earned Runs
585
1680
Total Bases
1985
Fielding
140
Team Games Played
140
1252
Full Innings
1252
4921
Total Chances
5130
3755
Putouts
3755
1102
Assists
1323
64
Errors
52
246
Double Plays
237
0.987
Fielding Percentage
0.990
34.9
Range Factor
36.5
0.0
Zone Rating
0.0
140
Games Played
140
0
Games Started
0
0.0
Defensive Wins Above Replacement
0.0
1
Qualified
1