

Brewers vs Mets Live Score (27 Aug, 2026)
Game Information
Stage
STD
Season
2026
First Pitch
Thu, Aug 27, 7:10 pm
Venue
Citi Field
Location
Queens, New York
Venue Type
Outdoor
Broadcast
MLB.TV
Attendance
26,611
Live Situation
0Balls
0Strikes
0Outs
—Pitcher
—At Bat
Pitch Sequence
1
BALL IN PLAY
Cutter
91 MPH
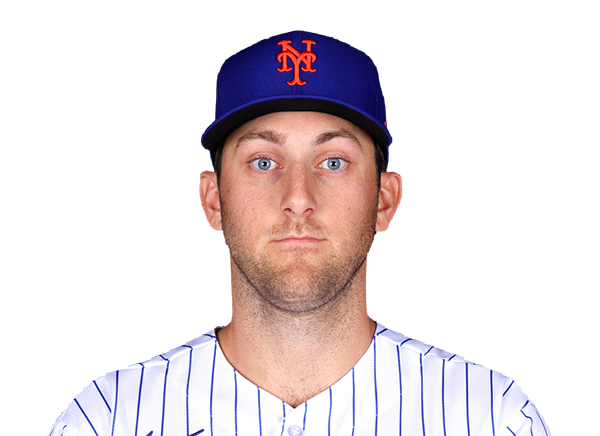
Injury Report
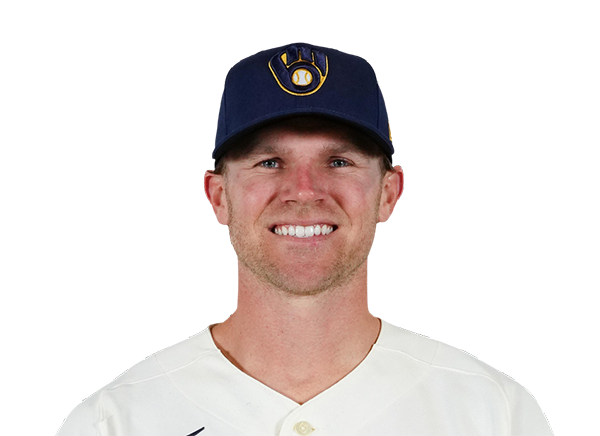
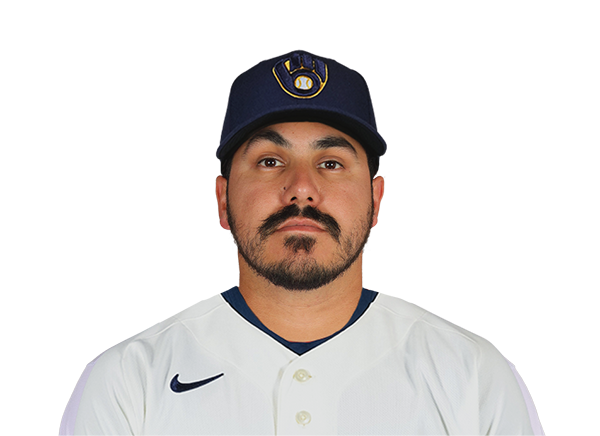
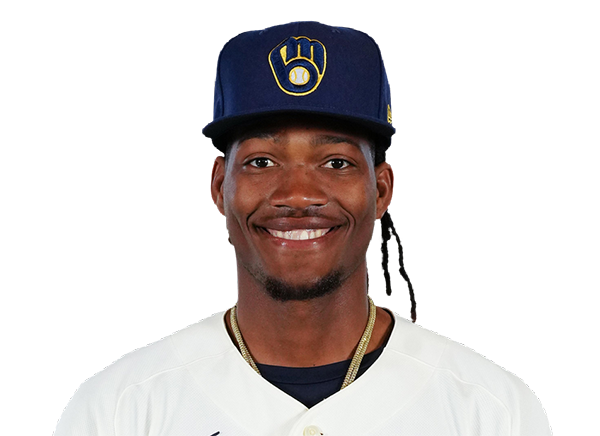

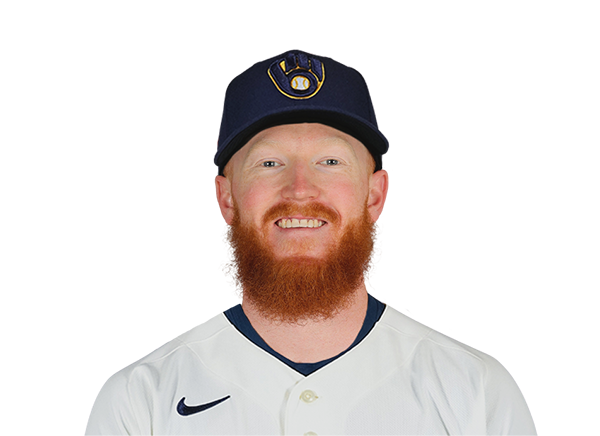
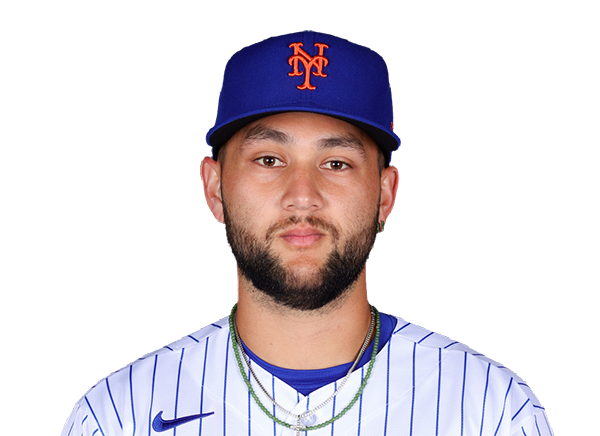
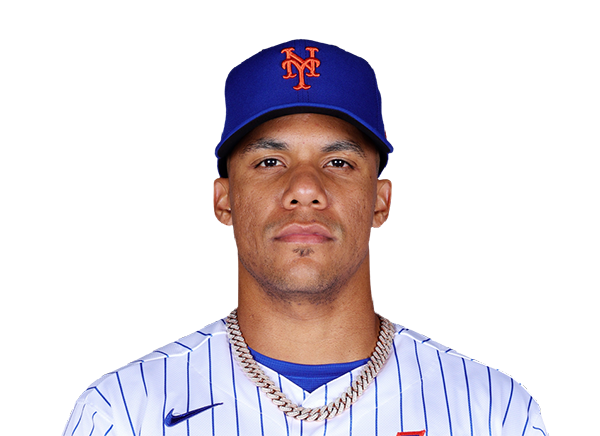
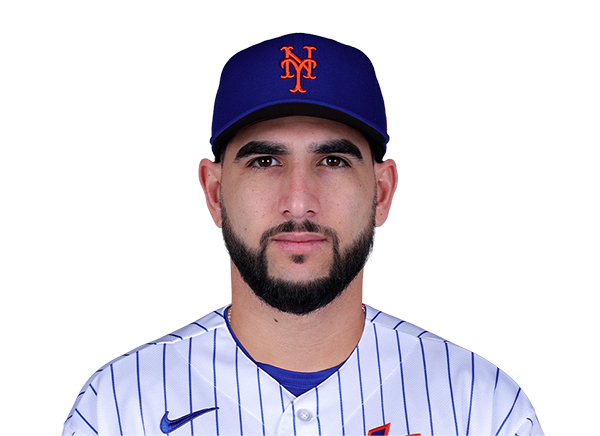
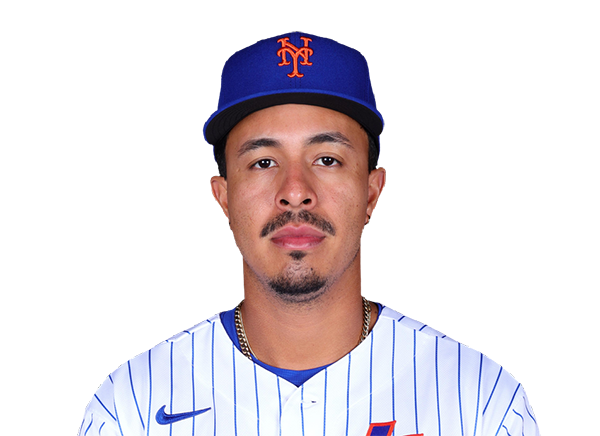
Team Stats
 MIL
NYM


8
Runs
2
12
Hits
3
1
Errors
1
2
Home Runs
0
2
Walks
3
7
Strikeouts
9
Player Box Score
Milwaukee Brewers
| Player | H-AB | AB | R | H | RBI | HR | BB | K | #P | AVG | OBP | SLG |
|---|---|---|---|---|---|---|---|---|---|---|---|---|
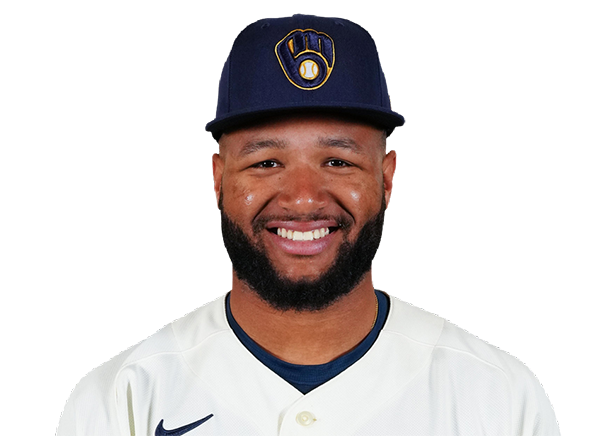 Jackson Chourio | 4-5 | 5 | 4 | 4 | 4 | 2 | 0 | 0 | 17 | .283 | .345 | .477 |
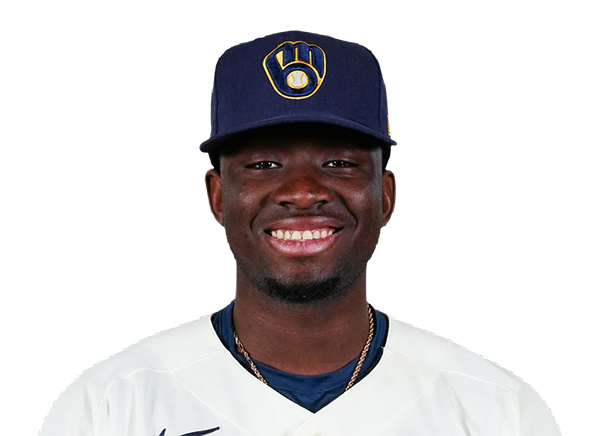 Luis Lara | 1-4 | 4 | 1 | 1 | 0 | 0 | 1 | 2 | 16 | .267 | .341 | .375 |
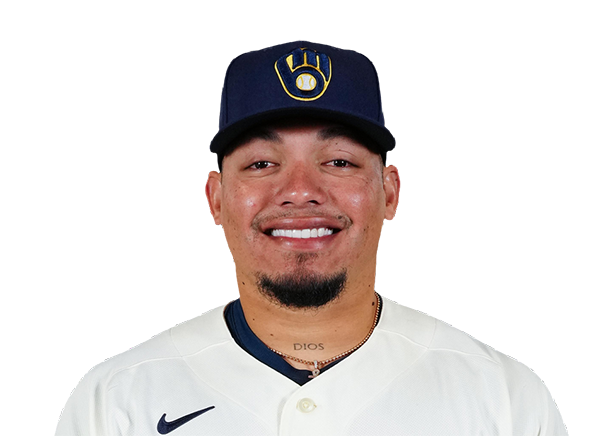 William Contreras | 0-4 | 4 | 0 | 0 | 1 | 0 | 1 | 2 | 22 | .266 | .337 | .390 |
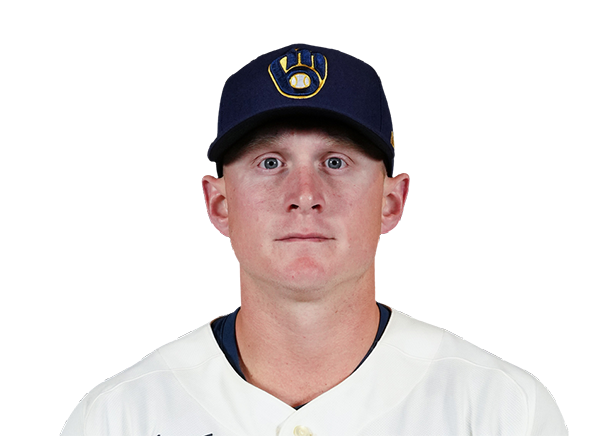 Andrew Vaughn | 2-4 | 4 | 0 | 2 | 1 | 0 | 0 | 0 | 24 | .310 | .399 | .452 |
 Gary Sanchez | 0-5 | 5 | 0 | 0 | 1 | 0 | 0 | 0 | 15 | .205 | .345 | .415 |
 Joey Ortiz | 2-5 | 5 | 1 | 2 | 0 | 0 | 0 | 0 | 24 | .250 | .316 | .382 |
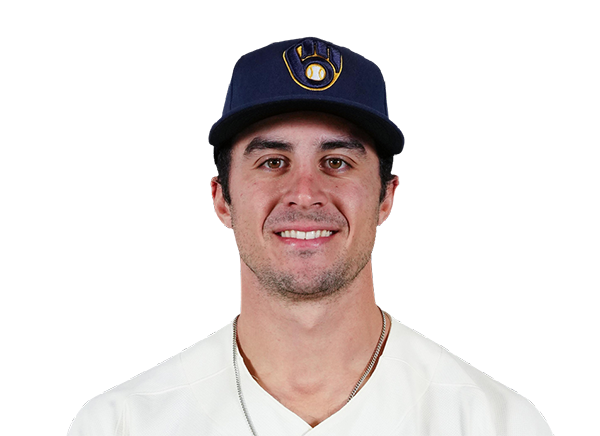 Sal Frelick | 0-5 | 5 | 0 | 0 | 0 | 0 | 0 | 2 | 20 | .239 | .304 | .333 |
 Cooper Pratt | 1-2 | 2 | 1 | 1 | 1 | 0 | 0 | 1 | 12 | .268 | .341 | .353 |
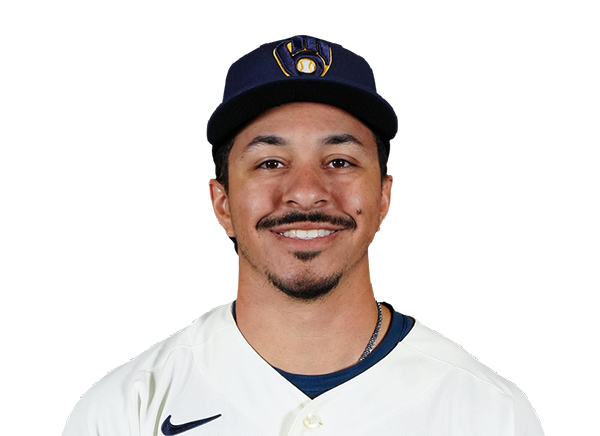 David Hamilton | 2-4 | 4 | 1 | 2 | 0 | 0 | 0 | 0 | 17 | .241 | .316 | .337 |
New York Mets
| Player | H-AB | AB | R | H | RBI | HR | BB | K | #P | AVG | OBP | SLG |
|---|---|---|---|---|---|---|---|---|---|---|---|---|
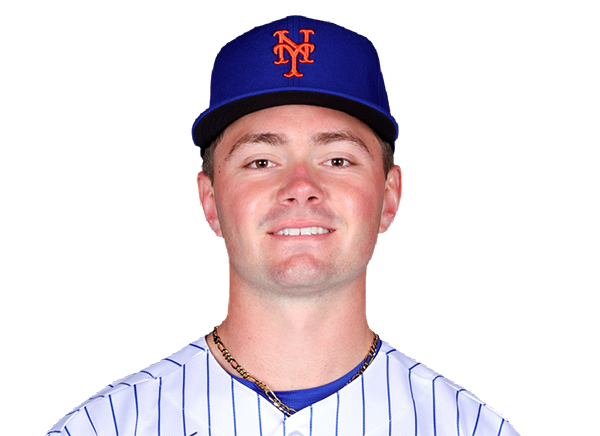 A.J. Ewing | 0-4 | 4 | 0 | 0 | 0 | 0 | 0 | 1 | 13 | .240 | .312 | .355 |
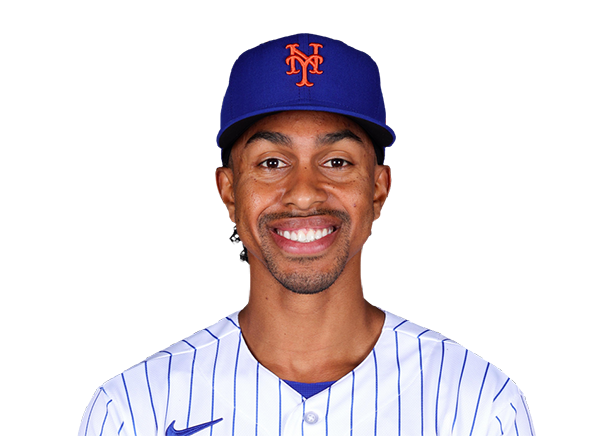 Francisco Lindor | 0-4 | 4 | 0 | 0 | 0 | 0 | 0 | 3 | 17 | .233 | .320 | .419 |
 Carson Benge | 0-4 | 4 | 0 | 0 | 0 | 0 | 0 | 2 | 17 | .279 | .338 | .426 |
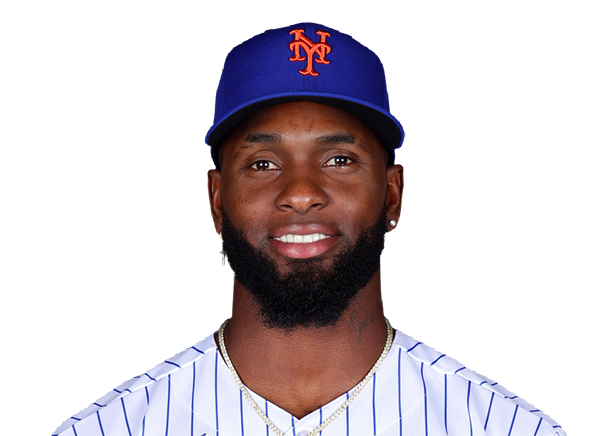 Luis Robert Jr. | 1-3 | 3 | 1 | 1 | 0 | 0 | 1 | 1 | 16 | .234 | .316 | .418 |
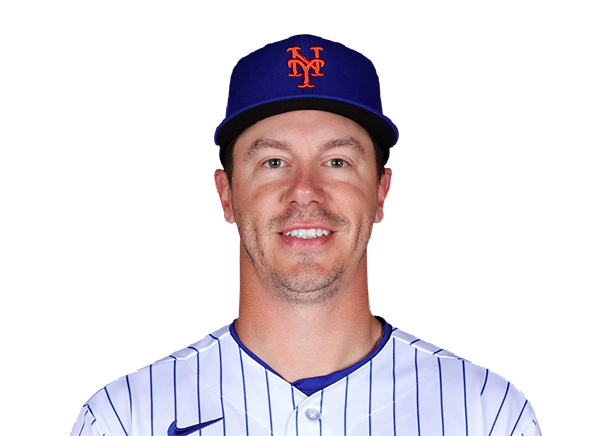 Jared Young | 1-4 | 4 | 1 | 1 | 1 | 0 | 0 | 0 | 18 | .268 | .330 | .440 |
 Marcus Semien | 0-3 | 3 | 0 | 0 | 0 | 0 | 1 | 0 | 12 | .212 | .273 | .346 |
 Brett Baty | 0-3 | 3 | 0 | 0 | 0 | 0 | 0 | 1 | 16 | .221 | .294 | .337 |
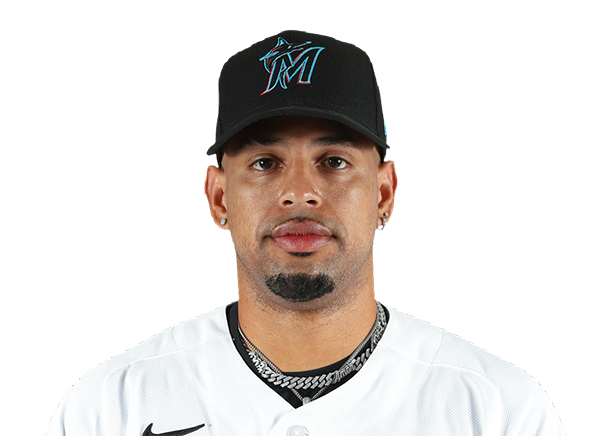 Christopher Morel | 1-2 | 2 | 0 | 1 | 1 | 0 | 1 | 0 | 15 | .167 | .235 | .205 |
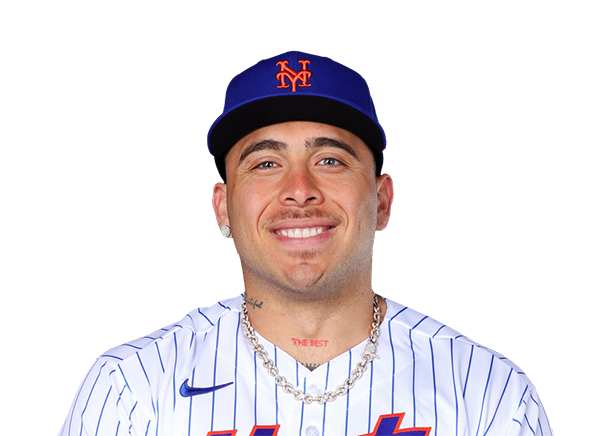 Francisco Alvarez | 0-3 | 3 | 0 | 0 | 0 | 0 | 0 | 1 | 13 | .233 | .321 | .397 |
Milwaukee Brewers
| Player | IP | H | R | ER | BB | K | HR | PC-ST | ERA | PC |
|---|---|---|---|---|---|---|---|---|---|---|
 Jacob Misiorowski | 6.0 | 2 | 2 | 2 | 2 | 6 | 0 | 89-53 | 1.73 | 89 |
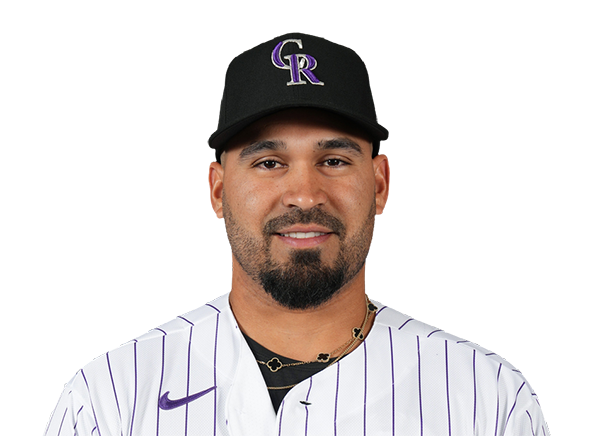 Antonio Senzatela | 1.0 | 0 | 0 | 0 | 1 | 1 | 0 | 27-14 | 3.75 | 27 |
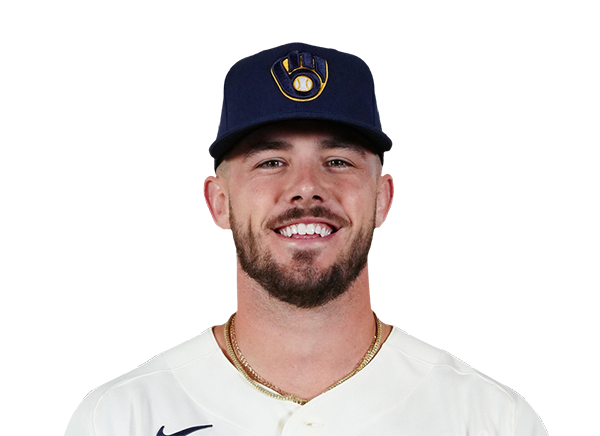 DL Hall | 1.0 | 0 | 0 | 0 | 0 | 2 | 0 | 12-9 | 2.25 | 12 |
 Chad Patrick | 1.0 | 1 | 0 | 0 | 0 | 0 | 0 | 9-8 | 3.30 | 9 |
New York Mets
| Player | IP | H | R | ER | BB | K | HR | PC-ST | ERA | PC |
|---|---|---|---|---|---|---|---|---|---|---|
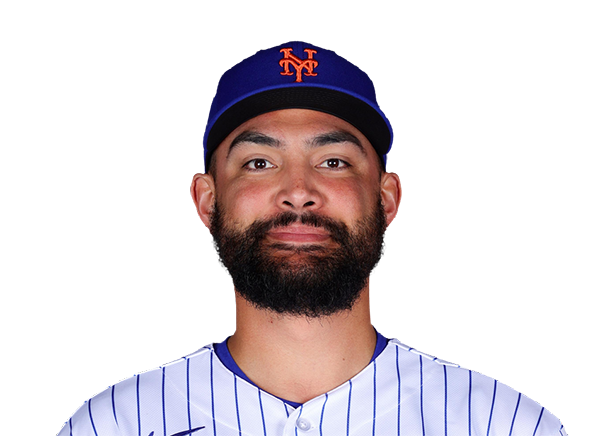 Sean Manaea | 5.2 | 8 | 6 | 6 | 1 | 3 | 1 | 95-63 | 4.55 | 95 |
 Xzavion Curry | 2.1 | 2 | 2 | 2 | 1 | 2 | 1 | 46-31 | 3.44 | 46 |
 Austin Warren | 1.0 | 2 | 0 | 0 | 0 | 2 | 0 | 26-18 | 4.38 | 26 |
H2H / Season Series
NYM2–8
MIL
NYM1–8
MIL
NYM3–2
MIL
MIL4–3
NYM
MIL0–4
NYM
MIL8–3
NYM
Last 5 Games
| Date | Opponent | Result |
|---|---|---|
| Aug 27 | @ NYM | W8–2 |
| Aug 26 | @ NYM | W8–1 |
| Aug 25 | @ NYM | L2–3 |
| Aug 23 |  vs ATL | L2–4 |
| Aug 22 | vs ATL | W4–1 |
| Date | Opponent | Result |
|---|---|---|
| Aug 27 | vs MIL | L2–8 |
| Aug 26 | vs MIL | L1–8 |
| Aug 25 | vs MIL | W3–2 |
| Aug 23 |  @ CHW | L1–2 |
| Aug 22 | @ CHW | W10–5 |
Standings
American League
| Team | W | L | PCT | GB | DIFF | STRK |
|---|---|---|---|---|---|---|
1 Rays | 79 | 54 | .594 | - | +47 | W1 |
| 2White Sox | 70 | 63 | .526 | 9 | +44 | W2 |
3 Astros | 67 | 67 | .500 | 12.5 | -44 | W1 |
4 Yankees | 75 | 58 | .564 | 4 | +100 | L1 |
5 Red Sox | 73 | 60 | .549 | 6 | +101 | L1 |
6 Guardians | 68 | 66 | .507 | 11.5 | -4 | W7 |
7 Rangers | 66 | 68 | .493 | 13.5 | -47 | L2 |
8 Orioles | 65 | 69 | .485 | 14.5 | -24 | L1 |
9 Blue Jays | 65 | 70 | .481 | 15 | -65 | L1 |
10 Mariners | 64 | 70 | .478 | 15.5 | -57 | L1 |
11 Twins | 64 | 70 | .478 | 15.5 | -56 | L2 |
12 Tigers | 62 | 71 | .466 | 17 | +70 | L1 |
13 Royals | 60 | 75 | .444 | 20 | -81 | W1 |
14 Athletics | 53 | 81 | .396 | 26.5 | -185 | W2 |
15 Angels | 52 | 82 | .388 | 27.5 | -75 | L4 |
National League
| Team | W | L | PCT | GB | DIFF | STRK |
|---|---|---|---|---|---|---|
| 1Brewers | 83 | 51 | .619 | - | +173 | W2 |
2 Dodgers | 80 | 54 | .597 | 3 | +148 | L3 |
| 3Braves | 79 | 55 | .590 | 4 | +113 | W4 |
4 Cubs | 76 | 58 | .567 | 7 | +119 | L2 |
5 Phillies | 74 | 60 | .552 | 9 | +23 | W1 |
6 Padres | 72 | 62 | .537 | 11 | +17 | W1 |
7 Diamondbacks | 71 | 64 | .526 | 12.5 | 0 | L1 |
8 Marlins | 68 | 66 | .507 | 15 | +19 | W1 |
9 Cardinals | 67 | 68 | .496 | 16.5 | -13 | W1 |
10 Pirates | 65 | 70 | .481 | 18.5 | +24 | L1 |
11 Reds | 63 | 71 | .470 | 20 | -100 | W1 |
12 Nationals | 63 | 73 | .463 | 21 | +12 | W1 |
| 13Mets | 60 | 74 | .448 | 23 | -52 | L2 |
14 Giants | 55 | 79 | .410 | 28 | -69 | W1 |
15 Rockies | 52 | 82 | .388 | 31 | -138 | L1 |
MIL
VS
NYM
Pitchers
Jacob Misiorowski
Antonio Senzatela
DL Hall
Chad Patrick
Catchers
Gary Sanchez
Infielders
Andrew Vaughn
Joey Ortiz
Cooper Pratt
David Hamilton
Outfielders
Jackson Chourio
Luis Lara
Sal Frelick
Designated Hitters
William Contreras
Pitchers
Sean Manaea
Xzavion Curry
Austin Warren
Catchers
Francisco Alvarez
Infielders
Francisco Lindor
Jared Young
Marcus Semien
Brett Baty
Outfielders
A.J. Ewing
Carson Benge
Luis Robert Jr.
Designated Hitters
Christopher Morel
Brewers
VS
Mets
Batting
134
Team Games Played
134
4542
At Bats
4505
1157
Hits
1063
629
Runs Batted In
528
123
Home Runs
163
133
Stolen Bases
71
.255
Batting Average
.236
668
Runs
552
234
Doubles
167
22
Triples
17
1804
Total Bases
1753
553
Walks
428
1117
Strikeouts
1136
.338
On Base Percentage
.306
.397
Slugging Percentage
.389
.735
OBP Pct + SLG Pct
.695
134
Games Played
134
134
Games Started
134
35
Hit By Pitch
42
0.0
Wins Above Replacement
0.0
0.0
Offensive Wins Above Replacement
0.0
42
Caught Stealing
29
1
Is Qualified
1
635.7
Runs Created
539.4
4.8
Runs Created Per 27 Outs
4.0
.106
Walks Per Plate Appearance
.085
0.50
Walk To Strikeout Ratio
0.38
.142
Isolated Power
.153
.284
Secondary Average
.257
4.00
Pitches Per Plate Appearance
3.93
379
Extra Base Hits
347
5203
Plate Appearances
5026
36.9
At Bats Per Home Run
27.6
30
Sacrifice Hit
16
36
Sacrifice Flies
31
Pitching
134
Team Games Played
134
47
Quality Starts
39
83
Wins
60
51
Losses
74
43
Saves
25
68
Holds
58
974
Hits
1080
450
Earned runs
545
132
Home Runs
148
423
Walks
479
1293
Strikeouts
1205
9.7
Strikeouts Per 9 Innings
9.1
145.3
Pitches Per Start
149.1
1.17
Walks Plus Hits Per Inning Pitched
1.31
3.38
Earned Run Average
4.11
51
Losses
74
1198.2
Innings pitched
1193.2
.619
Win Percentage
.448
61
Save Opportunities
40
.220
Opponent Batting Average
.239
.294
Opponent's On-base pct.
.319
.355
Opponent's Slugging pct.
.395
.650
Opponent's OPB Pct + SLG Pct
.714
4428
At Bats
4524
177
Doubles
222
13
Triples
20
52
Batters Hit
68
60
Stolen Bases
61
134
Games Played
134
1
Complete Games
0
9
Shutouts
5
45
Wild Pitches
33
474
Runs Batted In
578
6
Balks
3
1198.2
Innings pitched
1193.2
9.7
Strikeouts Per 9 Innings
9.1
29
Caught Stealing
28
134
Games Started
134
0.0
Wins Above Replacement
0.0
1
Is Qualified
1
495
Runs
604
450
Earned Runs
545
1573
Total Bases
1786
Fielding
134
Team Games Played
134
1199
Full Innings
1194
4706
Total Chances
4724
3596
Putouts
3581
1050
Assists
1061
60
Errors
82
234
Double Plays
167
0.987
Fielding Percentage
0.983
34.9
Range Factor
35.0
0.0
Zone Rating
0.0
134
Games Played
134
0
Games Started
0
0.0
Defensive Wins Above Replacement
0.0
1
Qualified
1