

Brewers vs Nationals Live Score (3 May, 2026)
Game Information
Stage
Standard
Season
2026
First Pitch
Sun, May 3, 1:35 pm
Venue
Nationals Park
Location
Washington, District of Columbia
Attendance
17,220
Live Situation
2Balls
3Strikes
0Outs
—Pitcher
—At Bat
Pitch Sequence
1
STRIKE LOOKING
Four-seam FB
92 MPH
2
STRIKE FOUL
Four-seam FB
90 MPH
3
STRIKE FOUL
Sweeper
82 MPH
4
BALL
Four-seam FB
91 MPH
5
BALL
Four-seam FB
91 MPH
6
STRIKE SWINGING
Sweeper
81 MPH
Injury Report

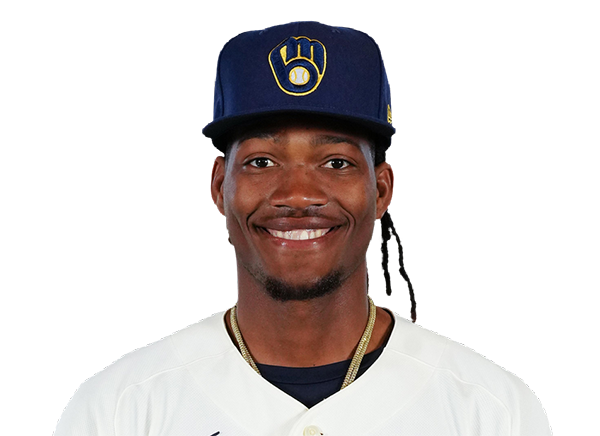
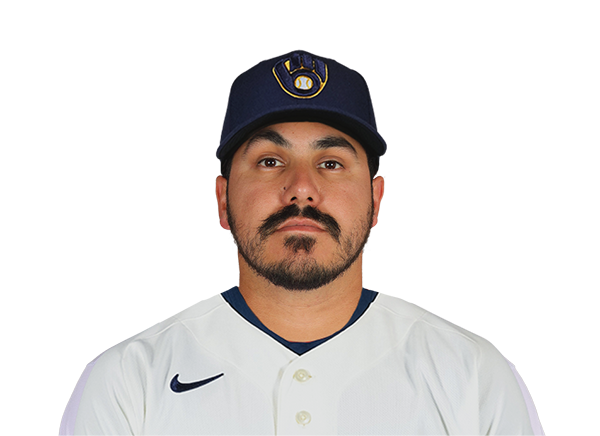
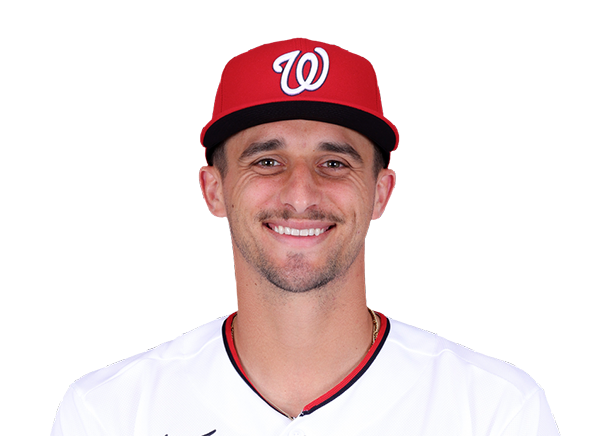
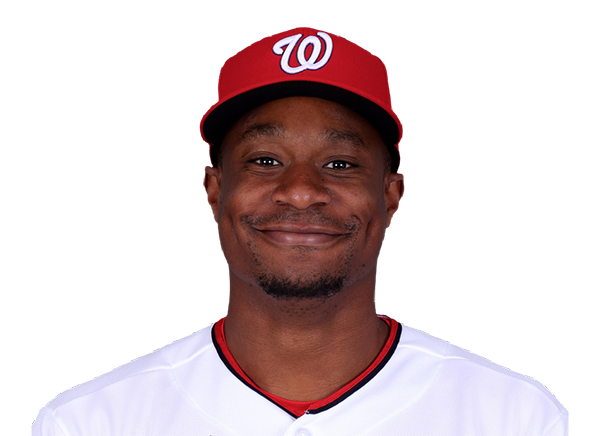
Team Stats
 MIL
WSH


2
Runs
3
4
Hits
7
0
Errors
0
0
Home Runs
0
2
Walks
1
6
Strikeouts
9
Player Box Score
Milwaukee Brewers
| Player | H-AB | AB | R | H | RBI | HR | BB | K | #P | AVG | OBP | SLG |
|---|---|---|---|---|---|---|---|---|---|---|---|---|
 Luis Rengifo | 0-4 | 4 | 0 | 0 | 0 | 0 | 0 | 0 | 11 | .186 | .252 | .268 |
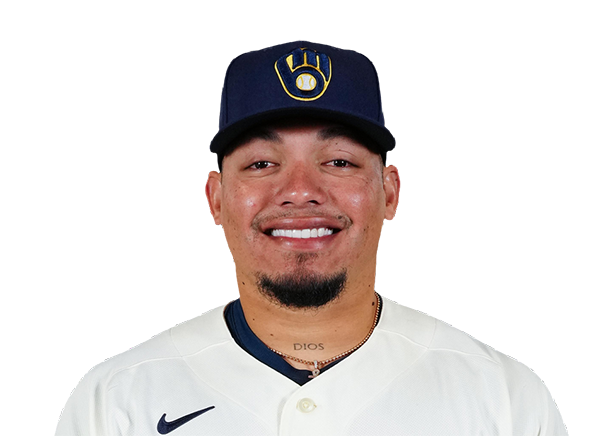 William Contreras | 0-4 | 4 | 0 | 0 | 0 | 0 | 0 | 0 | 14 | .298 | .370 | .427 |
 Gary Sanchez | 1-4 | 4 | 0 | 1 | 0 | 0 | 0 | 0 | 20 | .211 | .364 | .479 |
 Blake Perkins | 0-0 | 0 | 1 | 0 | 0 | 0 | 0 | 0 | 0 | .109 | .212 | .174 |
 Jake Bauers | 1-4 | 4 | 0 | 1 | 0 | 0 | 0 | 1 | 12 | .243 | .317 | .423 |
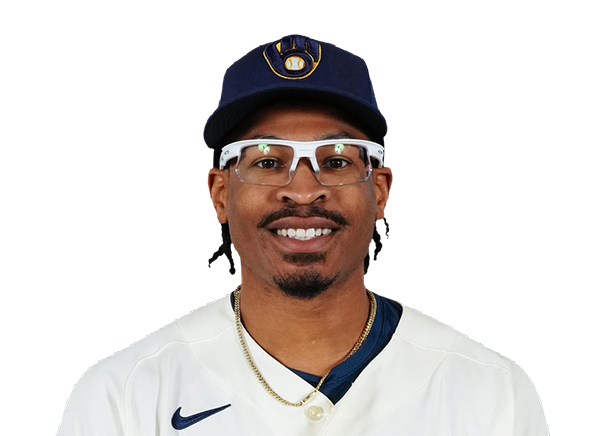 Greg Jones | 0-0 | 0 | 0 | 0 | 0 | 0 | 0 | 0 | 0 | .095 | .095 | .095 |
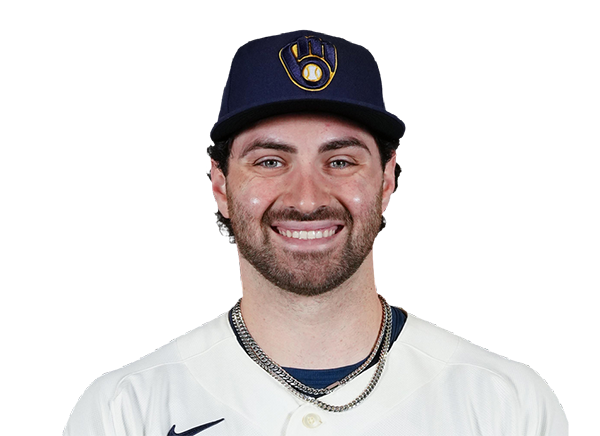 Garrett Mitchell | 0-3 | 3 | 0 | 0 | 1 | 0 | 1 | 1 | 20 | .231 | .381 | .352 |
 Brandon Lockridge | 2-4 | 4 | 1 | 2 | 0 | 0 | 0 | 1 | 14 | .280 | .359 | .329 |
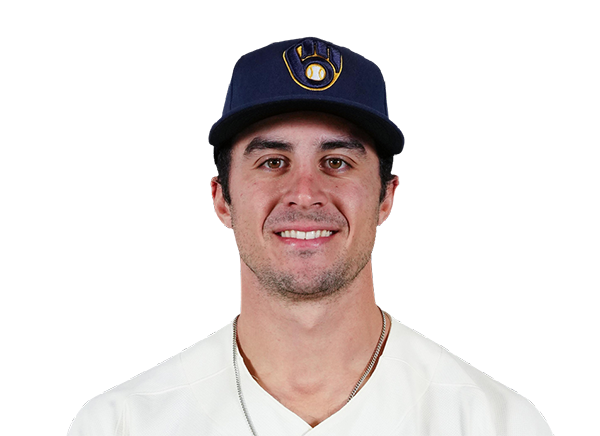 Sal Frelick | 0-2 | 2 | 0 | 0 | 0 | 0 | 1 | 0 | 11 | .208 | .305 | .317 |
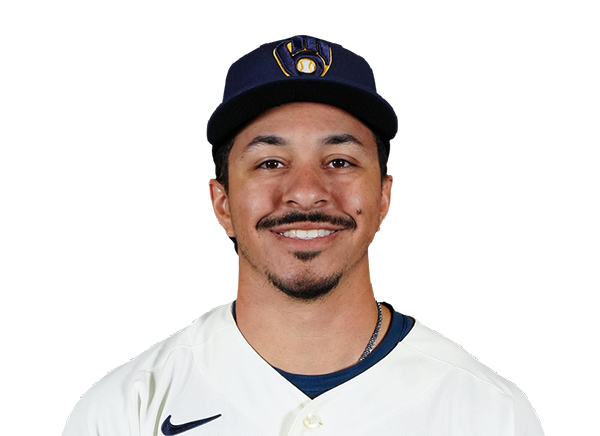 David Hamilton | 0-2 | 2 | 0 | 0 | 0 | 0 | 0 | 2 | 10 | .247 | .351 | .272 |
 Joey Ortiz | 0-2 | 2 | 0 | 0 | 1 | 0 | 0 | 1 | 9 | .181 | .259 | .181 |
Washington Nationals
| Player | H-AB | AB | R | H | RBI | HR | BB | K | #P | AVG | OBP | SLG |
|---|---|---|---|---|---|---|---|---|---|---|---|---|
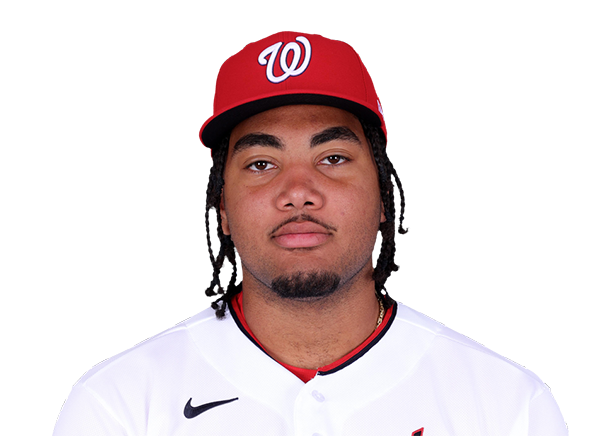 James Wood | 0-4 | 4 | 0 | 0 | 0 | 0 | 0 | 1 | 8 | .231 | .383 | .507 |
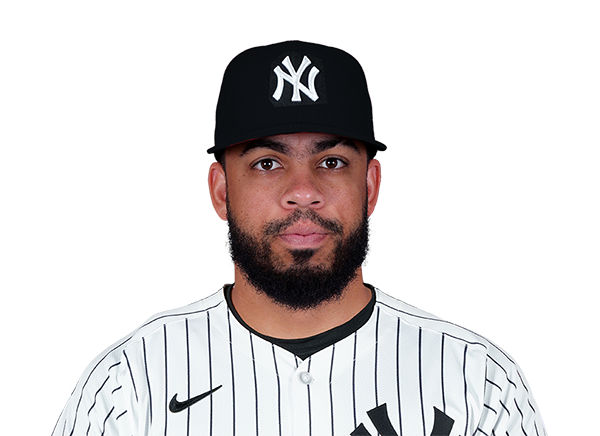 Luis Garcia Jr. | 0-2 | 2 | 0 | 0 | 0 | 0 | 0 | 1 | 7 | .234 | .259 | .336 |
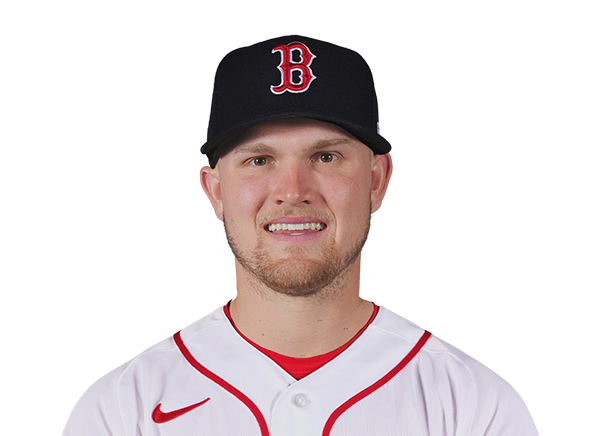 Curtis Mead | 0-1 | 1 | 0 | 0 | 0 | 0 | 1 | 1 | 10 | .211 | .309 | .451 |
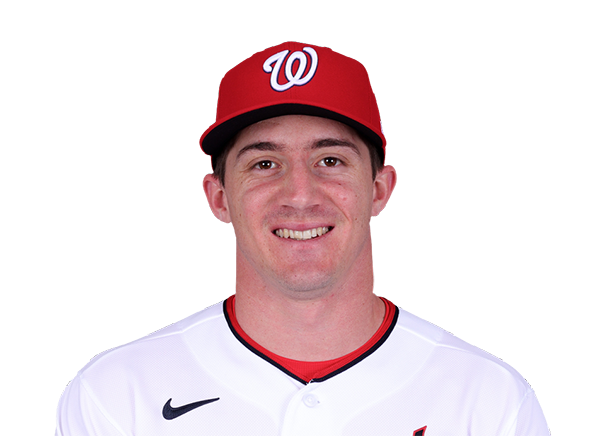 Jacob Young | 0-4 | 4 | 0 | 0 | 0 | 0 | 0 | 3 | 15 | .232 | .271 | .330 |
 CJ Abrams | 2-4 | 4 | 2 | 2 | 0 | 0 | 0 | 1 | 14 | .297 | .406 | .534 |
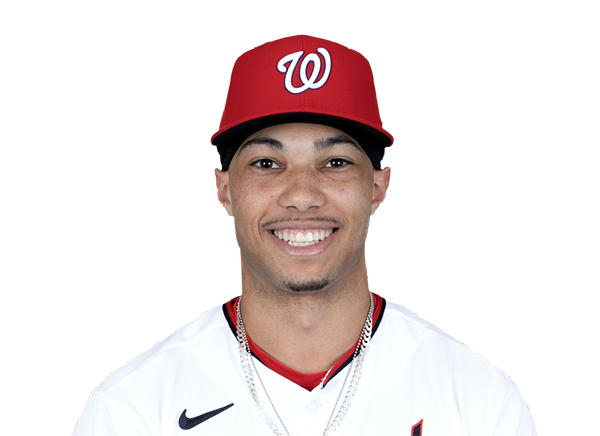 Daylen Lile | 0-3 | 3 | 0 | 0 | 0 | 0 | 0 | 1 | 16 | .246 | .311 | .370 |
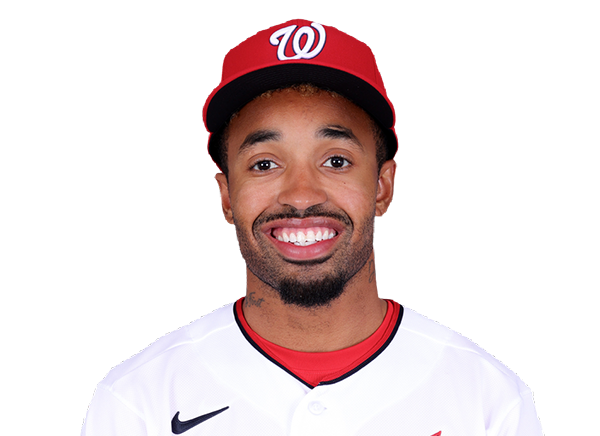 Nasim Nunez | 2-3 | 3 | 1 | 2 | 2 | 0 | 0 | 0 | 11 | .222 | .325 | .232 |
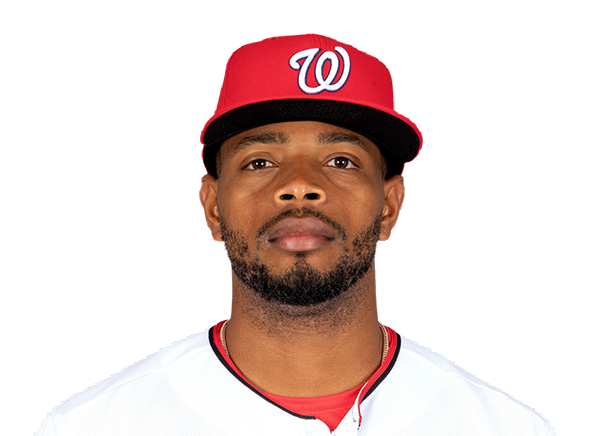 Jose Tena | 1-2 | 2 | 0 | 1 | 1 | 0 | 0 | 1 | 9 | .268 | .317 | .393 |
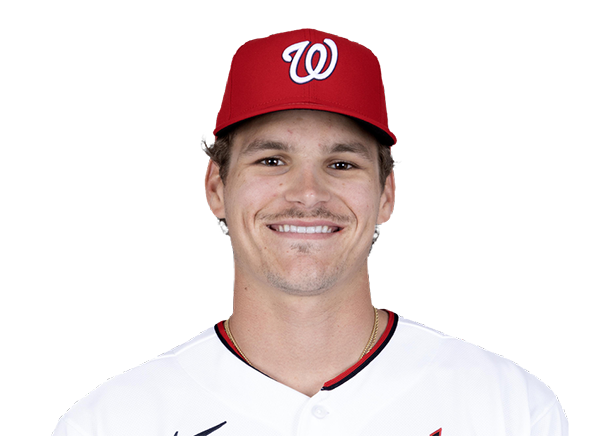 Brady House | 1-1 | 1 | 0 | 1 | 0 | 0 | 0 | 0 | 1 | .229 | .289 | .364 |
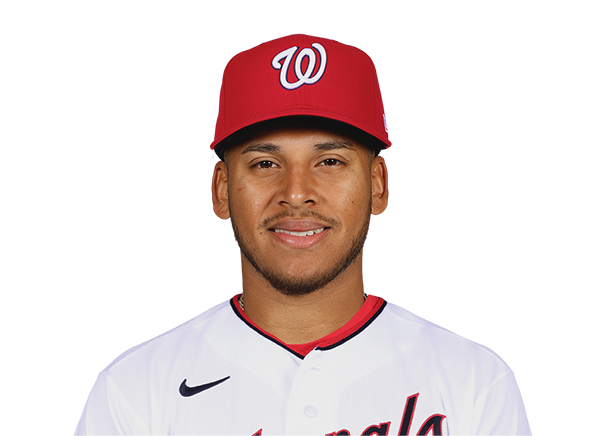 Jorbit Vivas | 0-3 | 3 | 0 | 0 | 0 | 0 | 0 | 0 | 8 | .261 | .350 | .304 |
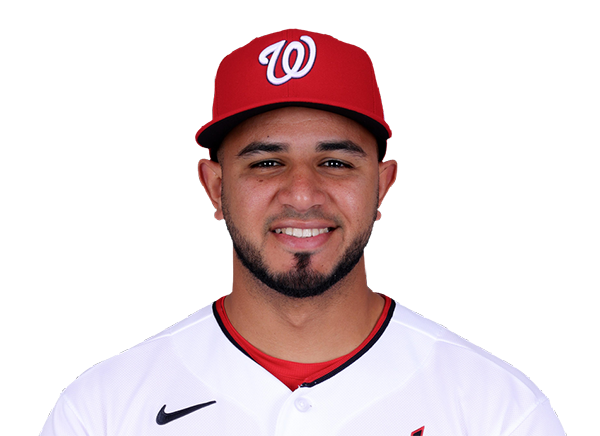 Keibert Ruiz | 1-3 | 3 | 0 | 1 | 0 | 0 | 0 | 0 | 5 | .194 | .215 | .323 |
Milwaukee Brewers
| Player | IP | H | R | ER | BB | K | HR | PC-ST | ERA | PC |
|---|---|---|---|---|---|---|---|---|---|---|
 Logan Henderson | 6.0 | 3 | 2 | 2 | 0 | 8 | 0 | 76-56 | 4.50 | 76 |
 Brian Fitzpatrick | 1.1 | 4 | 1 | 1 | 0 | 0 | 0 | 16-12 | 2.45 | 16 |
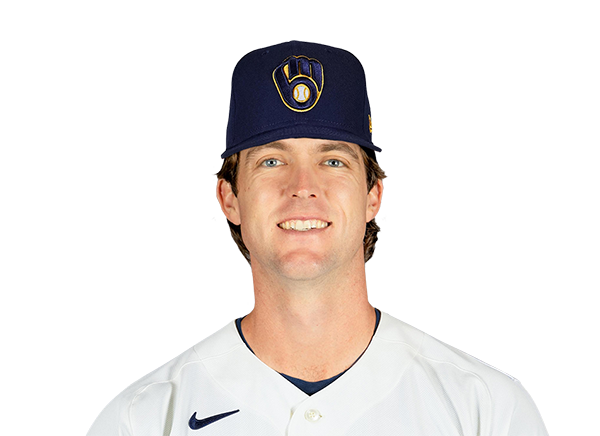 Jake Woodford | 0.2 | 0 | 0 | 0 | 1 | 1 | 0 | 12-6 | 4.11 | 12 |
Washington Nationals
| Player | IP | H | R | ER | BB | K | HR | PC-ST | ERA | PC |
|---|---|---|---|---|---|---|---|---|---|---|
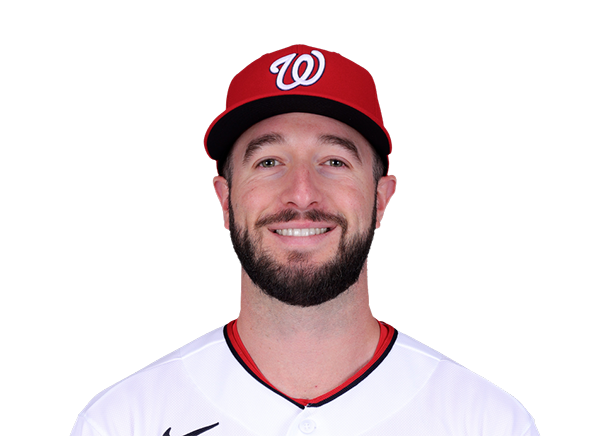 PJ Poulin | 2.0 | 1 | 0 | 0 | 1 | 2 | 0 | 36-23 | 3.63 | 36 |
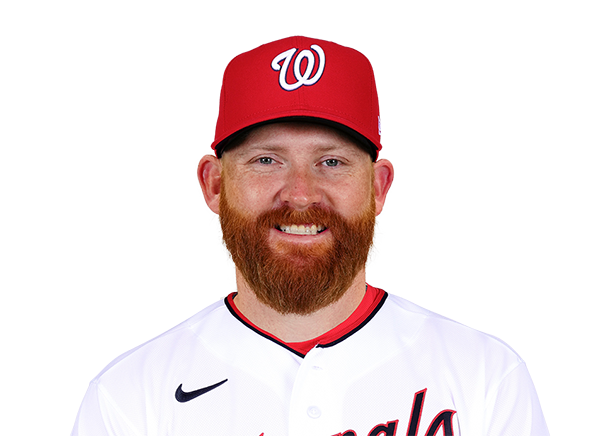 Zack Littell | 3.2 | 1 | 1 | 1 | 1 | 1 | 0 | 41-23 | 7.24 | 41 |
 Mitchell Parker | 2.0 | 0 | 0 | 0 | 0 | 2 | 0 | 23-14 | 4.05 | 23 |
 Gus Varland | 0.2 | 1 | 1 | 1 | 0 | 0 | 0 | 9-5 | 3.38 | 9 |
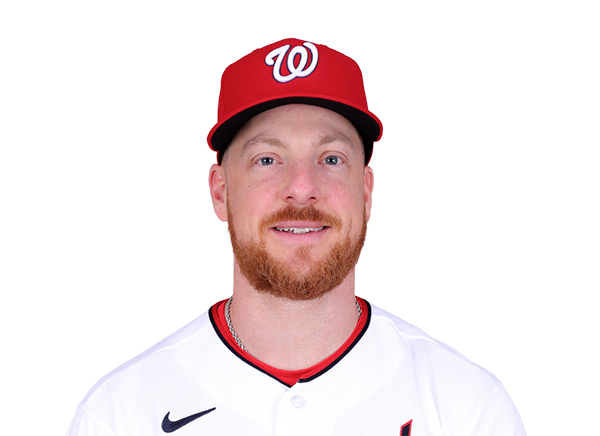 Richard Lovelady | 0.2 | 1 | 0 | 0 | 0 | 1 | 0 | 12-9 | 2.51 | 12 |
H2H / Season Series
WSH3–2
MIL
WSH1–4
MIL
WSH1–6
MIL
MIL6–8
WSH
MIL1–3
WSH
MIL3–7
WSH
Last 5 Games
| Date | Opponent | Result |
|---|---|---|
| Aug 23 |  vs ATL | L2–4 |
| Aug 22 | vs ATL | W4–1 |
| Aug 21 | vs ATL | W2–1 |
| Aug 20 |  vs SEA | W7–4 |
| Aug 19 | vs SEA | L5–7 |
| Date | Opponent | Result |
|---|---|---|
| Aug 23 |  @ MIA | L2–6 |
| Aug 22 | @ MIA | L2–4 |
| Aug 21 | @ MIA | L2–3 |
| Aug 20 |  @ TEX | L0–2 |
| Aug 19 | @ TEX | W6–0 |
Standings
American League
| Team | W | L | PCT | GB | DIFF | STRK |
|---|---|---|---|---|---|---|
1 Rays | 77 | 53 | .592 | - | +44 | W1 |
2 White Sox | 68 | 62 | .523 | 9 | +43 | W1 |
3 Astros | 65 | 66 | .496 | 12.5 | -44 | L2 |
4 Yankees | 74 | 56 | .569 | 3 | +100 | W1 |
5 Red Sox | 71 | 59 | .546 | 6 | +99 | W3 |
| 6Rangers | 65 | 66 | .496 | 12.5 | -46 | W1 |
7 Guardians | 65 | 66 | .496 | 12.5 | -9 | W4 |
8 Blue Jays | 64 | 68 | .485 | 14 | -55 | L1 |
9 Twins | 63 | 68 | .481 | 14.5 | -54 | L3 |
10 Orioles | 63 | 68 | .481 | 14.5 | -35 | L1 |
| 11Mariners | 62 | 69 | .473 | 15.5 | -61 | L1 |
12 Tigers | 61 | 69 | .469 | 16 | +73 | L5 |
13 Royals | 58 | 74 | .439 | 20 | -91 | W8 |
14 Angels | 52 | 79 | .397 | 25.5 | -70 | L1 |
15 Athletics | 51 | 80 | .389 | 26.5 | -187 | W2 |
National League
| Team | W | L | PCT | GB | DIFF | STRK |
|---|---|---|---|---|---|---|
| 1Brewers | 81 | 49 | .623 | - | +163 | W3 |
2 Dodgers | 80 | 51 | .611 | 1.5 | +151 | W6 |
| 3Braves | 75 | 55 | .577 | 6 | +108 | L2 |
4 Cubs | 75 | 56 | .573 | 6.5 | +115 | W1 |
5 Phillies | 73 | 58 | .557 | 8.5 | +27 | W9 |
6 Padres | 71 | 60 | .542 | 10.5 | +16 | W3 |
7 Diamondbacks | 69 | 62 | .527 | 12.5 | +9 | W1 |
| 8Marlins | 67 | 64 | .511 | 14.5 | +21 | W3 |
9 Cardinals | 66 | 66 | .500 | 16 | -2 | L3 |
10 Pirates | 63 | 69 | .477 | 19 | +25 | L3 |
11 Reds | 62 | 69 | .473 | 19.5 | -94 | L1 |
| 12Nationals | 61 | 71 | .462 | 21 | +10 | L4 |
13 Mets | 59 | 72 | .450 | 22.5 | -40 | L1 |
14 Giants | 52 | 78 | .400 | 29 | -80 | L4 |
15 Rockies | 50 | 80 | .385 | 31 | -136 | L6 |
MIL
VS
WSH
Pitchers
Logan Henderson
Brian Fitzpatrick
Jake Woodford
Catchers
William Contreras
Infielders
Luis Rengifo
Jake Bauers
David Hamilton
Joey Ortiz
Outfielders
Garrett Mitchell
Brandon Lockridge
Sal Frelick
Designated Hitters
Gary Sanchez
Other Players
Blake Perkins
Greg Jones
Pitchers
PJ Poulin
Zack Littell
Mitchell Parker
Gus Varland
Richard Lovelady
Catchers
Keibert Ruiz
Infielders
Luis Garcia Jr.
Curtis Mead
CJ Abrams
Nasim Nunez
Jorbit Vivas
Outfielders
James Wood
Jacob Young
Daylen Lile
Designated Hitters
Jose Tena
Brady House
Brewers
VS
Nationals
Batting
131
Team Games Played
132
4428
At Bats
4513
1123
Hits
1118
611
Runs Batted In
652
120
Home Runs
183
129
Stolen Bases
139
.254
Batting Average
.248
650
Runs
682
229
Doubles
222
21
Triples
26
1754
Total Bases
1941
543
Walks
455
1095
Strikeouts
1101
.337
On Base Percentage
.324
.396
Slugging Percentage
.430
.733
OBP Pct + SLG Pct
.754
131
Games Played
132
0
Games Started
0
33
Hit By Pitch
65
0.0
Wins Above Replacement
0.0
0.0
Offensive Wins Above Replacement
0.0
41
Caught Stealing
31
1
Is Qualified
1
617.2
Runs Created
650.0
4.8
Runs Created Per 27 Outs
5.0
.107
Walks Per Plate Appearance
.090
0.50
Walk To Strikeout Ratio
0.41
.143
Isolated Power
.182
.285
Secondary Average
.307
4.00
Pitches Per Plate Appearance
3.82
370
Extra Base Hits
431
5076
Plate Appearances
5080
36.9
At Bats Per Home Run
24.7
30
Sacrifice Hit
15
35
Sacrifice Flies
29
Pitching
131
Team Games Played
132
46
Quality Starts
29
81
Wins
61
50
Losses
71
43
Saves
33
68
Holds
67
951
Hits
1158
445
Earned runs
609
130
Home Runs
180
415
Walks
467
1269
Strikeouts
1013
9.8
Strikeouts Per 9 Innings
7.8
0.0
Pitches Per Start
0.0
1.17
Walks Plus Hits Per Inning Pitched
1.39
3.42
Earned Run Average
4.68
50
Losses
71
1171.1
Innings pitched
1171.0
.618
Win Percentage
.462
61
Save Opportunities
66
.220
Opponent Batting Average
.257
.295
Opponent's On-base pct.
.333
.357
Opponent's Slugging pct.
.429
.651
Opponent's OPB Pct + SLG Pct
.761
4325
At Bats
4504
175
Doubles
211
13
Triples
11
52
Batters Hit
67
57
Stolen Bases
94
131
Games Played
132
1
Complete Games
0
1
Shutouts
0
44
Wild Pitches
46
0
Runs Batted In
0
6
Balks
2
1171.1
Innings pitched
1171.0
9.8
Strikeouts Per 9 Innings
7.8
29
Caught Stealing
28
131
Games Started
132
0.0
Wins Above Replacement
0.0
1
Is Qualified
1
489
Runs
672
442
Earned Runs
603
1542
Total Bases
1931
Fielding
131
Team Games Played
132
1171
Full Innings
1171
4592
Total Chances
4802
3514
Putouts
3513
1020
Assists
1199
58
Errors
90
229
Double Plays
222
0.987
Fielding Percentage
0.981
34.8
Range Factor
36.2
0.0
Zone Rating
0.0
131
Games Played
132
0
Games Started
0
0.0
Defensive Wins Above Replacement
0.0
1
Qualified
1