

Brewers vs Orioles Live Score (18 Sep, 2026)
Game Information
Stage
STD
Season
2026
First Pitch
Fri, Sep 18, 7:05 pm
Venue
Oriole Park at Camden Yards
Location
Baltimore, Maryland
Venue Type
Outdoor
Broadcast
MLB.TV
Attendance
25,304
Live Situation
0Balls
2Strikes
0Outs
—Pitcher
—At Bat
Pitch Sequence
1
STRIKE SWINGING
Sinker
97 MPH
2
STRIKE FOUL
Sinker
97 MPH
3
BALL IN PLAY
Four-seam FB
96 MPH
Injury Report


Team Stats
 MIL
BAL


6
Runs
5
10
Hits
12
0
Errors
0
1
Home Runs
1
6
Walks
3
10
Strikeouts
13
Player Box Score
Milwaukee Brewers
| Player | H-AB | AB | R | H | RBI | HR | BB | K | #P | AVG | OBP | SLG |
|---|---|---|---|---|---|---|---|---|---|---|---|---|
 Jackson Chourio | 2-5 | 5 | 1 | 2 | 3 | 1 | 1 | 1 | 25 | .287 | .345 | .486 |
 Brice Turang | 2-5 | 5 | 1 | 2 | 0 | 0 | 0 | 3 | 22 | .266 | .367 | .441 |
 William Contreras | 1-4 | 4 | 1 | 1 | 1 | 0 | 1 | 1 | 17 | .271 | .342 | .419 |
 Andrew Vaughn | 0-2 | 2 | 0 | 0 | 0 | 0 | 0 | 1 | 5 | .309 | .393 | .449 |
 Jake Bauers | 0-2 | 2 | 0 | 0 | 0 | 0 | 1 | 1 | 14 | .268 | .394 | .494 |
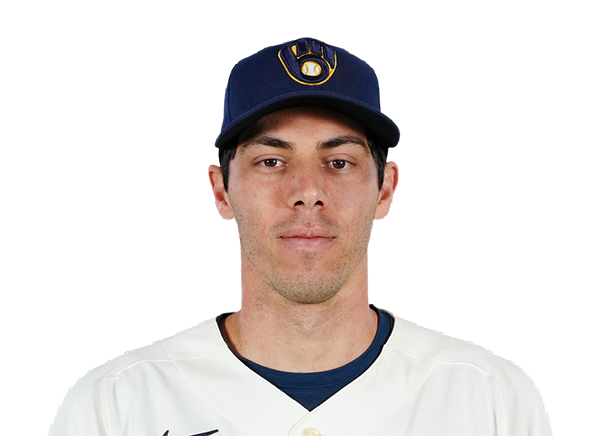 Christian Yelich | 1-5 | 5 | 0 | 1 | 1 | 0 | 0 | 0 | 18 | .239 | .317 | .381 |
 Joey Ortiz | 1-4 | 4 | 1 | 1 | 0 | 0 | 1 | 0 | 24 | .269 | .329 | .402 |
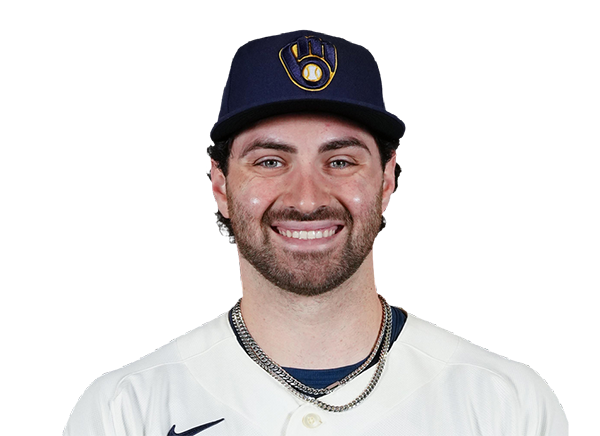 Garrett Mitchell | 0-4 | 4 | 0 | 0 | 0 | 0 | 0 | 2 | 20 | .267 | .358 | .431 |
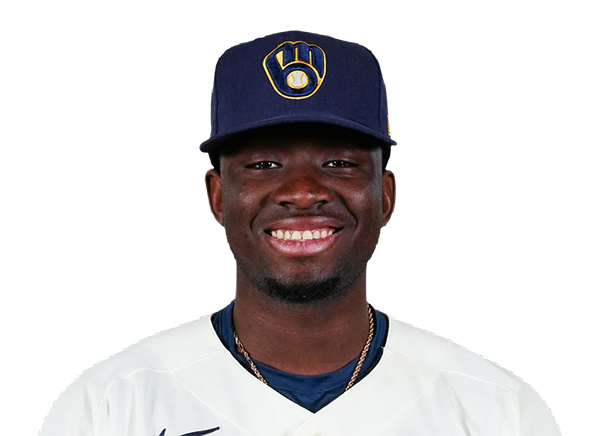 Luis Lara | 1-3 | 3 | 1 | 1 | 0 | 0 | 0 | 0 | 8 | .256 | .323 | .343 |
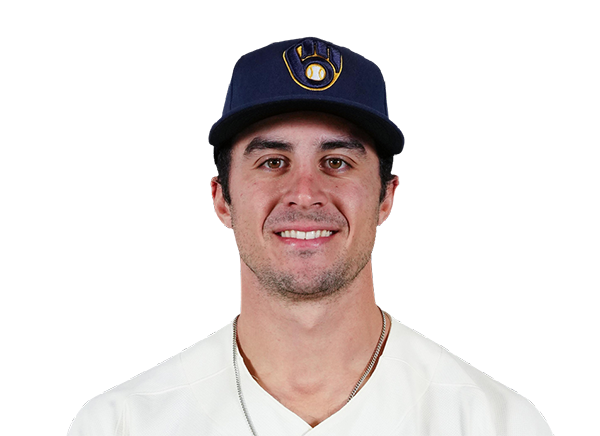 Sal Frelick | 1-1 | 1 | 0 | 1 | 1 | 0 | 1 | 0 | 10 | .236 | .299 | .325 |
 Cooper Pratt | 1-3 | 3 | 1 | 1 | 0 | 0 | 1 | 0 | 14 | .280 | .347 | .372 |
 David Hamilton | 0-1 | 1 | 0 | 0 | 0 | 0 | 0 | 1 | 6 | .242 | .311 | .332 |
Baltimore Orioles
| Player | H-AB | AB | R | H | RBI | HR | BB | K | #P | AVG | OBP | SLG |
|---|---|---|---|---|---|---|---|---|---|---|---|---|
 Dylan Beavers | 1-5 | 5 | 1 | 1 | 0 | 0 | 1 | 1 | 25 | .237 | .313 | .373 |
 Pete Alonso | 1-4 | 4 | 1 | 1 | 3 | 1 | 1 | 2 | 23 | .267 | .361 | .506 |
 Gunnar Henderson | 3-5 | 5 | 1 | 3 | 0 | 0 | 0 | 1 | 24 | .224 | .308 | .399 |
 Coby Mayo | 3-4 | 4 | 1 | 3 | 0 | 0 | 1 | 0 | 27 | .230 | .296 | .475 |
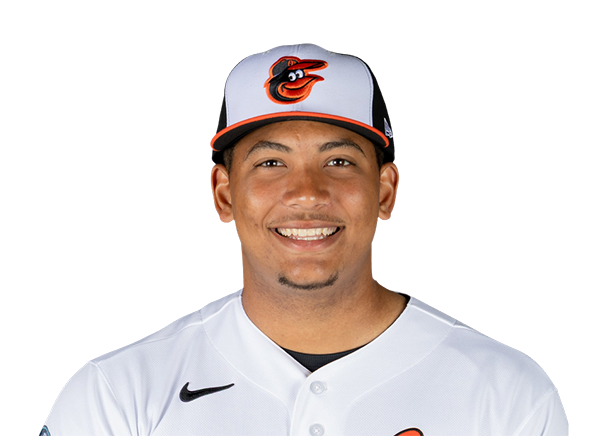 Samuel Basallo | 1-4 | 4 | 0 | 1 | 1 | 0 | 0 | 1 | 19 | .227 | .295 | .415 |
 Christian Encarnacion-Strand | 0-3 | 3 | 0 | 0 | 1 | 0 | 0 | 2 | 22 | .273 | .323 | .511 |
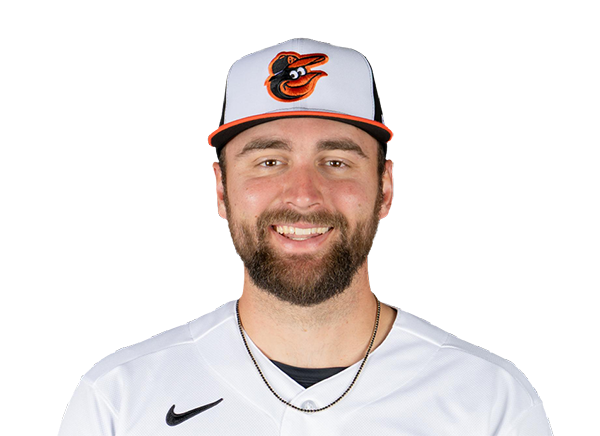 Colton Cowser | 2-3 | 3 | 0 | 2 | 0 | 0 | 0 | 1 | 9 | .221 | .311 | .365 |
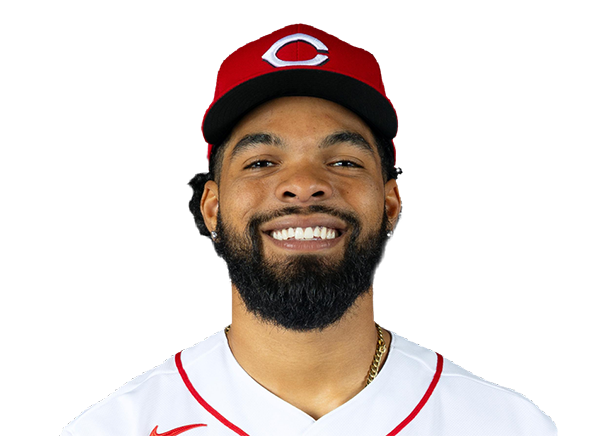 Rece Hinds | 0-1 | 1 | 0 | 0 | 0 | 0 | 0 | 0 | 2 | .154 | .220 | .231 |
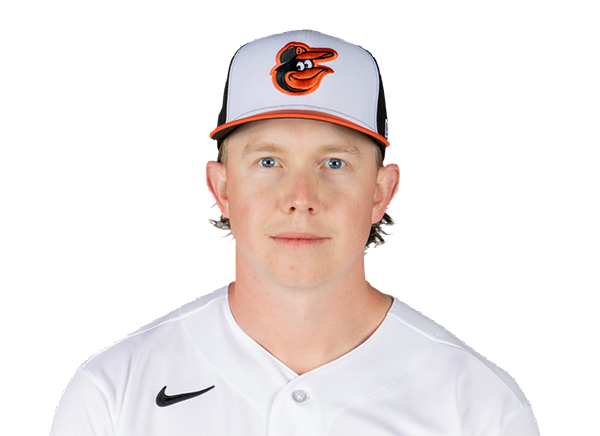 Heston Kjerstad | 0-1 | 1 | 0 | 0 | 0 | 0 | 0 | 1 | 5 | .211 | .211 | .263 |
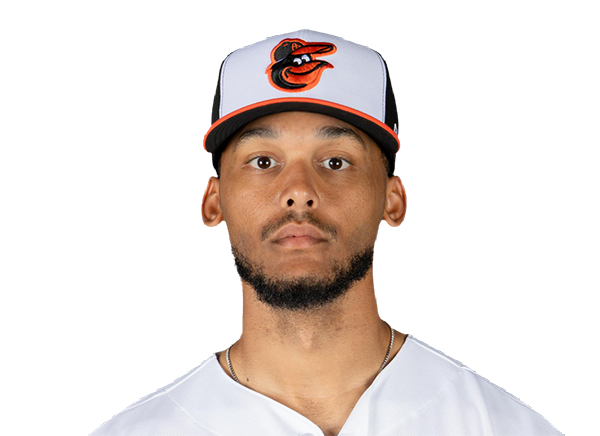 Jeremiah Jackson | 0-5 | 5 | 0 | 0 | 0 | 0 | 0 | 3 | 25 | .224 | .251 | .374 |
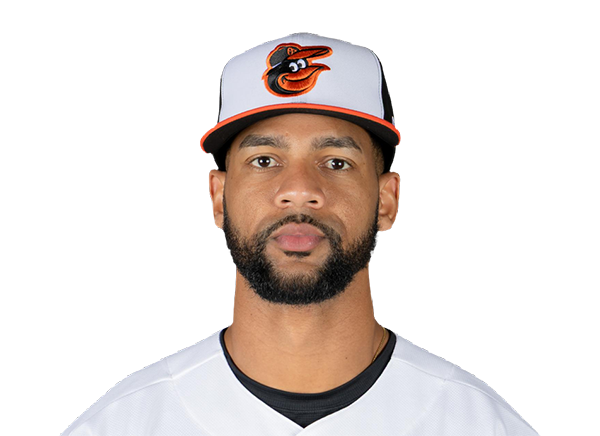 Leody Taveras | 1-5 | 5 | 1 | 1 | 0 | 0 | 0 | 1 | 13 | .216 | .286 | .341 |
Milwaukee Brewers
| Player | IP | H | R | ER | BB | K | HR | PC-ST | ERA | PC |
|---|---|---|---|---|---|---|---|---|---|---|
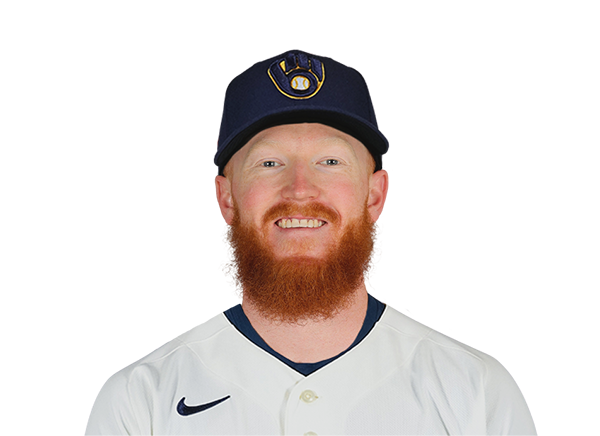 Dustin May | 2.1 | 6 | 3 | 3 | 1 | 4 | 1 | 70-44 | 4.61 | 70 |
 Shane Drohan | 1.2 | 0 | 0 | 0 | 1 | 2 | 0 | 23-13 | 4.26 | 23 |
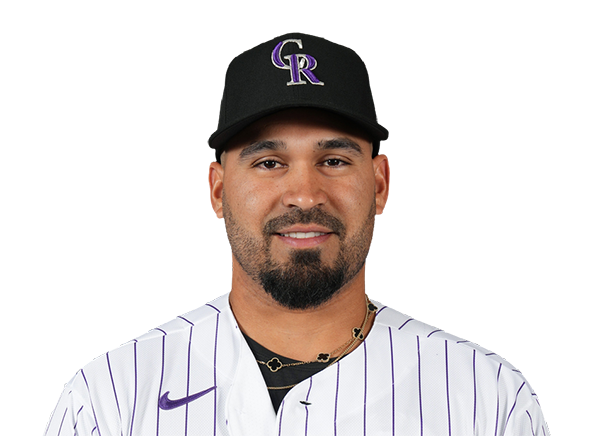 Antonio Senzatela | 1.0 | 2 | 0 | 0 | 0 | 0 | 0 | 24-19 | 4.20 | 24 |
 DL Hall | 2.0 | 1 | 0 | 0 | 1 | 2 | 0 | 29-20 | 2.09 | 29 |
 Abner Uribe | 1.0 | 1 | 0 | 0 | 0 | 3 | 0 | 21-13 | 2.08 | 21 |
 Trevor Megill | 1.0 | 2 | 2 | 2 | 0 | 1 | 0 | 18-11 | 2.76 | 18 |
 Chad Patrick | 1.0 | 0 | 0 | 0 | 0 | 1 | 0 | 9-7 | 3.13 | 9 |
Baltimore Orioles
| Player | IP | H | R | ER | BB | K | HR | PC-ST | ERA | PC |
|---|---|---|---|---|---|---|---|---|---|---|
 Cade Povich | 3.2 | 5 | 3 | 3 | 2 | 3 | 1 | 71-41 | 4.38 | 71 |
 Anthony Nunez | 1.0 | 0 | 0 | 0 | 0 | 2 | 0 | 15-10 | 3.90 | 15 |
 Luis De Leon | 1.1 | 1 | 0 | 0 | 0 | 0 | 0 | 21-13 | 2.08 | 21 |
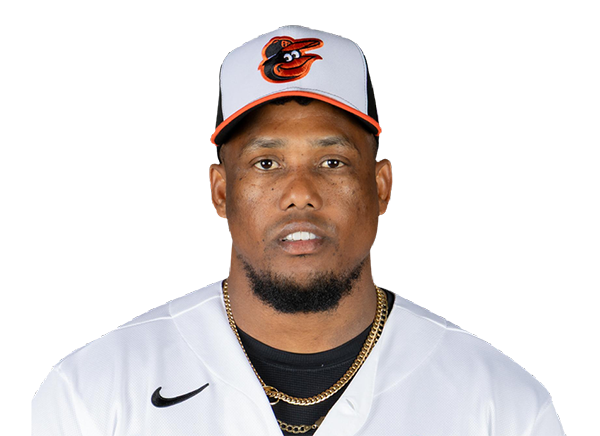 Yennier Cano | 1.0 | 0 | 0 | 0 | 1 | 1 | 0 | 14-6 | 3.00 | 14 |
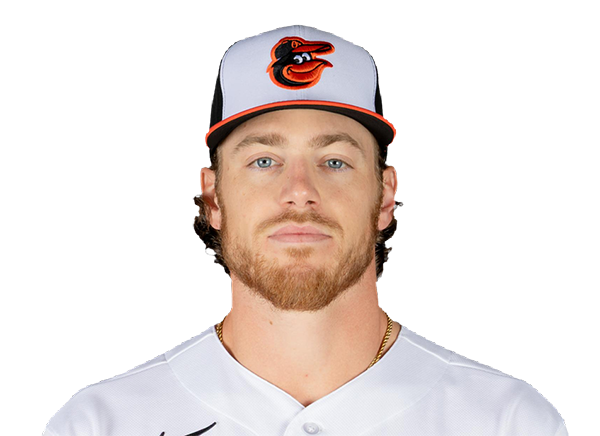 Josh Walker | 0.2 | 0 | 0 | 0 | 2 | 1 | 0 | 18-8 | 1.57 | 18 |
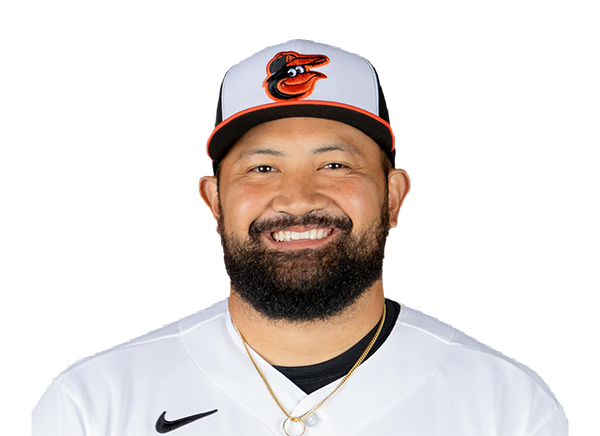 Rico Garcia | 0.2 | 2 | 2 | 2 | 1 | 1 | 0 | 21-11 | 3.18 | 21 |
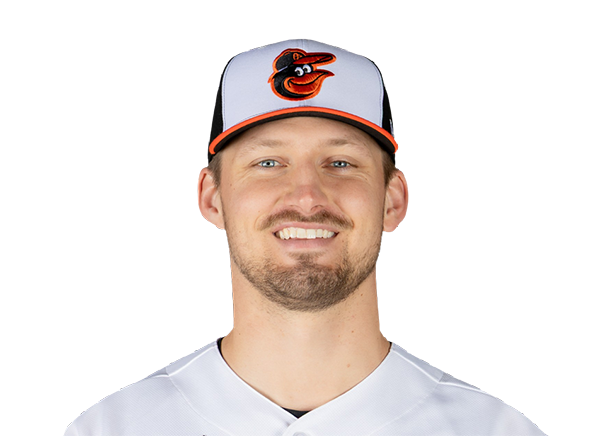 Grant Wolfram | 1.0 | 2 | 1 | 0 | 0 | 1 | 0 | 15-10 | 4.47 | 15 |
 Andrew Kittredge | 0.2 | 0 | 0 | 0 | 0 | 1 | 0 | 8-4 | 3.61 | 8 |
H2H / Season Series
BAL5–6
MIL
Last 5 Games
| Date | Opponent | Result |
|---|---|---|
| Sep 18 | @ BAL | W6–5 |
| Sep 17 |  @ PIT | L4–7 |
| Sep 16 | @ PIT | W5–4 |
| Sep 15 | @ PIT | W5–1 |
| Sep 13 |  vs CIN | L3–4 |
| Date | Opponent | Result |
|---|---|---|
| Sep 18 | vs MIL | L5–6 |
| Sep 16 |  @ NYM | W7–1 |
| Sep 15 | @ NYM | W7–5 |
| Sep 14 | @ NYM | W2–1 |
| Sep 13 |  @ TOR | L1–8 |
Standings
American League
| Team | W | L | PCT | GB | DIFF | STRK |
|---|---|---|---|---|---|---|
1 Rays | 93 | 60 | .608 | - | +78 | L1 |
2 Guardians | 79 | 75 | .513 | 14.5 | -5 | W3 |
3 Astros | 77 | 77 | .500 | 16.5 | -54 | L1 |
4 Yankees | 89 | 64 | .582 | 4 | +143 | W1 |
5 Red Sox | 84 | 70 | .545 | 9.5 | +85 | W2 |
6 White Sox | 78 | 76 | .506 | 15.5 | +33 | L1 |
7 Rangers | 77 | 77 | .500 | 16.5 | -33 | W1 |
| 8Blue Jays | 76 | 78 | .494 | 17.5 | -43 | L1 |
| 9Orioles | 75 | 79 | .487 | 18.5 | -27 | L1 |
10 Tigers | 73 | 81 | .474 | 20.5 | +77 | W1 |
11 Mariners | 72 | 82 | .468 | 21.5 | -55 | W2 |
12 Twins | 72 | 82 | .468 | 21.5 | -71 | W1 |
13 Royals | 67 | 87 | .435 | 26.5 | -100 | L2 |
14 Athletics | 61 | 93 | .396 | 32.5 | -216 | L4 |
15 Angels | 59 | 95 | .383 | 34.5 | -80 | L1 |
National League
| Team | W | L | PCT | GB | DIFF | STRK |
|---|---|---|---|---|---|---|
| 1Brewers | 96 | 58 | .623 | - | +198 | W1 |
2 Dodgers | 94 | 60 | .610 | 2 | +185 | W2 |
3 Braves | 90 | 64 | .584 | 6 | +115 | W1 |
4 Phillies | 85 | 69 | .552 | 11 | +31 | L1 |
5 Cubs | 85 | 69 | .552 | 11 | +141 | L1 |
6 Padres | 85 | 69 | .552 | 11 | +36 | W3 |
7 Diamondbacks | 80 | 74 | .519 | 16 | -7 | L3 |
| 8Pirates | 77 | 77 | .500 | 19 | +27 | W2 |
9 Marlins | 76 | 78 | .494 | 20 | +2 | L1 |
10 Cardinals | 75 | 79 | .487 | 21 | -22 | L3 |
11 Nationals | 72 | 82 | .468 | 24 | +11 | W1 |
| 12Reds | 72 | 82 | .468 | 24 | -152 | W1 |
| 13Mets | 70 | 84 | .455 | 26 | -43 | W1 |
14 Giants | 64 | 90 | .416 | 32 | -76 | L1 |
15 Rockies | 56 | 98 | .364 | 40 | -178 | L3 |
MIL
VS
BAL
Pitchers
Dustin May
Catchers
William Contreras
Infielders
Brice Turang
Andrew Vaughn
Joey Ortiz
Cooper Pratt
Outfielders
Jackson Chourio
Garrett Mitchell
Luis Lara
Designated Hitters
Christian Yelich
Pitchers
Cade Povich
Catchers
Samuel Basallo
Infielders
Pete Alonso
Gunnar Henderson
Coby Mayo
Jeremiah Jackson
Outfielders
Dylan Beavers
Colton Cowser
Leody Taveras
Designated Hitters
Christian Encarnacion-Strand
Brewers
VS
Orioles
Batting
154
Team Games Played
154
5247
At Bats
5150
1360
Hits
1210
754
Runs Batted In
668
148
Home Runs
189
152
Stolen Bases
76
.259
Batting Average
.235
798
Runs
693
269
Doubles
227
25
Triples
19
2123
Total Bases
2042
641
Walks
563
1298
Strikeouts
1452
.342
On Base Percentage
.315
.405
Slugging Percentage
.397
.746
OBP Pct + SLG Pct
.712
154
Games Played
154
154
Games Started
154
39
Hit By Pitch
59
0.0
Wins Above Replacement
0.0
0.0
Offensive Wins Above Replacement
0.0
49
Caught Stealing
32
1
Is Qualified
1
757.1
Runs Created
654.1
5.0
Runs Created Per 27 Outs
4.3
.107
Walks Per Plate Appearance
.097
0.49
Walk To Strikeout Ratio
0.39
.145
Isolated Power
.162
.287
Secondary Average
.279
3.98
Pitches Per Plate Appearance
3.98
442
Extra Base Hits
435
6012
Plate Appearances
5829
35.5
At Bats Per Home Run
27.2
35
Sacrifice Hit
18
43
Sacrifice Flies
37
Pitching
154
Team Games Played
154
51
Quality Starts
58
96
Wins
75
58
Losses
79
49
Saves
44
79
Holds
80
1147
Hits
1338
548
Earned runs
633
165
Home Runs
167
494
Walks
515
1480
Strikeouts
1239
9.7
Strikeouts Per 9 Innings
8.1
146.5
Pitches Per Start
146.7
1.19
Walks Plus Hits Per Inning Pitched
1.35
3.59
Earned Run Average
4.15
58
Losses
79
1375.2
Innings pitched
1374.1
.623
Win Percentage
.487
69
Save Opportunities
66
.224
Opponent Batting Average
.254
.299
Opponent's On-base pct.
.323
.368
Opponent's Slugging pct.
.408
.667
Opponent's OPB Pct + SLG Pct
.731
5112
At Bats
5272
210
Doubles
259
14
Triples
26
63
Batters Hit
49
69
Stolen Bases
86
154
Games Played
154
1
Complete Games
1
10
Shutouts
2
48
Wild Pitches
44
574
Runs Batted In
691
6
Balks
4
1375.2
Innings pitched
1374.1
9.7
Strikeouts Per 9 Innings
8.1
31
Caught Stealing
35
154
Games Started
154
0.0
Wins Above Replacement
0.0
1
Is Qualified
1
600
Runs
720
548
Earned Runs
633
1880
Total Bases
2150
Fielding
154
Team Games Played
154
1376
Full Innings
1374
5401
Total Chances
5528
4127
Putouts
4123
1206
Assists
1313
68
Errors
92
269
Double Plays
227
0.987
Fielding Percentage
0.983
34.9
Range Factor
35.6
0.0
Zone Rating
0.0
154
Games Played
154
0
Games Started
0
0.0
Defensive Wins Above Replacement
0.0
1
Qualified
1