

Brewers vs Padres Live Score (12 Aug, 2026)
Game Information
Stage
Standard
Season
2026
First Pitch
Tue, Aug 11, 9:40 pm
Venue
Petco Park
Location
San Diego, California
Attendance
40,534
Home Runs
Jake Bauers
21 HR
.271 AVG
67 RBI

Manny Machado
23 HR
.210 AVG
70 RBI

Batting Average
Jackson Chourio
.280 AVG
.343 OBP
.483 SLG
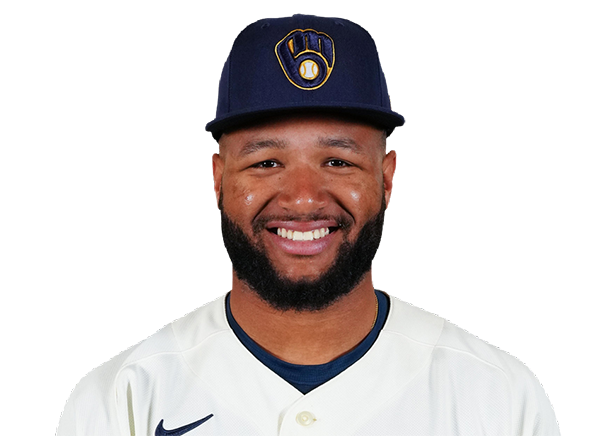
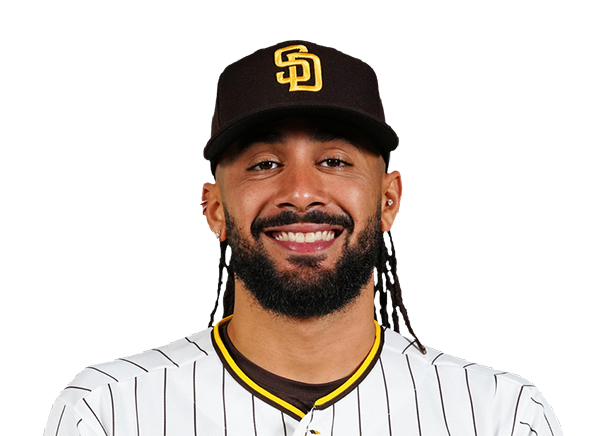
Fernando Tatis Jr.
.280 AVG
.349 OBP
.414 SLG
Runs Batted In
Brice Turang
74 RBI
16 HR
.270 AVG

Manny Machado
70 RBI
23 HR
.210 AVG
Earned Run Average
Jacob Misiorowski
1.76 ERA
11 W
204 K

Michael King
3.37 ERA
7 W
120 K
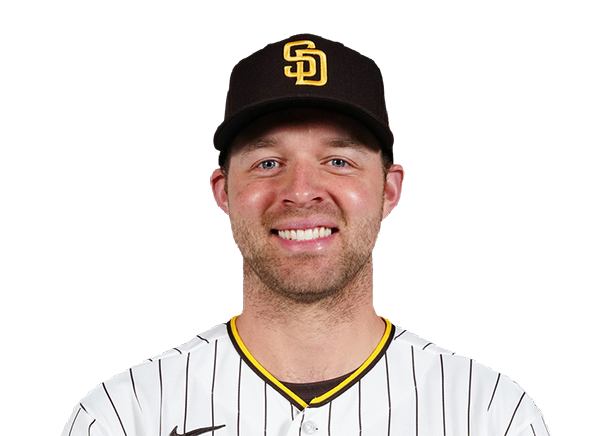
Wins
Aaron Ashby
13 W
3.56 ERA
94 K

Randy Vasquez
8 W
4.16 ERA
66 K

Strikeouts
Jacob Misiorowski
204 K
11 W
1.76 ERA
Michael King
120 K
7 W
3.37 ERA
Injury Report


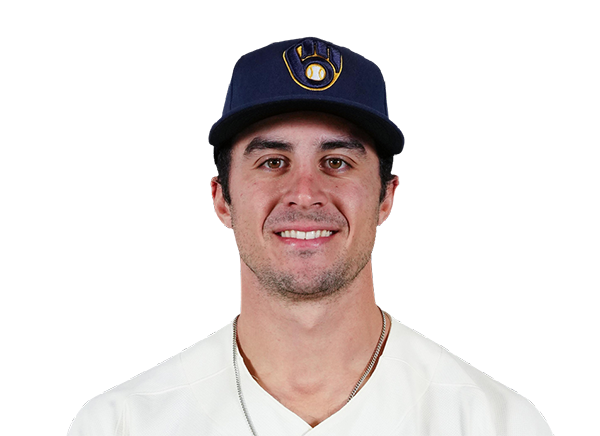



Team Stats
 MIL
SD


Array
Runs
Array
7
Hits
17
2
Errors
0
—
Home Runs
—
—
Walks
—
—
Strikeouts
—
Standings
American League
| Team | W | L | PCT | GB | DIFF | STRK |
|---|---|---|---|---|---|---|
1 Rays | 78 | 53 | .595 | - | +47 | W2 |
2 White Sox | 68 | 62 | .523 | 9.5 | +43 | W1 |
3 Astros | 65 | 66 | .496 | 13 | -44 | L2 |
4 Yankees | 74 | 56 | .569 | 3.5 | +100 | W1 |
5 Red Sox | 72 | 59 | .550 | 6 | +101 | W4 |
6 Rangers | 65 | 66 | .496 | 13 | -46 | W1 |
7 Guardians | 65 | 66 | .496 | 13 | -9 | W4 |
8 Blue Jays | 64 | 68 | .485 | 14.5 | -55 | L1 |
9 Twins | 63 | 68 | .481 | 15 | -54 | L3 |
10 Orioles | 63 | 68 | .481 | 15 | -35 | L1 |
11 Mariners | 62 | 69 | .473 | 16 | -61 | L1 |
12 Tigers | 61 | 70 | .466 | 17 | +70 | L6 |
13 Royals | 58 | 74 | .439 | 20.5 | -91 | W8 |
14 Angels | 52 | 79 | .397 | 26 | -70 | L1 |
15 Athletics | 51 | 80 | .389 | 27 | -187 | W2 |
National League
| Team | W | L | PCT | GB | DIFF | STRK |
|---|---|---|---|---|---|---|
| 1Brewers | 81 | 50 | .618 | - | +161 | L1 |
2 Dodgers | 80 | 51 | .611 | 1 | +151 | W6 |
3 Braves | 76 | 55 | .580 | 5 | +110 | W1 |
4 Cubs | 75 | 56 | .573 | 6 | +115 | W1 |
5 Phillies | 73 | 58 | .557 | 8 | +27 | W9 |
| 6Padres | 71 | 60 | .542 | 10 | +16 | W3 |
7 Diamondbacks | 69 | 62 | .527 | 12 | +9 | W1 |
8 Marlins | 67 | 65 | .508 | 14.5 | +19 | L1 |
9 Cardinals | 66 | 66 | .500 | 15.5 | -2 | L3 |
10 Pirates | 63 | 69 | .477 | 18.5 | +25 | L3 |
11 Reds | 62 | 69 | .473 | 19 | -94 | L1 |
12 Nationals | 62 | 71 | .466 | 20 | +20 | W1 |
13 Mets | 59 | 72 | .450 | 22 | -40 | L1 |
14 Giants | 52 | 78 | .400 | 28.5 | -80 | L4 |
15 Rockies | 50 | 81 | .382 | 31 | -146 | L7 |
MIL
VS
SD
Pitchers

Kyle Harrison
Catchers
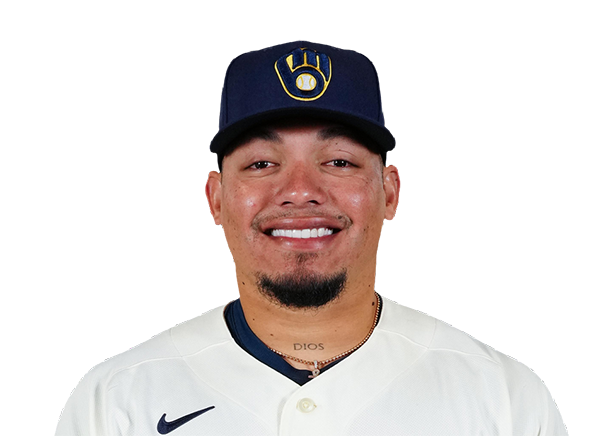
William Contreras
Infielders
Brice Turang
Jake Bauers
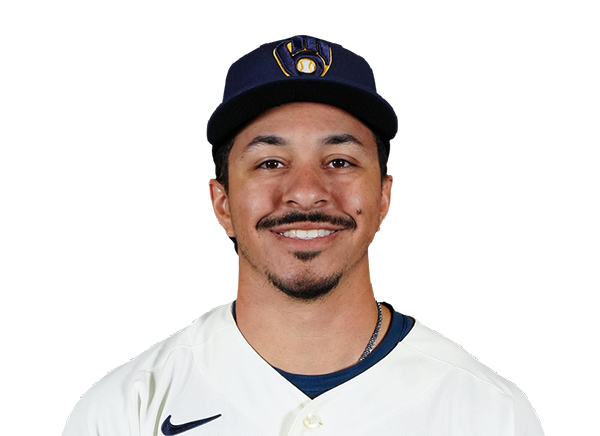
David Hamilton

Jihwan Bae
Outfielders
Jackson Chourio
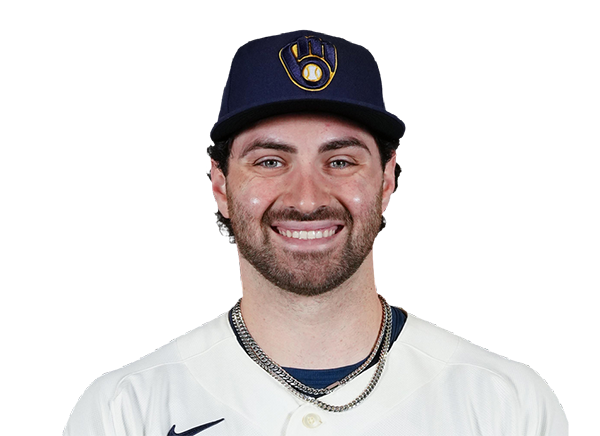
Garrett Mitchell
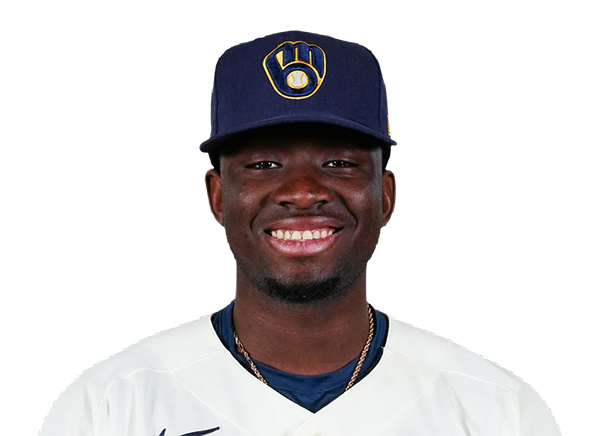
Luis Lara
Designated Hitters
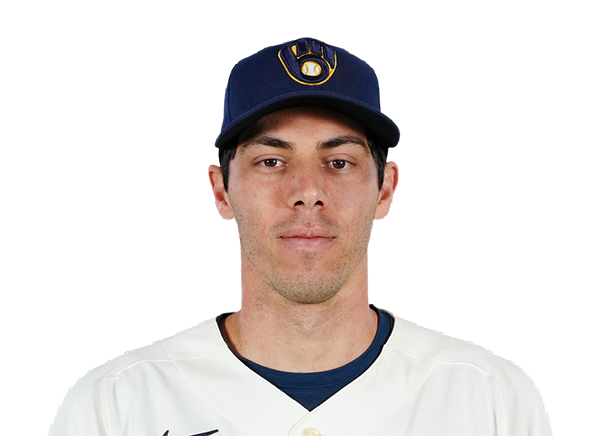
Christian Yelich
Pitchers
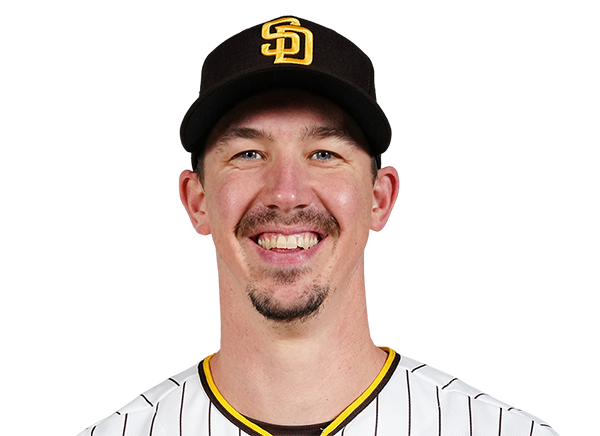
Walker Buehler
Catchers
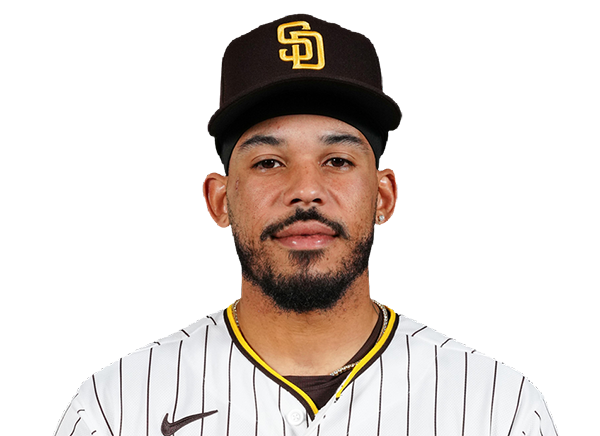
Luis Campusano
Infielders
Manny Machado
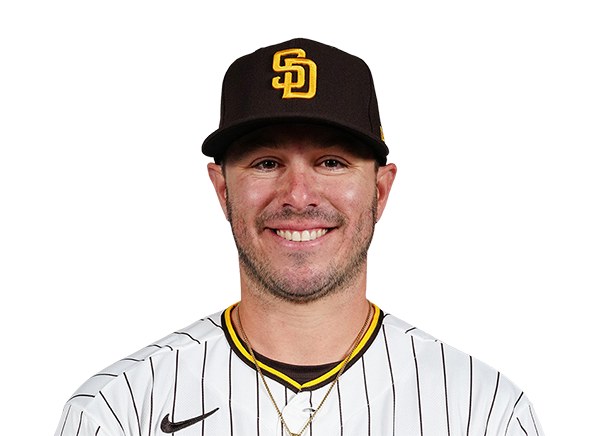
Ty France
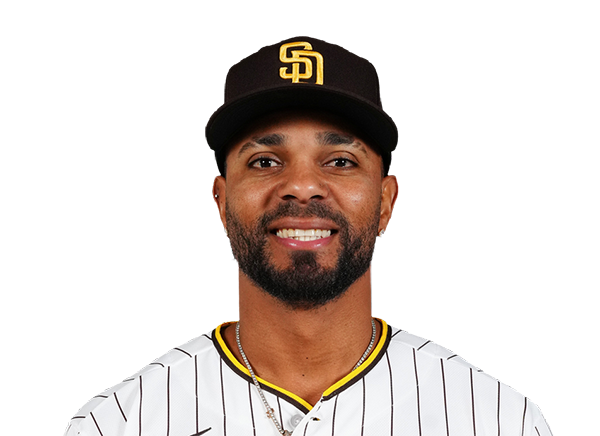
Xander Bogaerts

Jake Cronenworth
Outfielders
Fernando Tatis Jr.

Jackson Merrill

Austin Hays
Designated Hitters

Luis Rengifo
Brewers
VS
Padres
Batting
120
Team Games Played
121
4044
At Bats
3986
1019
Hits
949
558
Runs Batted In
500
110
Home Runs
133
118
Stolen Bases
119
.252
Batting Average
.238
589
Runs
518
214
Doubles
179
20
Triples
11
1603
Total Bases
1549
495
Walks
409
994
Strikeouts
980
.336
On Base Percentage
.314
.396
Slugging Percentage
.389
.732
OBP Pct + SLG Pct
.702
120
Games Played
121
120
Games Started
121
30
Hit By Pitch
45
0.0
Wins Above Replacement
0.0
0.0
Offensive Wins Above Replacement
0.0
38
Caught Stealing
32
1
Is Qualified
1
561.8
Runs Created
496.9
4.7
Runs Created Per 27 Outs
4.2
.107
Walks Per Plate Appearance
.091
0.50
Walk To Strikeout Ratio
0.42
.144
Isolated Power
.151
.287
Secondary Average
.275
3.98
Pitches Per Plate Appearance
3.93
344
Extra Base Hits
323
4635
Plate Appearances
4491
36.8
At Bats Per Home Run
30.0
29
Sacrifice Hit
19
30
Sacrifice Flies
31
Pitching
120
Team Games Played
121
40
Quality Starts
22
74
Wins
64
46
Losses
57
38
Saves
36
60
Holds
75
874
Hits
988
421
Earned runs
489
123
Home Runs
134
376
Walks
416
1169
Strikeouts
977
9.8
Strikeouts Per 9 Innings
8.2
145.2
Pitches Per Start
147.0
1.17
Walks Plus Hits Per Inning Pitched
1.31
3.54
Earned Run Average
4.12
46
Losses
57
1071.2
Innings pitched
1068.0
.617
Win Percentage
.529
53
Save Opportunities
51
.221
Opponent Batting Average
.245
.295
Opponent's On-base pct.
.322
.361
Opponent's Slugging pct.
.396
.655
Opponent's OPB Pct + SLG Pct
.718
3963
At Bats
4025
164
Doubles
175
11
Triples
15
49
Batters Hit
50
47
Stolen Bases
74
120
Games Played
121
1
Complete Games
0
8
Shutouts
8
40
Wild Pitches
32
440
Runs Batted In
503
6
Balks
3
1071.2
Innings pitched
1068.0
9.8
Strikeouts Per 9 Innings
8.2
27
Caught Stealing
37
120
Games Started
121
0.0
Wins Above Replacement
0.0
1
Is Qualified
1
458
Runs
518
421
Earned Runs
489
1429
Total Bases
1595
Fielding
120
Team Games Played
121
1072
Full Innings
1068
4196
Total Chances
4320
3215
Putouts
3204
929
Assists
1069
52
Errors
47
214
Double Plays
179
0.988
Fielding Percentage
0.989
34.8
Range Factor
36.0
0.0
Zone Rating
0.0
120
Games Played
121
0
Games Started
0
0.0
Defensive Wins Above Replacement
0.0
1
Qualified
1