

Brewers vs Phillies Live Score (22 Sep, 2026)
Game Information
Stage
STD
Season
2026
First Pitch
Tue, Sep 22, 6:40 pm
Venue
Citizens Bank Park
Location
Philadelphia, Pennsylvania
Venue Type
Outdoor
Broadcast
MLB.TV
Attendance
37,132
Live Situation
1Balls
1Strikes
0Outs
—Pitcher
—At Bat
Pitch Sequence
1
STRIKE FOUL
Splitter
98 MPH
2
BALL
Four-seam FB
100 MPH
3
BALL IN PLAY
Splitter
98 MPH
Injury Report





Team Stats
 MIL
PHI


4
Runs
6
6
Hits
8
2
Errors
0
0
Home Runs
1
2
Walks
3
15
Strikeouts
4
Player Box Score
Milwaukee Brewers
| Player | H-AB | AB | R | H | RBI | HR | BB | K | #P | AVG | OBP | SLG |
|---|---|---|---|---|---|---|---|---|---|---|---|---|
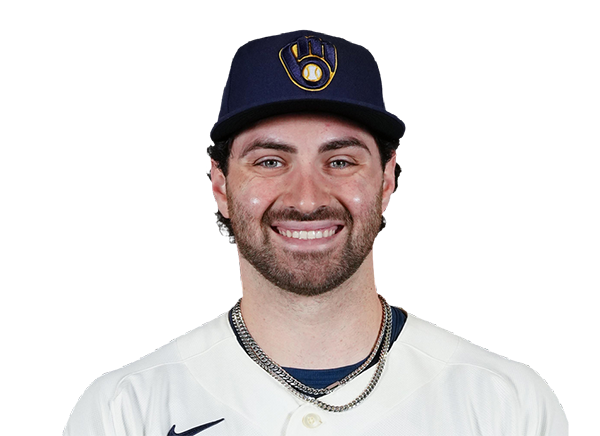 Garrett Mitchell | 1-4 | 4 | 1 | 1 | 0 | 0 | 0 | 2 | 18 | .266 | .358 | .426 |
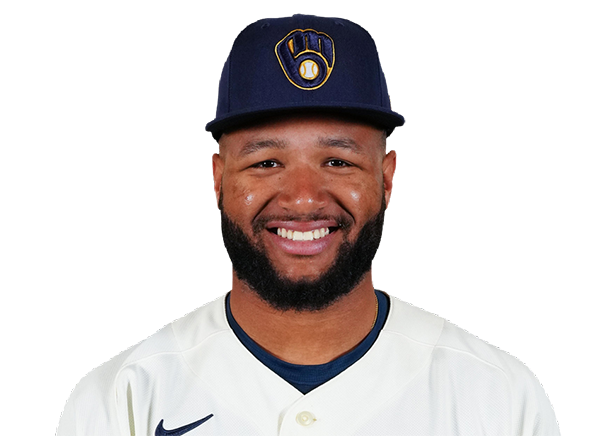 Jackson Chourio | 0-3 | 3 | 1 | 0 | 0 | 0 | 1 | 2 | 13 | .283 | .343 | .478 |
 Brice Turang | 1-4 | 4 | 0 | 1 | 0 | 0 | 0 | 2 | 18 | .264 | .364 | .437 |
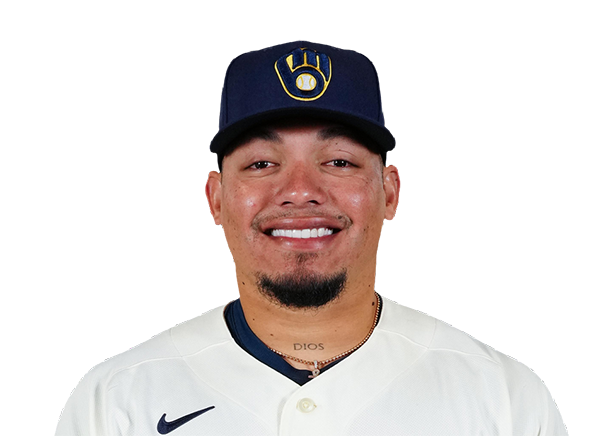 William Contreras | 1-3 | 3 | 0 | 1 | 3 | 0 | 0 | 2 | 18 | .272 | .341 | .422 |
 Jake Bauers | 1-4 | 4 | 0 | 1 | 0 | 0 | 0 | 3 | 20 | .269 | .396 | .495 |
 Christian Yelich | 0-3 | 3 | 1 | 0 | 0 | 0 | 1 | 2 | 16 | .235 | .313 | .374 |
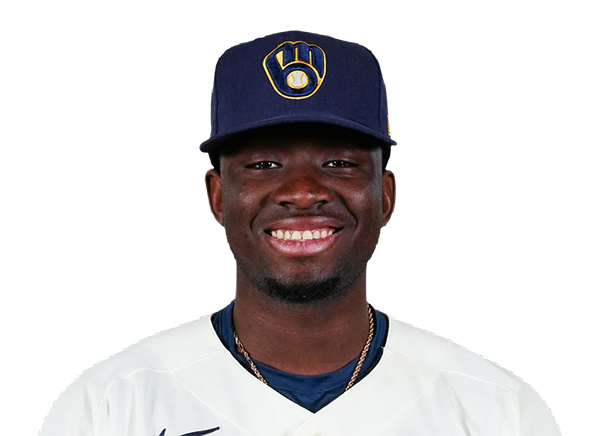 Luis Lara | 1-4 | 4 | 0 | 1 | 1 | 0 | 0 | 1 | 16 | .251 | .317 | .335 |
 Cooper Pratt | 0-4 | 4 | 0 | 0 | 0 | 0 | 0 | 1 | 15 | .276 | .344 | .364 |
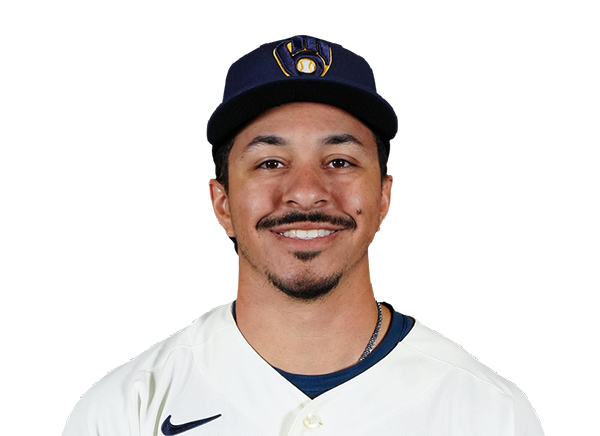 David Hamilton | 1-3 | 3 | 1 | 1 | 0 | 0 | 0 | 0 | 14 | .241 | .308 | .329 |
Philadelphia Phillies
| Player | H-AB | AB | R | H | RBI | HR | BB | K | #P | AVG | OBP | SLG |
|---|---|---|---|---|---|---|---|---|---|---|---|---|
 Kyle Schwarber | 0-4 | 4 | 0 | 0 | 0 | 0 | 0 | 1 | 14 | .233 | .353 | .508 |
 Trea Turner | 1-4 | 4 | 1 | 1 | 0 | 0 | 0 | 0 | 11 | .241 | .298 | .381 |
 Bryce Harper | 0-3 | 3 | 0 | 0 | 0 | 0 | 1 | 0 | 15 | .269 | .382 | .488 |
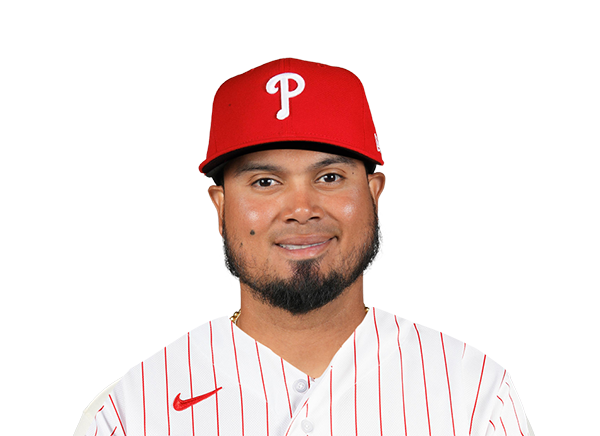 Luis Arraez | 2-4 | 4 | 1 | 2 | 0 | 0 | 0 | 0 | 13 | .314 | .349 | .424 |
 Alec Bohm | 2-4 | 4 | 1 | 2 | 1 | 0 | 0 | 0 | 10 | .255 | .319 | .393 |
 Bryson Stott | 1-3 | 3 | 2 | 1 | 1 | 0 | 1 | 0 | 18 | .248 | .325 | .387 |
 Brandon Marsh | 2-4 | 4 | 1 | 2 | 3 | 1 | 0 | 1 | 12 | .262 | .306 | .414 |
 J.T. Realmuto | 0-3 | 3 | 0 | 0 | 0 | 0 | 1 | 1 | 20 | .211 | .289 | .339 |
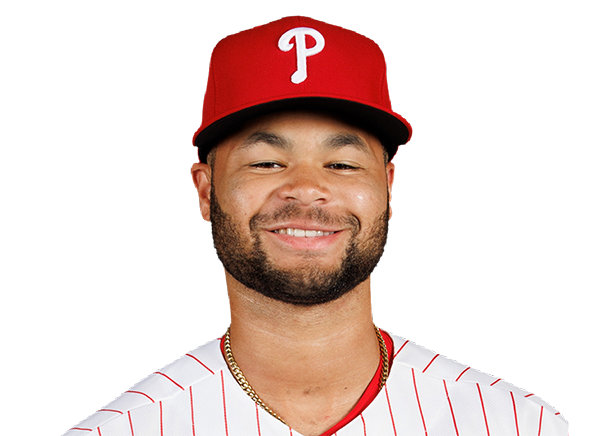 Justin Crawford | 0-2 | 2 | 0 | 0 | 0 | 0 | 0 | 1 | 6 | .263 | .311 | .356 |
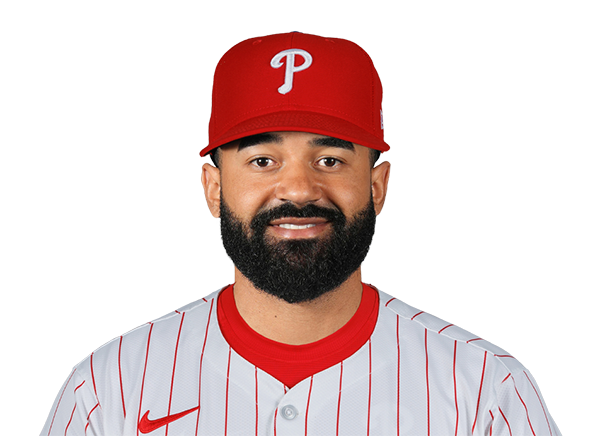 Derek Hill | 0-1 | 1 | 0 | 0 | 0 | 0 | 0 | 0 | 1 | .245 | .295 | .449 |
Milwaukee Brewers
| Player | IP | H | R | ER | BB | K | HR | PC-ST | ERA | PC |
|---|---|---|---|---|---|---|---|---|---|---|
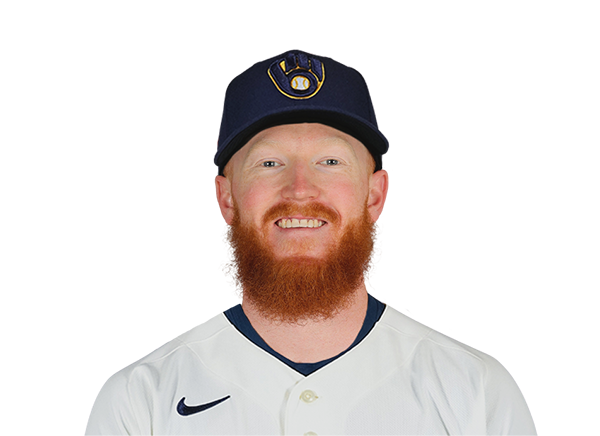 Dustin May | 2.0 | 1 | 2 | 2 | 2 | 2 | 1 | 36-22 | 4.67 | 36 |
 Kyle Harrison | 1.0 | 3 | 1 | 1 | 0 | 1 | 0 | 14-12 | 4.28 | 14 |
 Colton Gordon | 5.0 | 4 | 3 | 2 | 1 | 1 | 0 | 70-45 | 3.60 | 70 |
Philadelphia Phillies
| Player | IP | H | R | ER | BB | K | HR | PC-ST | ERA | PC |
|---|---|---|---|---|---|---|---|---|---|---|
 Zack Wheeler | 5.2 | 5 | 3 | 3 | 1 | 11 | 0 | 101-66 | 3.06 | 101 |
 Tim Mayza | 0.1 | 0 | 0 | 0 | 0 | 0 | 0 | 1-1 | 3.44 | 1 |
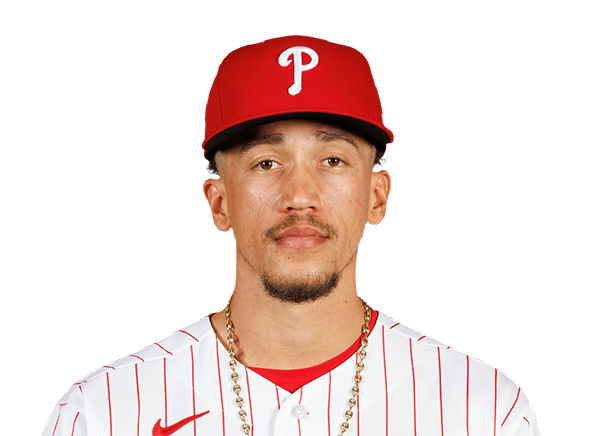 Alex McFarlane | 1.2 | 0 | 0 | 0 | 0 | 2 | 0 | 21-13 | 2.12 | 21 |
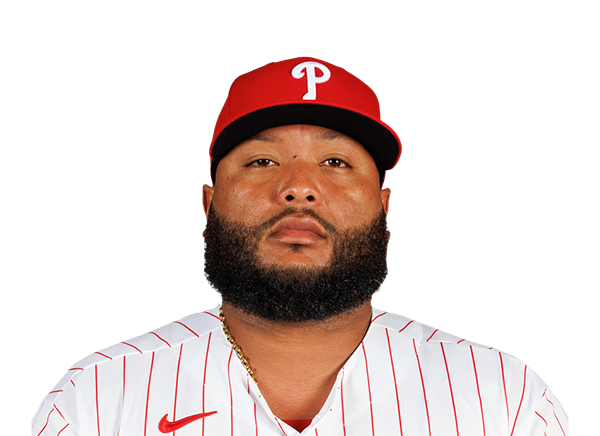 Jose Alvarado | 0.1 | 0 | 0 | 0 | 0 | 0 | 0 | 1-1 | 4.99 | 1 |
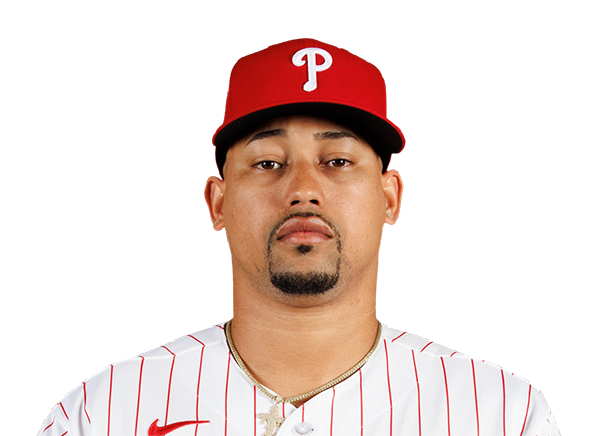 Jhoan Duran | 1.0 | 1 | 1 | 1 | 1 | 2 | 0 | 24-13 | 1.88 | 24 |
H2H / Season Series
PHI6–4
MIL
MIL4–0
PHI
MIL8–9
PHI
MIL6–0
PHI
Last 5 Games
| Date | Opponent | Result |
|---|---|---|
| Sep 22 | @ PHI | L4–6 |
| Sep 20 |  @ BAL | W3–0 |
| Sep 19 | @ BAL | W1–0 |
| Sep 18 | @ BAL | W6–5 |
| Sep 17 |  @ PIT | L4–7 |
| Date | Opponent | Result |
|---|---|---|
| Sep 22 | vs MIL | W6–4 |
| Sep 20 |  @ NYM | W7–2 |
| Sep 19 | @ NYM | L3–10 |
| Sep 18 | @ NYM | L3–6 |
| Sep 17 | @ NYM | W3–0 |
Standings
American League
| Team | W | L | PCT | GB | DIFF | STRK |
|---|---|---|---|---|---|---|
1 Rays | 96 | 61 | .611 | - | +86 | W1 |
2 Guardians | 82 | 75 | .522 | 14 | +3 | W6 |
3 Astros | 78 | 79 | .497 | 18 | -52 | W1 |
4 Yankees | 90 | 67 | .573 | 6 | +134 | L1 |
5 Red Sox | 84 | 73 | .535 | 12 | +79 | L3 |
6 White Sox | 81 | 76 | .516 | 15 | +45 | W3 |
7 Rangers | 78 | 79 | .497 | 18 | -37 | L2 |
8 Blue Jays | 77 | 80 | .490 | 19 | -43 | L1 |
| 9Orioles | 76 | 81 | .484 | 20 | -30 | W1 |
10 Twins | 74 | 84 | .468 | 22.5 | -66 | W1 |
11 Tigers | 74 | 84 | .468 | 22.5 | +73 | L1 |
12 Mariners | 73 | 84 | .465 | 23 | -63 | L1 |
13 Royals | 67 | 90 | .427 | 29 | -105 | L5 |
14 Athletics | 62 | 95 | .395 | 34 | -221 | W1 |
15 Angels | 60 | 97 | .382 | 36 | -89 | L2 |
National League
| Team | W | L | PCT | GB | DIFF | STRK |
|---|---|---|---|---|---|---|
| 1Brewers | 98 | 59 | .624 | - | +200 | L1 |
2 Dodgers | 97 | 60 | .618 | 1 | +200 | W5 |
3 Braves | 92 | 65 | .586 | 6 | +116 | L1 |
| 4Phillies | 87 | 70 | .554 | 11 | +31 | W2 |
5 Cubs | 87 | 70 | .554 | 11 | +146 | L1 |
6 Padres | 87 | 70 | .554 | 11 | +34 | L1 |
7 Diamondbacks | 83 | 74 | .529 | 15 | +4 | W3 |
| 8Pirates | 80 | 77 | .510 | 18 | +31 | W5 |
9 Marlins | 77 | 80 | .490 | 21 | +3 | W1 |
10 Cardinals | 76 | 81 | .484 | 22 | -25 | L1 |
11 Nationals | 74 | 84 | .468 | 24.5 | +7 | W1 |
12 Reds | 73 | 84 | .465 | 25 | -159 | W1 |
| 13Mets | 72 | 85 | .459 | 26 | -38 | W1 |
14 Giants | 65 | 93 | .411 | 33.5 | -82 | L1 |
15 Rockies | 57 | 100 | .363 | 41 | -182 | L2 |
MIL
VS
PHI
Pitchers
Dustin May
Catchers
William Contreras
Infielders
Brice Turang
Jake Bauers
Cooper Pratt
David Hamilton
Outfielders
Garrett Mitchell
Jackson Chourio
Luis Lara
Designated Hitters
Christian Yelich
Pitchers
Zack Wheeler
Catchers
J.T. Realmuto
Infielders
Trea Turner
Luis Arraez
Alec Bohm
Bryson Stott
Outfielders
Bryce Harper
Brandon Marsh
Justin Crawford
Designated Hitters
Kyle Schwarber
Brewers
VS
Phillies
Batting
157
Team Games Played
157
5337
At Bats
5255
1375
Hits
1268
762
Runs Batted In
682
149
Home Runs
180
159
Stolen Bases
103
.258
Batting Average
.241
806
Runs
703
270
Doubles
234
26
Triples
23
2144
Total Bases
2088
650
Walks
509
1338
Strikeouts
1286
.340
On Base Percentage
.312
.402
Slugging Percentage
.397
.742
OBP Pct + SLG Pct
.710
157
Games Played
157
157
Games Started
157
39
Hit By Pitch
59
0.0
Wins Above Replacement
0.0
0.0
Offensive Wins Above Replacement
0.0
51
Caught Stealing
19
1
Is Qualified
1
761.4
Runs Created
667.0
4.9
Runs Created Per 27 Outs
4.3
.106
Walks Per Plate Appearance
.086
0.49
Walk To Strikeout Ratio
0.40
.144
Isolated Power
.156
.286
Secondary Average
.269
3.98
Pitches Per Plate Appearance
3.89
445
Extra Base Hits
437
6112
Plate Appearances
5894
35.8
At Bats Per Home Run
29.2
35
Sacrifice Hit
14
44
Sacrifice Flies
54
Pitching
157
Team Games Played
157
52
Quality Starts
72
98
Wins
87
59
Losses
70
51
Saves
42
83
Holds
73
1163
Hits
1318
553
Earned runs
620
166
Home Runs
184
503
Walks
470
1496
Strikeouts
1525
9.6
Strikeouts Per 9 Innings
9.9
146.2
Pitches Per Start
148.3
1.19
Walks Plus Hits Per Inning Pitched
1.28
3.55
Earned Run Average
4.00
59
Losses
70
1401.2
Innings pitched
1393.1
.624
Win Percentage
.554
71
Save Opportunities
65
.223
Opponent Batting Average
.247
.299
Opponent's On-base pct.
.314
.366
Opponent's Slugging pct.
.400
.664
Opponent's OPB Pct + SLG Pct
.715
5204
At Bats
5332
214
Doubles
216
14
Triples
24
65
Batters Hit
69
70
Stolen Bases
88
157
Games Played
157
1
Complete Games
2
12
Shutouts
19
50
Wild Pitches
40
579
Runs Batted In
638
6
Balks
3
1401.2
Innings pitched
1393.1
9.6
Strikeouts Per 9 Innings
9.9
31
Caught Stealing
36
157
Games Started
157
0.0
Wins Above Replacement
0.0
1
Is Qualified
1
606
Runs
672
553
Earned Runs
620
1903
Total Bases
2134
Fielding
157
Team Games Played
157
1402
Full Innings
1393
5509
Total Chances
5551
4205
Putouts
4180
1234
Assists
1294
70
Errors
77
270
Double Plays
234
0.987
Fielding Percentage
0.986
34.9
Range Factor
35.4
0.0
Zone Rating
0.0
157
Games Played
157
0
Games Started
0
0.0
Defensive Wins Above Replacement
0.0
1
Qualified
1