

Brewers vs Phillies Live Score (24 Sep, 2026)
Game Information
Stage
STD
Season
2026
First Pitch
Thu, Sep 24, 6:05 pm
Venue
Citizens Bank Park
Location
Philadelphia, Pennsylvania
Venue Type
Outdoor
Broadcast
MLB.TV
Attendance
37,177
Live Situation
0Balls
0Strikes
0Outs
—Pitcher
—At Bat
Pitch Sequence
1
BALL IN PLAY
Four-seam FB
97 MPH
Injury Report




Team Stats
 MIL
PHI


5
Runs
1
11
Hits
4
1
Errors
0
1
Home Runs
0
6
Walks
4
12
Strikeouts
6
Player Box Score
Milwaukee Brewers
| Player | H-AB | AB | R | H | RBI | HR | BB | K | #P | AVG | OBP | SLG |
|---|---|---|---|---|---|---|---|---|---|---|---|---|
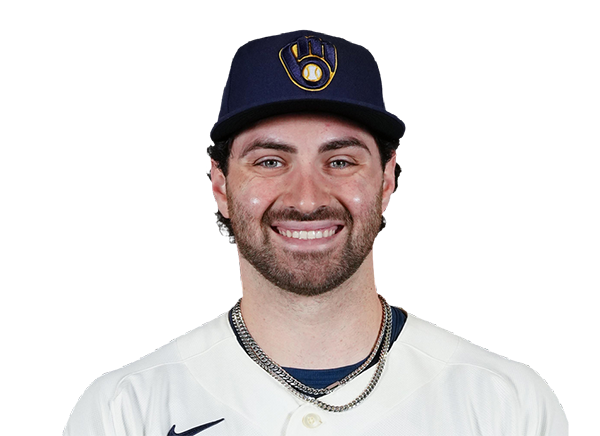 Garrett Mitchell | 1-5 | 5 | 0 | 1 | 0 | 0 | 0 | 4 | 19 | .263 | .353 | .419 |
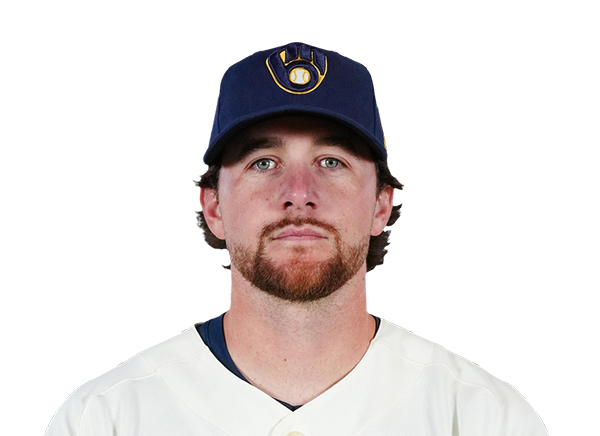 Brice Turang | 1-5 | 5 | 0 | 1 | 0 | 0 | 0 | 2 | 19 | .265 | .364 | .442 |
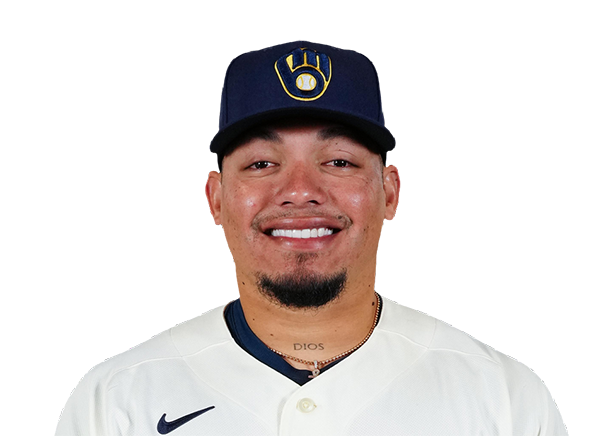 William Contreras | 0-2 | 2 | 0 | 0 | 0 | 0 | 1 | 0 | 10 | .271 | .341 | .419 |
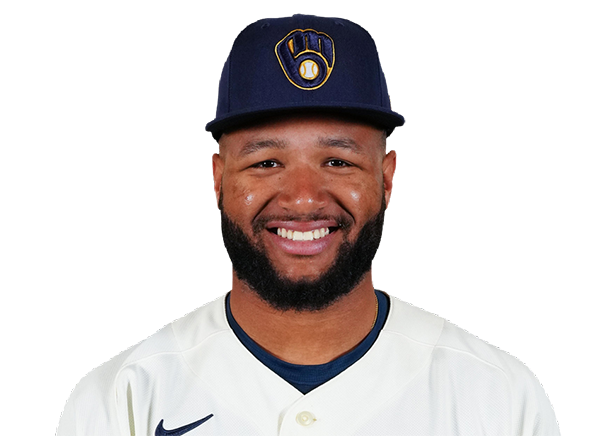 Jackson Chourio | 1-1 | 1 | 2 | 1 | 1 | 1 | 1 | 0 | 8 | .285 | .345 | .483 |
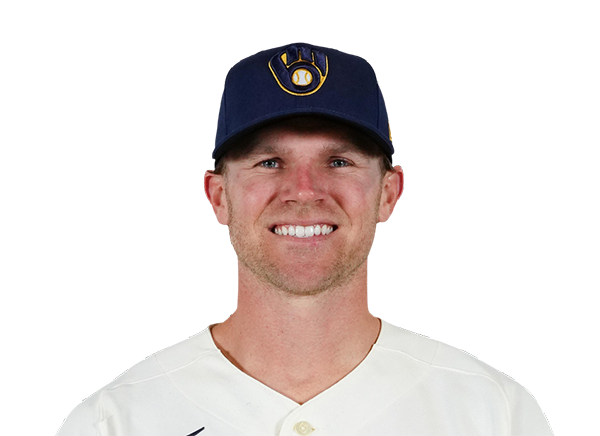 Jake Bauers | 2-5 | 5 | 1 | 2 | 1 | 0 | 0 | 2 | 19 | .268 | .393 | .491 |
 Gary Sanchez | 1-4 | 4 | 2 | 1 | 0 | 0 | 1 | 2 | 23 | .210 | .353 | .416 |
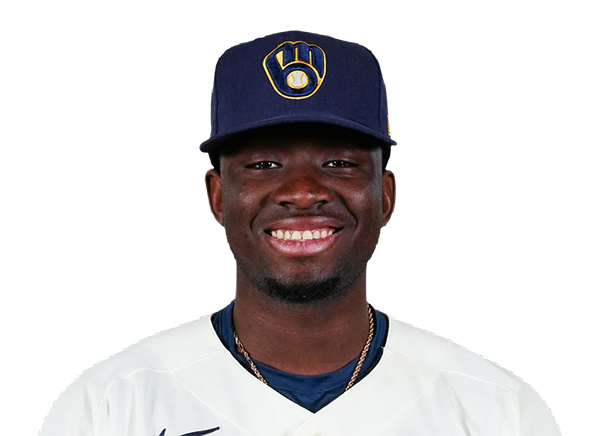 Luis Lara | 1-5 | 5 | 0 | 1 | 0 | 0 | 0 | 0 | 21 | .250 | .314 | .332 |
 Cooper Pratt | 2-3 | 3 | 0 | 2 | 1 | 0 | 1 | 0 | 15 | .282 | .350 | .368 |
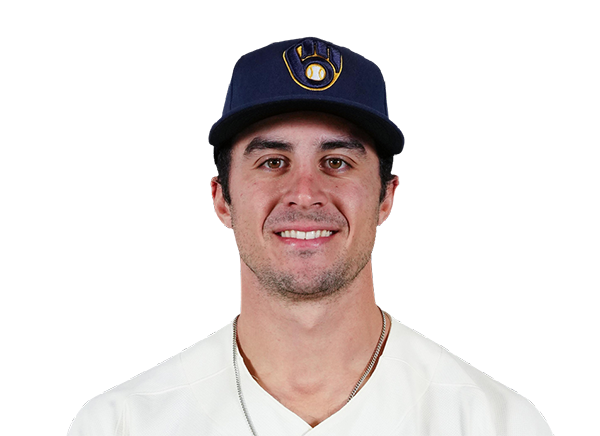 Sal Frelick | 1-2 | 2 | 0 | 1 | 1 | 0 | 2 | 0 | 19 | .234 | .299 | .323 |
 Joey Ortiz | 1-4 | 4 | 0 | 1 | 1 | 0 | 0 | 2 | 14 | .266 | .324 | .399 |
Philadelphia Phillies
| Player | H-AB | AB | R | H | RBI | HR | BB | K | #P | AVG | OBP | SLG |
|---|---|---|---|---|---|---|---|---|---|---|---|---|
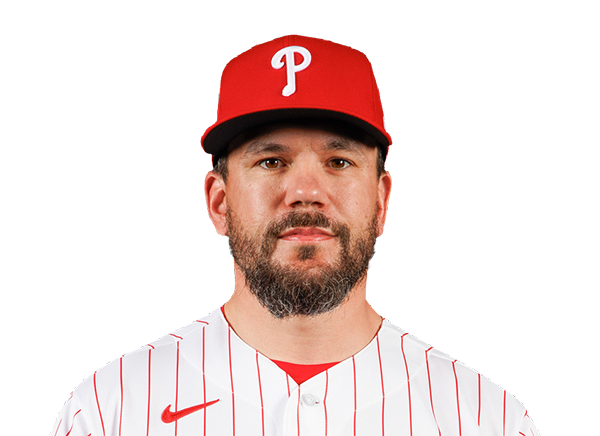 Kyle Schwarber | 2-4 | 4 | 1 | 2 | 0 | 0 | 0 | 0 | 13 | .233 | .354 | .507 |
 Trea Turner | 0-4 | 4 | 0 | 0 | 0 | 0 | 0 | 1 | 15 | .239 | .296 | .377 |
 Bryce Harper | 2-4 | 4 | 0 | 2 | 1 | 0 | 0 | 0 | 12 | .270 | .381 | .486 |
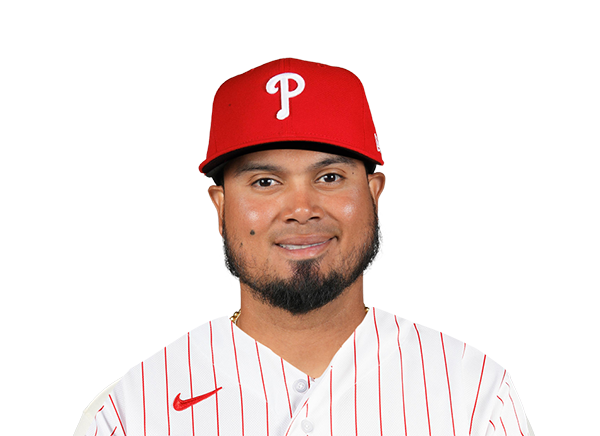 Luis Arraez | 0-3 | 3 | 0 | 0 | 0 | 0 | 0 | 0 | 13 | .310 | .345 | .419 |
 Edmundo Sosa | 0-1 | 1 | 0 | 0 | 0 | 0 | 0 | 0 | 1 | .246 | .283 | .415 |
 Alec Bohm | 0-3 | 3 | 0 | 0 | 0 | 0 | 1 | 1 | 21 | .253 | .318 | .390 |
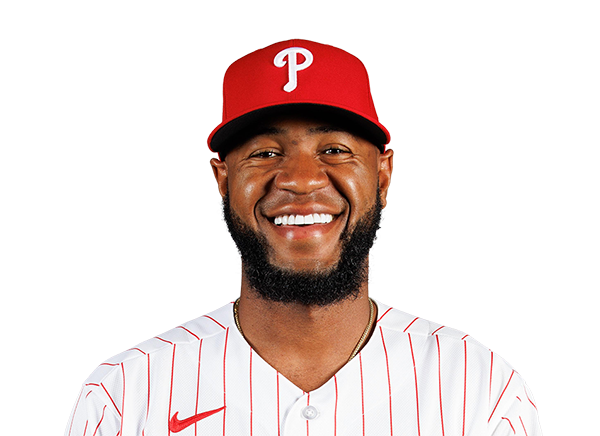 Bryan De La Cruz | 0-3 | 3 | 0 | 0 | 0 | 0 | 1 | 1 | 12 | .296 | .350 | .437 |
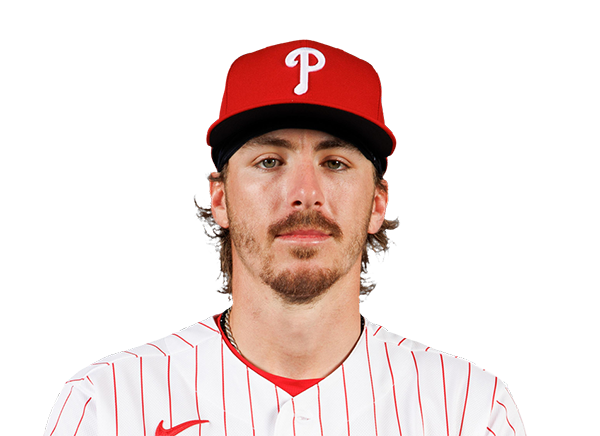 Bryson Stott | 0-3 | 3 | 0 | 0 | 0 | 0 | 1 | 1 | 17 | .249 | .328 | .390 |
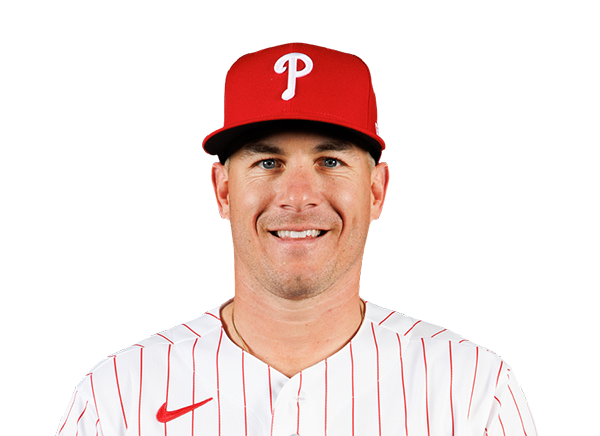 J.T. Realmuto | 0-3 | 3 | 0 | 0 | 0 | 0 | 1 | 1 | 19 | .207 | .286 | .333 |
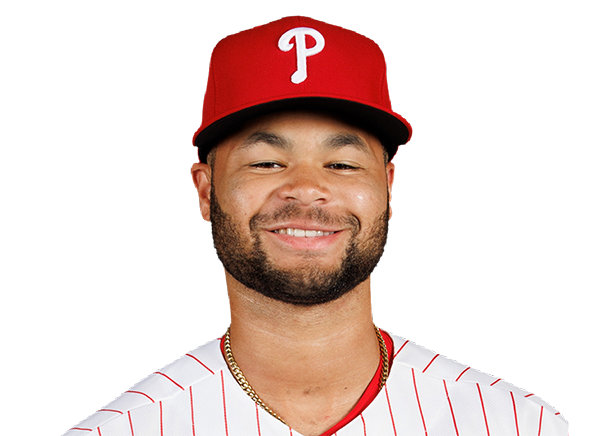 Justin Crawford | 0-2 | 2 | 0 | 0 | 0 | 0 | 0 | 1 | 6 | .263 | .310 | .355 |
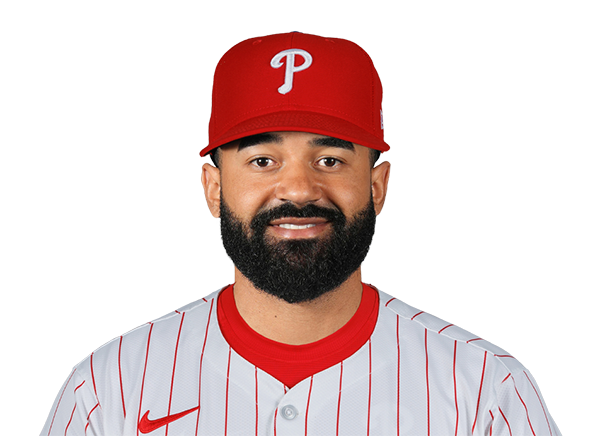 Derek Hill | 0-1 | 1 | 0 | 0 | 0 | 0 | 0 | 0 | 2 | .241 | .291 | .442 |
 Brandon Marsh | 0-1 | 1 | 0 | 0 | 0 | 0 | 0 | 0 | 1 | .261 | .306 | .412 |
Milwaukee Brewers
| Player | IP | H | R | ER | BB | K | HR | PC-ST | ERA | PC |
|---|---|---|---|---|---|---|---|---|---|---|
 Shane Drohan | 2.2 | 3 | 1 | 1 | 2 | 2 | 0 | 47-30 | 4.24 | 47 |
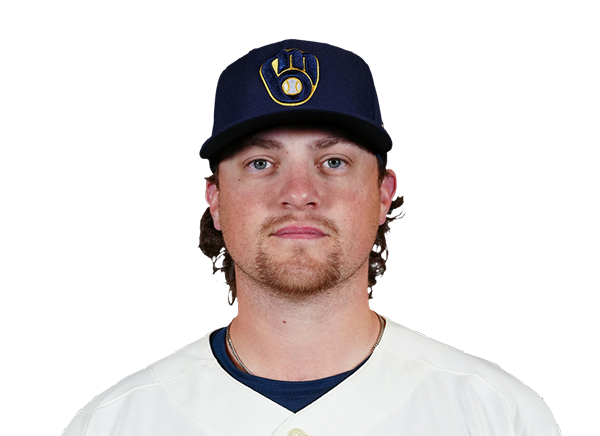 Chad Patrick | 1.1 | 0 | 0 | 0 | 1 | 0 | 0 | 16-10 | 3.07 | 16 |
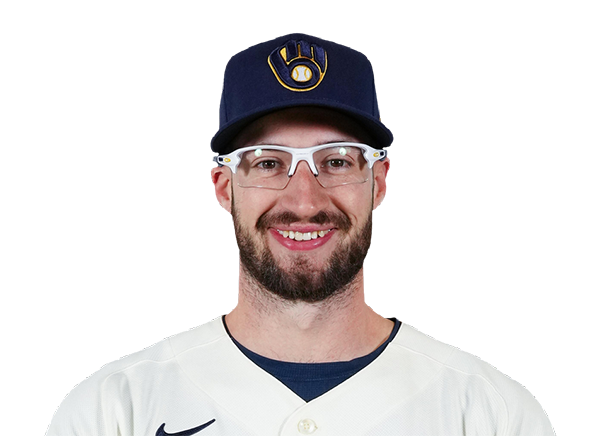 Aaron Ashby | 2.0 | 0 | 0 | 0 | 0 | 2 | 0 | 33-20 | 3.19 | 33 |
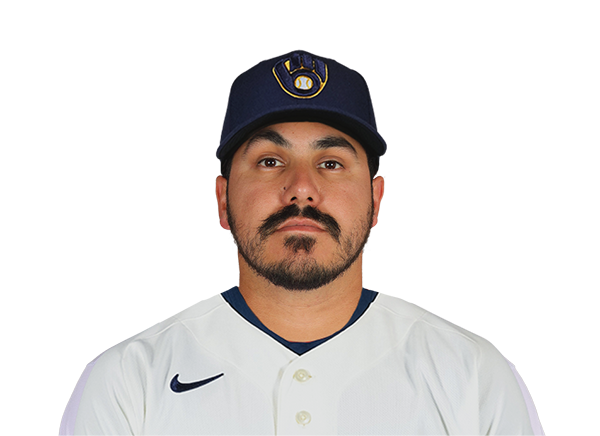 JoJo Romero | 1.1 | 1 | 0 | 0 | 0 | 1 | 0 | 17-10 | 3.46 | 17 |
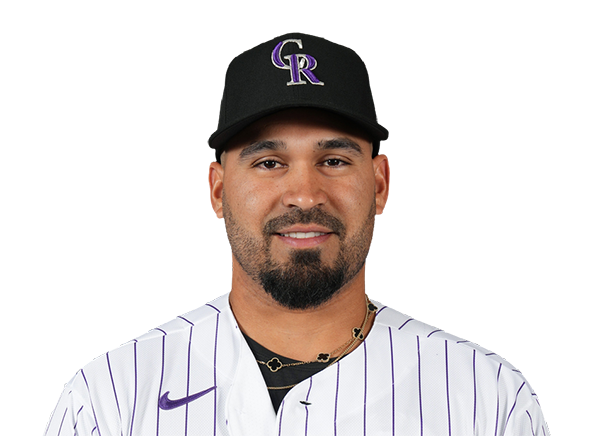 Antonio Senzatela | 1.2 | 0 | 0 | 0 | 1 | 1 | 0 | 19-12 | 4.07 | 19 |
Philadelphia Phillies
| Player | IP | H | R | ER | BB | K | HR | PC-ST | ERA | PC |
|---|---|---|---|---|---|---|---|---|---|---|
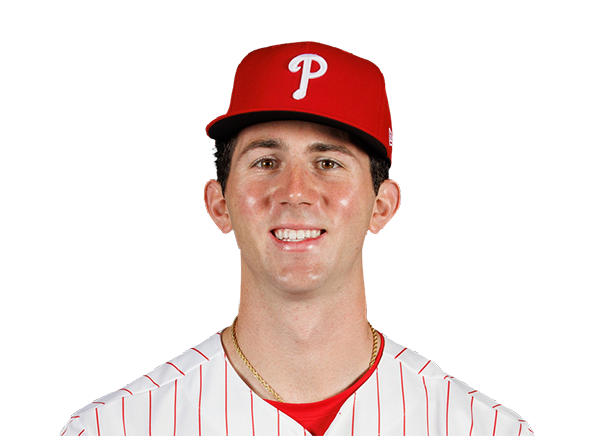 Andrew Painter | 6.0 | 5 | 1 | 1 | 3 | 8 | 0 | 93-64 | 5.40 | 93 |
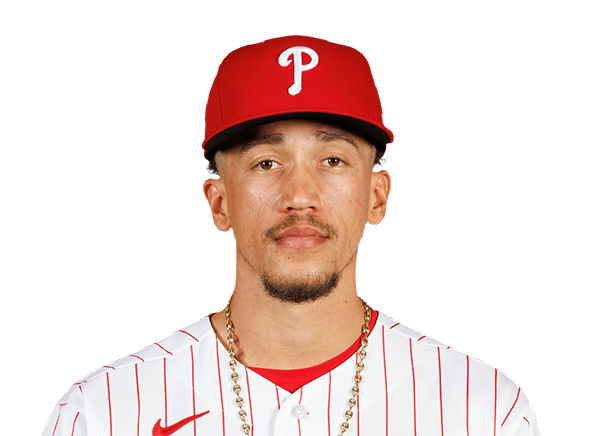 Alex McFarlane | 1.0 | 0 | 0 | 0 | 2 | 3 | 0 | 27-13 | 2.00 | 27 |
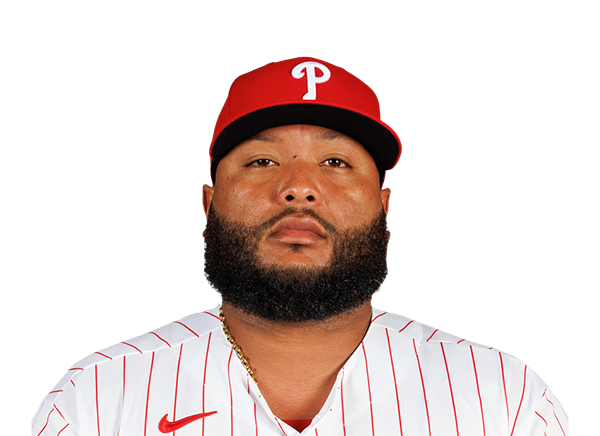 Jose Alvarado | 0.1 | 2 | 3 | 3 | 1 | 0 | 0 | 21-11 | 5.43 | 21 |
 Chase Shugart | 0.2 | 2 | 0 | 0 | 0 | 1 | 0 | 11-8 | 3.98 | 11 |
 Tim Mayza | 1.0 | 2 | 1 | 1 | 0 | 0 | 1 | 15-11 | 3.53 | 15 |
H2H / Season Series
PHI1–5
MIL
PHI1–4
MIL
PHI6–4
MIL
MIL4–0
PHI
MIL8–9
PHI
MIL6–0
PHI
Last 5 Games
| Date | Opponent | Result |
|---|---|---|
| Sep 24 | @ PHI | W5–1 |
| Sep 23 | @ PHI | W4–1 |
| Sep 22 | @ PHI | L4–6 |
| Sep 20 |  @ BAL | W3–0 |
| Sep 19 | @ BAL | W1–0 |
| Date | Opponent | Result |
|---|---|---|
| Sep 24 | vs MIL | L1–5 |
| Sep 23 | vs MIL | L1–4 |
| Sep 22 | vs MIL | W6–4 |
| Sep 20 |  @ NYM | W7–2 |
| Sep 19 | @ NYM | L3–10 |
Standings
American League
| Team | W | L | PCT | GB | DIFF | STRK |
|---|---|---|---|---|---|---|
1 Rays | 96 | 63 | .604 | - | +77 | L2 |
2 Guardians | 83 | 76 | .522 | 13 | +3 | W1 |
3 Astros | 79 | 80 | .497 | 17 | -51 | W1 |
4 Yankees | 92 | 67 | .579 | 4 | +143 | W2 |
5 Red Sox | 85 | 74 | .535 | 11 | +79 | L1 |
6 White Sox | 82 | 77 | .516 | 14 | +52 | W1 |
7 Rangers | 79 | 80 | .497 | 17 | -40 | W1 |
| 8Orioles | 78 | 81 | .491 | 18 | -26 | W3 |
9 Blue Jays | 77 | 82 | .484 | 19 | -47 | L3 |
10 Twins | 75 | 84 | .472 | 21 | -64 | W2 |
11 Tigers | 74 | 85 | .465 | 22 | +71 | L2 |
12 Mariners | 74 | 85 | .465 | 22 | -64 | L1 |
13 Royals | 68 | 91 | .428 | 28 | -112 | L1 |
14 Athletics | 63 | 96 | .396 | 33 | -219 | L1 |
15 Angels | 61 | 98 | .384 | 35 | -91 | W1 |
National League
| Team | W | L | PCT | GB | DIFF | STRK |
|---|---|---|---|---|---|---|
| 1Brewers | 100 | 59 | .629 | - | +207 | W2 |
2 Dodgers | 97 | 62 | .610 | 3 | +194 | L2 |
3 Braves | 93 | 66 | .585 | 7 | +116 | L1 |
4 Padres | 89 | 70 | .560 | 11 | +40 | W2 |
5 Cubs | 88 | 71 | .553 | 12 | +146 | W1 |
| 6Phillies | 87 | 72 | .547 | 13 | +24 | L2 |
7 Diamondbacks | 85 | 74 | .535 | 15 | +10 | W5 |
8 Pirates | 81 | 78 | .509 | 19 | +28 | W1 |
9 Marlins | 78 | 81 | .491 | 22 | +3 | L1 |
10 Cardinals | 77 | 82 | .484 | 23 | -22 | L1 |
11 Nationals | 75 | 84 | .472 | 25 | +9 | W2 |
12 Reds | 74 | 85 | .465 | 26 | -159 | W1 |
| 13Mets | 73 | 86 | .459 | 27 | -35 | L1 |
14 Giants | 65 | 94 | .409 | 35 | -84 | L2 |
15 Rockies | 57 | 102 | .358 | 43 | -188 | L4 |
MIL
VS
PHI
Pitchers
Shane Drohan
Catchers
Gary Sanchez
Infielders
Brice Turang
Jake Bauers
Cooper Pratt
Joey Ortiz
Outfielders
Garrett Mitchell
Luis Lara
Sal Frelick
Designated Hitters
William Contreras
Pitchers
Andrew Painter
Catchers
J.T. Realmuto
Infielders
Trea Turner
Luis Arraez
Alec Bohm
Bryson Stott
Outfielders
Bryce Harper
Bryan De La Cruz
Justin Crawford
Designated Hitters
Kyle Schwarber
Brewers
VS
Phillies
Batting
159
Team Games Played
159
5405
At Bats
5320
1392
Hits
1278
771
Runs Batted In
684
152
Home Runs
180
161
Stolen Bases
103
.258
Batting Average
.240
815
Runs
705
273
Doubles
238
26
Triples
23
2173
Total Bases
2102
657
Walks
517
1361
Strikeouts
1299
.340
On Base Percentage
.312
.402
Slugging Percentage
.395
.742
OBP Pct + SLG Pct
.707
159
Games Played
159
159
Games Started
159
39
Hit By Pitch
60
0.0
Wins Above Replacement
0.0
0.0
Offensive Wins Above Replacement
0.0
52
Caught Stealing
19
1
Is Qualified
1
769.9
Runs Created
670.6
4.9
Runs Created Per 27 Outs
4.3
.106
Walks Per Plate Appearance
.087
0.48
Walk To Strikeout Ratio
0.40
.144
Isolated Power
.155
.286
Secondary Average
.268
3.98
Pitches Per Plate Appearance
3.89
451
Extra Base Hits
441
6187
Plate Appearances
5968
35.6
At Bats Per Home Run
29.6
35
Sacrifice Hit
14
44
Sacrifice Flies
54
Pitching
159
Team Games Played
159
52
Quality Starts
73
100
Wins
87
59
Losses
72
53
Saves
42
85
Holds
73
1173
Hits
1335
555
Earned runs
629
166
Home Runs
187
511
Walks
477
1509
Strikeouts
1548
9.6
Strikeouts Per 9 Innings
9.9
146.1
Pitches Per Start
148.2
1.19
Walks Plus Hits Per Inning Pitched
1.28
3.52
Earned Run Average
4.01
59
Losses
72
1419.2
Innings pitched
1411.1
.629
Win Percentage
.547
73
Save Opportunities
65
.223
Opponent Batting Average
.247
.298
Opponent's On-base pct.
.314
.364
Opponent's Slugging pct.
.401
.662
Opponent's OPB Pct + SLG Pct
.715
5269
At Bats
5400
218
Doubles
219
14
Triples
24
66
Batters Hit
69
70
Stolen Bases
90
159
Games Played
159
1
Complete Games
2
12
Shutouts
19
50
Wild Pitches
40
581
Runs Batted In
647
6
Balks
3
1419.2
Innings pitched
1411.1
9.6
Strikeouts Per 9 Innings
9.9
31
Caught Stealing
37
159
Games Started
159
0.0
Wins Above Replacement
0.0
1
Is Qualified
1
608
Runs
681
555
Earned Runs
629
1917
Total Bases
2163
Fielding
159
Team Games Played
159
1420
Full Innings
1411
5584
Total Chances
5626
4259
Putouts
4234
1254
Assists
1314
71
Errors
78
273
Double Plays
238
0.987
Fielding Percentage
0.986
35.0
Range Factor
35.4
0.0
Zone Rating
0.0
159
Games Played
159
0
Games Started
0
0.0
Defensive Wins Above Replacement
0.0
1
Qualified
1