

Brewers vs Pirates Live Score (17 Sep, 2026)
Game Information
Stage
STD
Season
2026
First Pitch
Thu, Sep 17, 12:35 pm
Venue
PNC Park
Location
Pittsburgh, Pennsylvania
Venue Type
Outdoor
Broadcast
MLB.TV
Attendance
10,818
Live Situation
1Balls
2Strikes
0Outs
—Pitcher
—At Bat
Pitch Sequence
1
BALL
Sinker
98 MPH
2
STRIKE LOOKING
Sinker
97 MPH
3
STRIKE LOOKING
Sinker
98 MPH
4
BALL IN PLAY
Sinker
99 MPH
Injury Report
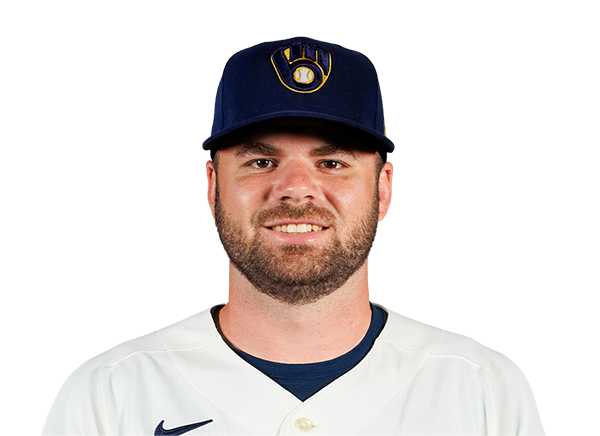
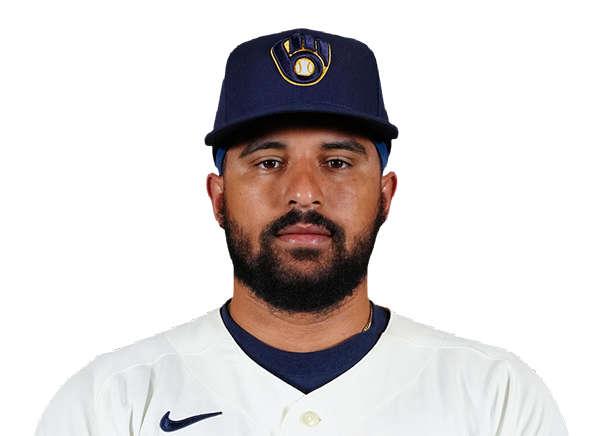
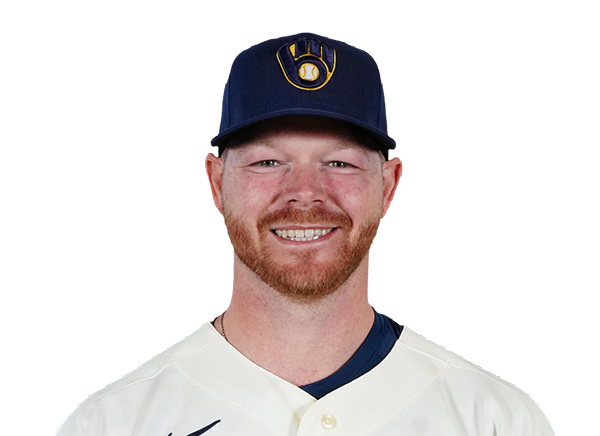




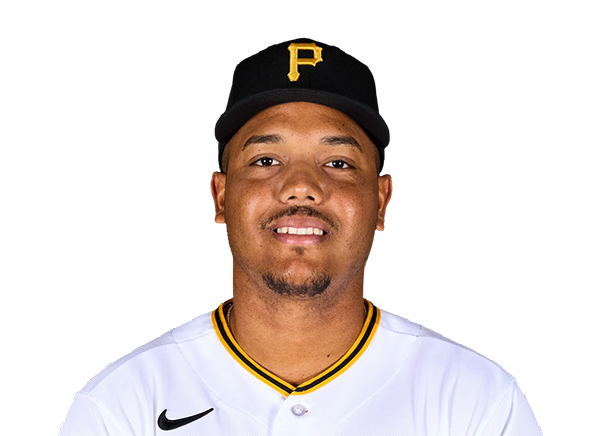
Team Stats
 MIL
PIT


4
Runs
7
9
Hits
7
1
Errors
1
1
Home Runs
1
6
Walks
5
9
Strikeouts
11
Player Box Score
Milwaukee Brewers
| Player | H-AB | AB | R | H | RBI | HR | BB | K | #P | AVG | OBP | SLG |
|---|---|---|---|---|---|---|---|---|---|---|---|---|
 Brice Turang | 1-4 | 4 | 0 | 1 | 0 | 0 | 1 | 2 | 24 | .265 | .367 | .442 |
 Luis Lara | 0-4 | 4 | 0 | 0 | 0 | 0 | 1 | 1 | 15 | .254 | .323 | .343 |
 Jackson Chourio | 0-4 | 4 | 0 | 0 | 0 | 0 | 1 | 2 | 20 | .286 | .343 | .481 |
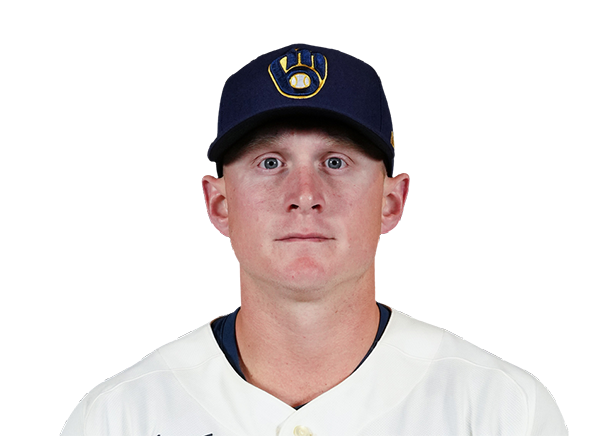 Andrew Vaughn | 0-4 | 4 | 0 | 0 | 0 | 0 | 1 | 1 | 22 | .311 | .396 | .452 |
 Gary Sanchez | 1-3 | 3 | 0 | 1 | 0 | 0 | 0 | 1 | 10 | .208 | .352 | .420 |
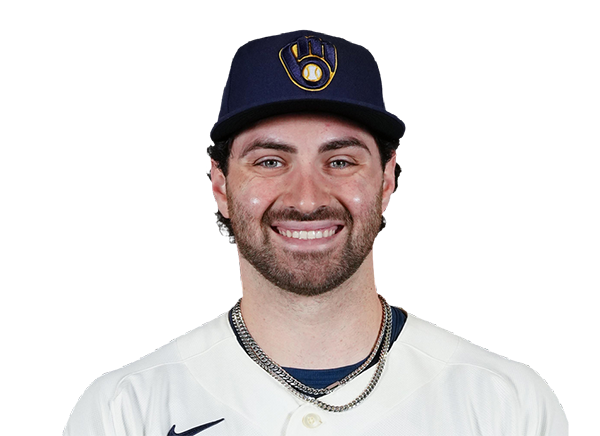 Garrett Mitchell | 1-2 | 2 | 1 | 1 | 0 | 0 | 0 | 1 | 7 | .270 | .361 | .435 |
 Joey Ortiz | 1-4 | 4 | 2 | 1 | 0 | 0 | 1 | 0 | 20 | .269 | .328 | .404 |
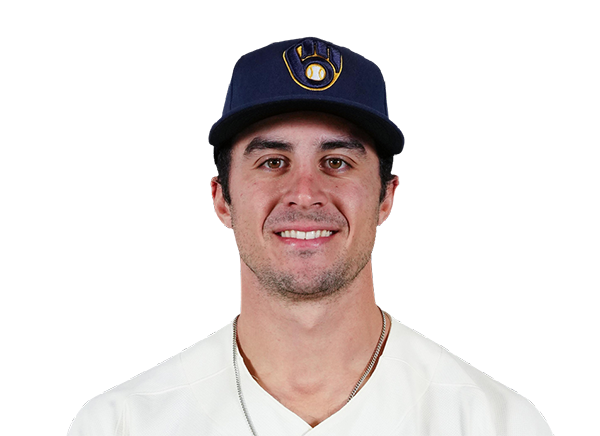 Sal Frelick | 2-3 | 3 | 0 | 2 | 1 | 0 | 0 | 0 | 12 | .234 | .295 | .323 |
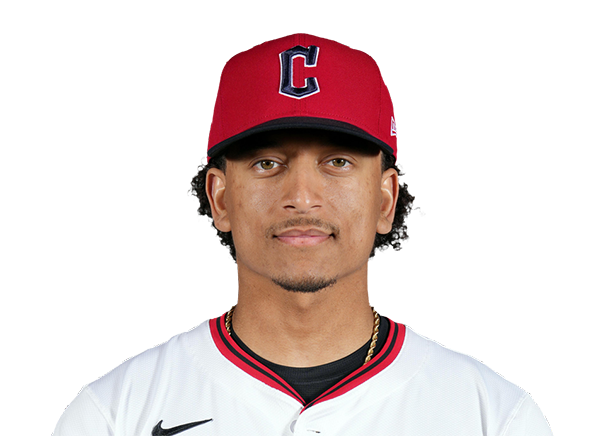 Bo Naylor | 1-3 | 3 | 1 | 1 | 2 | 1 | 1 | 1 | 23 | .154 | .214 | .275 |
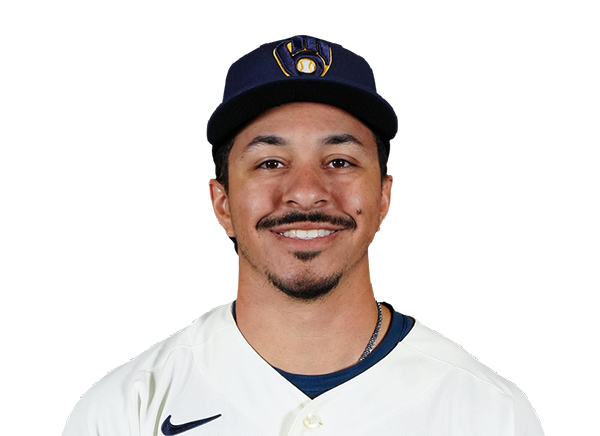 David Hamilton | 1-2 | 2 | 0 | 1 | 1 | 0 | 0 | 0 | 7 | .243 | .312 | .333 |
 Cooper Pratt | 1-2 | 2 | 0 | 1 | 0 | 0 | 0 | 0 | 6 | .279 | .345 | .373 |
Pittsburgh Pirates
| Player | H-AB | AB | R | H | RBI | HR | BB | K | #P | AVG | OBP | SLG |
|---|---|---|---|---|---|---|---|---|---|---|---|---|
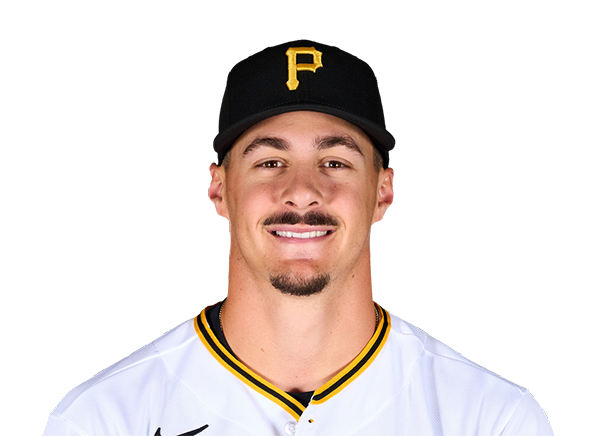 Konnor Griffin | 1-4 | 4 | 1 | 1 | 2 | 0 | 1 | 1 | 21 | .262 | .317 | .385 |
 Oneil Cruz | 1-5 | 5 | 1 | 1 | 2 | 0 | 0 | 2 | 27 | .272 | .361 | .478 |
 Bryan Reynolds | 1-4 | 4 | 0 | 1 | 0 | 0 | 0 | 0 | 21 | .262 | .366 | .424 |
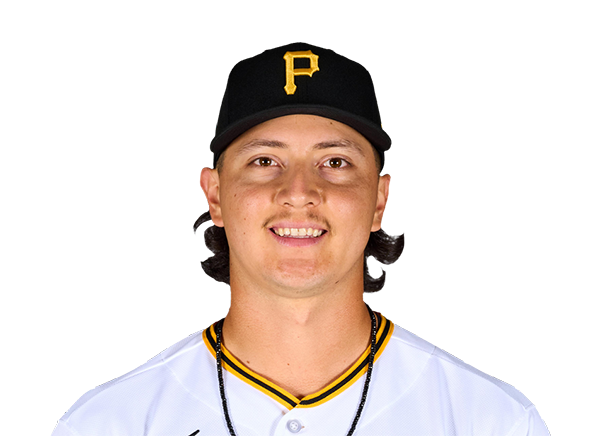 Rafael Flores Jr. | 0-3 | 3 | 0 | 0 | 0 | 0 | 1 | 2 | 17 | .268 | .331 | .512 |
 Brandon Lowe | 1-2 | 2 | 0 | 1 | 1 | 0 | 1 | 1 | 13 | .261 | .332 | .486 |
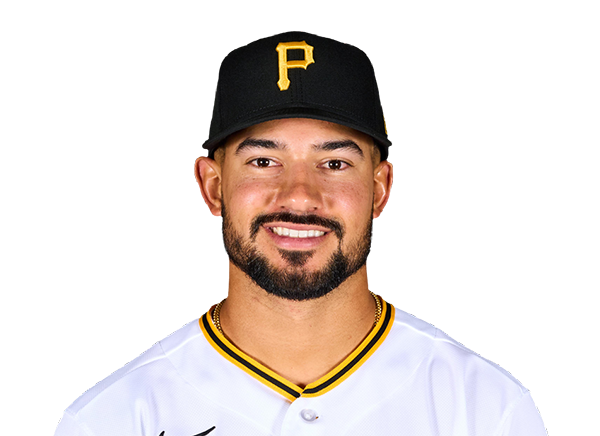 Nick Gonzales | 0-4 | 4 | 0 | 0 | 0 | 0 | 0 | 3 | 14 | .304 | .367 | .392 |
 Ronny Simon | 1-3 | 3 | 2 | 1 | 0 | 0 | 1 | 0 | 10 | .325 | .372 | .375 |
 Billy Cook | 0-0 | 0 | 0 | 0 | 0 | 0 | 0 | 0 | 0 | .176 | .208 | .235 |
 Jared Triolo | 1-4 | 4 | 1 | 1 | 0 | 0 | 0 | 1 | 10 | .241 | .312 | .308 |
 Henry Davis | 1-2 | 2 | 2 | 1 | 2 | 1 | 1 | 1 | 16 | .167 | .269 | .309 |
Milwaukee Brewers
| Player | IP | H | R | ER | BB | K | HR | PC-ST | ERA | PC |
|---|---|---|---|---|---|---|---|---|---|---|
 Kyle Harrison | 1.2 | 4 | 5 | 4 | 2 | 2 | 0 | 50-29 | 4.25 | 50 |
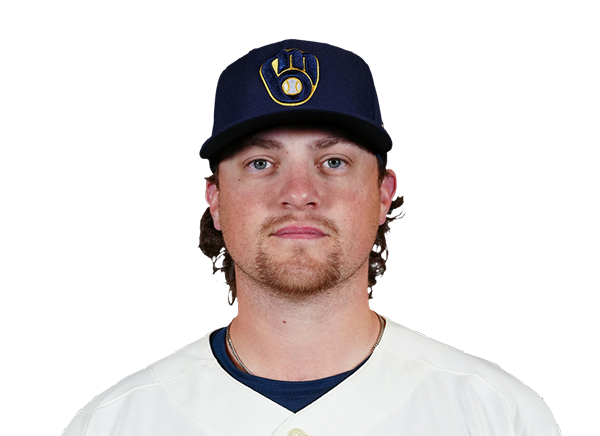 Chad Patrick | 1.1 | 0 | 0 | 0 | 1 | 2 | 0 | 20-11 | 3.16 | 20 |
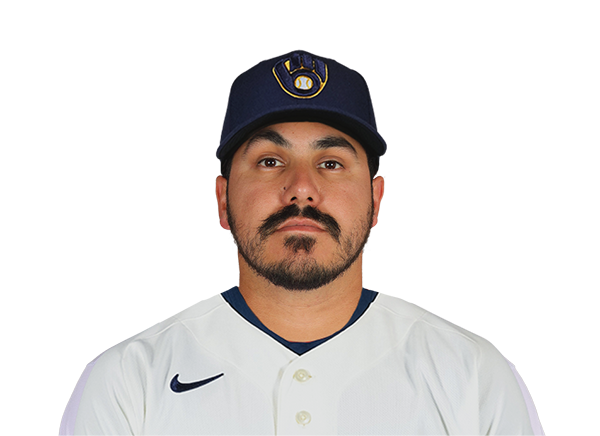 JoJo Romero | 1.0 | 0 | 0 | 0 | 0 | 1 | 0 | 11-7 | 3.66 | 11 |
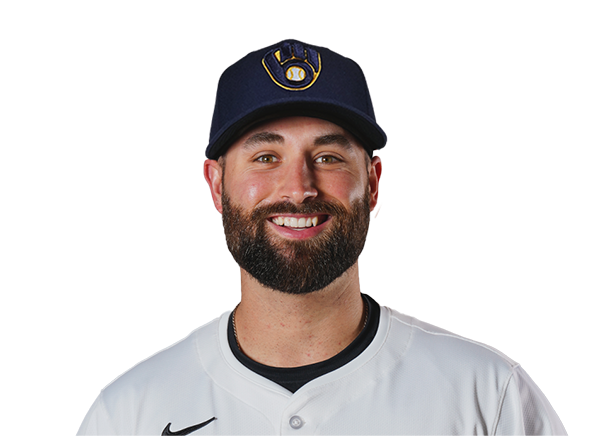 Garrett Stallings | 3.0 | 1 | 0 | 0 | 1 | 6 | 0 | 42-29 | 0.00 | 42 |
 Aaron Ashby | 1.0 | 2 | 2 | 2 | 1 | 0 | 1 | 26-14 | 3.31 | 26 |
Pittsburgh Pirates
| Player | IP | H | R | ER | BB | K | HR | PC-ST | ERA | PC |
|---|---|---|---|---|---|---|---|---|---|---|
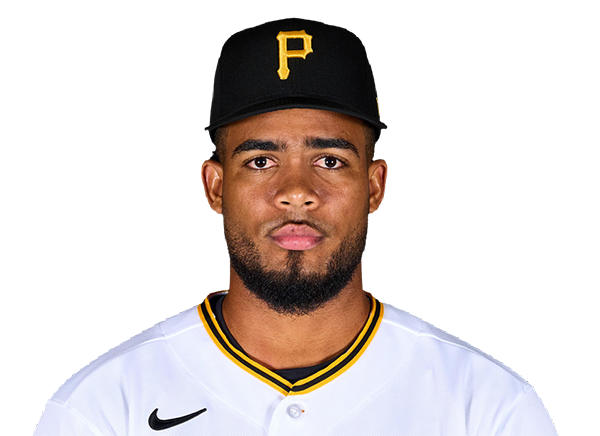 Wilber Dotel | 2.0 | 3 | 1 | 1 | 1 | 2 | 0 | 30-20 | 4.82 | 30 |
 Khristian Curtis | 3.1 | 1 | 1 | 1 | 3 | 3 | 0 | 61-37 | 4.67 | 61 |
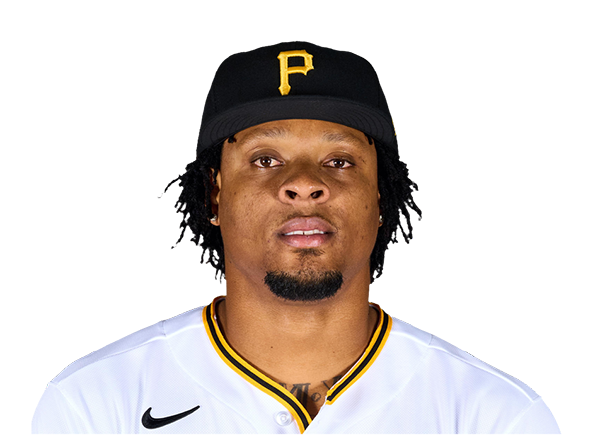 Gregory Soto | 0.2 | 1 | 0 | 0 | 0 | 0 | 0 | 16-12 | 3.84 | 16 |
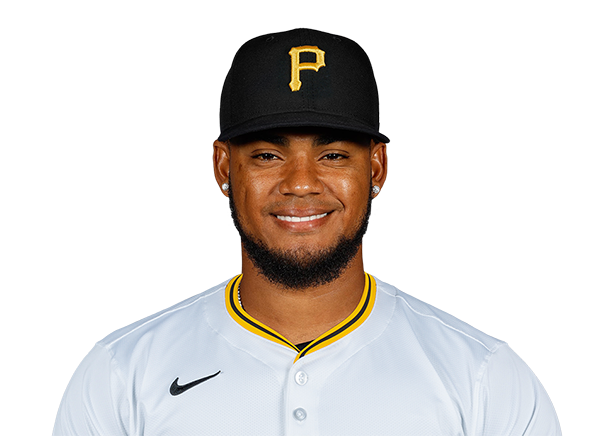 Camilo Doval | 1.0 | 1 | 0 | 0 | 0 | 2 | 0 | 13-8 | 4.06 | 13 |
 Luke Weaver | 0.2 | 3 | 2 | 2 | 0 | 0 | 1 | 17-11 | 2.84 | 17 |
 Mason Montgomery | 1.1 | 0 | 0 | 0 | 2 | 2 | 0 | 29-17 | 2.67 | 29 |
H2H / Season Series
PIT7–4
MIL
PIT4–5
MIL
PIT1–5
MIL
MIL5–2
PIT
MIL4–2
PIT
MIL4–2
PIT
MIL3–4
PIT
PIT14–5
MIL
PIT3–2
MIL
PIT7–6
MIL
Last 5 Games
| Date | Opponent | Result |
|---|---|---|
| Sep 17 | @ PIT | L4–7 |
| Sep 16 | @ PIT | W5–4 |
| Sep 15 | @ PIT | W5–1 |
| Sep 13 |  vs CIN | L3–4 |
| Sep 12 | vs CIN | W13–9 |
| Date | Opponent | Result |
|---|---|---|
| Sep 17 | vs MIL | W7–4 |
| Sep 16 | vs MIL | L4–5 |
| Sep 15 | vs MIL | L1–5 |
| Sep 13 |  @ CHC | W4–3 |
| Sep 12 | @ CHC | L3–4 |
Standings
American League
| Team | W | L | PCT | GB | DIFF | STRK |
|---|---|---|---|---|---|---|
1 Rays | 93 | 59 | .612 | - | +80 | W6 |
2 White Sox | 78 | 75 | .510 | 15.5 | +36 | W1 |
3 Astros | 77 | 76 | .503 | 16.5 | -50 | W1 |
4 Yankees | 88 | 64 | .579 | 5 | +136 | L1 |
5 Red Sox | 82 | 70 | .539 | 11 | +82 | L2 |
6 Guardians | 78 | 75 | .510 | 15.5 | -7 | W2 |
7 Rangers | 76 | 76 | .500 | 17 | -38 | W4 |
8 Blue Jays | 76 | 77 | .497 | 17.5 | -37 | W1 |
9 Orioles | 75 | 78 | .490 | 18.5 | -26 | W3 |
10 Tigers | 72 | 81 | .471 | 21.5 | +74 | L2 |
11 Twins | 71 | 81 | .467 | 22 | -73 | W1 |
12 Mariners | 71 | 82 | .464 | 22.5 | -56 | W1 |
13 Royals | 67 | 86 | .438 | 26.5 | -97 | L1 |
14 Athletics | 61 | 92 | .399 | 32.5 | -214 | L3 |
15 Angels | 58 | 94 | .382 | 35 | -78 | L1 |
National League
| Team | W | L | PCT | GB | DIFF | STRK |
|---|---|---|---|---|---|---|
| 1Brewers | 95 | 58 | .621 | - | +197 | L1 |
2 Dodgers | 93 | 60 | .608 | 2 | +179 | W1 |
3 Braves | 89 | 64 | .582 | 6 | +111 | L1 |
| 4Cubs | 85 | 68 | .556 | 10 | +143 | W1 |
5 Phillies | 85 | 68 | .556 | 10 | +34 | W2 |
6 Padres | 84 | 69 | .549 | 11 | +30 | W2 |
7 Diamondbacks | 80 | 73 | .523 | 15 | 0 | L2 |
8 Marlins | 76 | 77 | .497 | 19 | +8 | W2 |
| 9Pirates | 76 | 77 | .497 | 19 | +24 | W1 |
10 Cardinals | 75 | 78 | .490 | 20 | -14 | L2 |
11 Nationals | 71 | 82 | .464 | 24 | +3 | L1 |
| 12Reds | 71 | 82 | .464 | 24 | -154 | L1 |
13 Mets | 69 | 84 | .451 | 26 | -46 | L5 |
14 Giants | 64 | 89 | .418 | 31 | -70 | W2 |
15 Rockies | 56 | 97 | .366 | 39 | -177 | L2 |
MIL
VS
PIT
Pitchers
Kyle Harrison
Catchers
Bo Naylor
Infielders
Brice Turang
Andrew Vaughn
Joey Ortiz
David Hamilton
Outfielders
Luis Lara
Jackson Chourio
Sal Frelick
Designated Hitters
Gary Sanchez
Pitchers
Wilber Dotel
Catchers
Henry Davis
Infielders
Konnor Griffin
Rafael Flores Jr.
Brandon Lowe
Jared Triolo
Outfielders
Oneil Cruz
Bryan Reynolds
Ronny Simon
Designated Hitters
Nick Gonzales
Brewers
VS
Pirates
Batting
153
Team Games Played
153
5208
At Bats
5257
1350
Hits
1331
748
Runs Batted In
697
147
Home Runs
175
148
Stolen Bases
126
.259
Batting Average
.253
792
Runs
730
268
Doubles
229
25
Triples
15
2109
Total Bases
2115
635
Walks
541
1288
Strikeouts
1429
.342
On Base Percentage
.330
.405
Slugging Percentage
.402
.747
OBP Pct + SLG Pct
.733
153
Games Played
153
153
Games Started
153
39
Hit By Pitch
81
0.0
Wins Above Replacement
0.0
0.0
Offensive Wins Above Replacement
0.0
49
Caught Stealing
27
1
Is Qualified
1
750.7
Runs Created
713.5
5.0
Runs Created Per 27 Outs
4.7
.106
Walks Per Plate Appearance
.091
0.49
Walk To Strikeout Ratio
0.38
.146
Isolated Power
.149
.287
Secondary Average
.271
3.98
Pitches Per Plate Appearance
3.91
440
Extra Base Hits
419
5966
Plate Appearances
5927
35.4
At Bats Per Home Run
30.0
34
Sacrifice Hit
12
43
Sacrifice Flies
32
Pitching
153
Team Games Played
153
51
Quality Starts
45
95
Wins
76
58
Losses
77
48
Saves
35
79
Holds
73
1135
Hits
1222
543
Earned runs
635
164
Home Runs
146
491
Walks
558
1467
Strikeouts
1398
9.7
Strikeouts Per 9 Innings
9.2
146.2
Pitches Per Start
149.8
1.19
Walks Plus Hits Per Inning Pitched
1.30
3.58
Earned Run Average
4.19
58
Losses
77
1365.2
Innings pitched
1365.1
.621
Win Percentage
.497
67
Save Opportunities
59
.224
Opponent Batting Average
.237
.299
Opponent's On-base pct.
.319
.367
Opponent's Slugging pct.
.381
.666
Opponent's OPB Pct + SLG Pct
.701
5072
At Bats
5155
207
Doubles
276
14
Triples
15
62
Batters Hit
84
69
Stolen Bases
94
153
Games Played
153
1
Complete Games
1
10
Shutouts
11
47
Wild Pitches
51
569
Runs Batted In
663
6
Balks
6
1365.2
Innings pitched
1365.1
9.7
Strikeouts Per 9 Innings
9.2
31
Caught Stealing
31
153
Games Started
153
0.0
Wins Above Replacement
0.0
1
Is Qualified
1
595
Runs
706
543
Earned Runs
635
1862
Total Bases
1966
Fielding
153
Team Games Played
153
1366
Full Innings
1365
5363
Total Chances
5403
4097
Putouts
4096
1198
Assists
1214
68
Errors
93
268
Double Plays
229
0.987
Fielding Percentage
0.983
34.9
Range Factor
35.0
0.0
Zone Rating
0.0
153
Games Played
153
0
Games Started
0
0.0
Defensive Wins Above Replacement
0.0
1
Qualified
1