

Brewers vs Rockies Live Score (6 Jun, 2026)
Game Information
Stage
Standard
Season
2026
First Pitch
Fri, Jun 5, 8:40 pm
Venue
Coors Field
Location
Denver, Colorado
Attendance
31,349
Live Situation
2Balls
3Strikes
0Outs
—Pitcher
—At Bat
Pitch Sequence
1
BALL
Sinker
97 MPH
2
BALL
Sinker
98 MPH
3
STRIKE FOUL
Sinker
98 MPH
4
STRIKE LOOKING
Sinker
97 MPH
5
STRIKE SWINGING
Slider
85 MPH
Injury Report

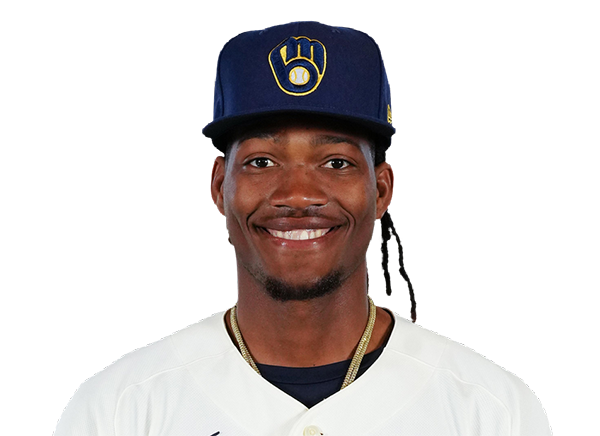
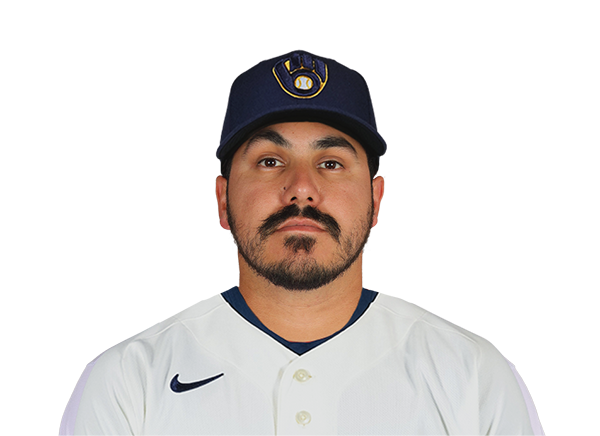

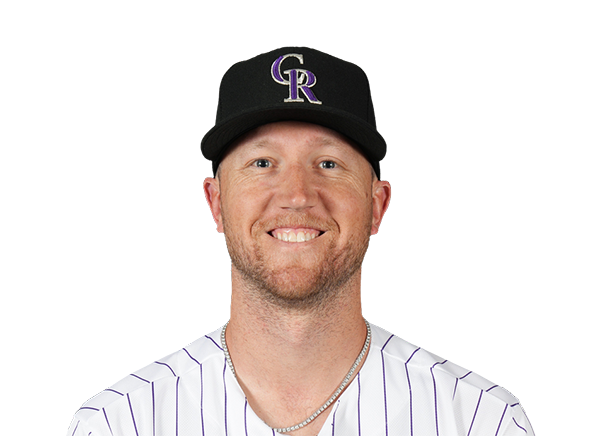
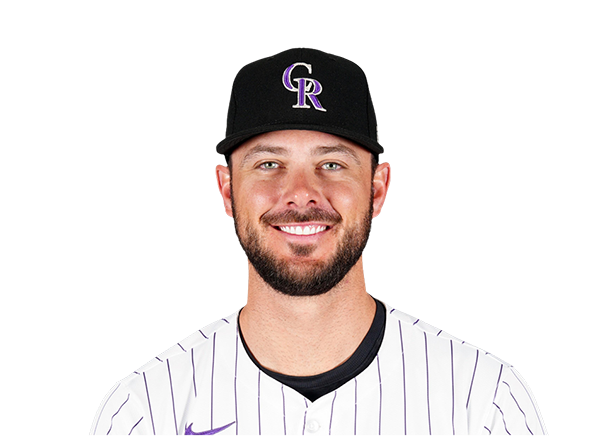
Team Stats
 MIL
COL


9
Runs
7
8
Hits
11
0
Errors
1
0
Home Runs
1
6
Walks
6
11
Strikeouts
8
Player Box Score
Milwaukee Brewers
| Player | H-AB | AB | R | H | RBI | HR | BB | K | #P | AVG | OBP | SLG |
|---|---|---|---|---|---|---|---|---|---|---|---|---|
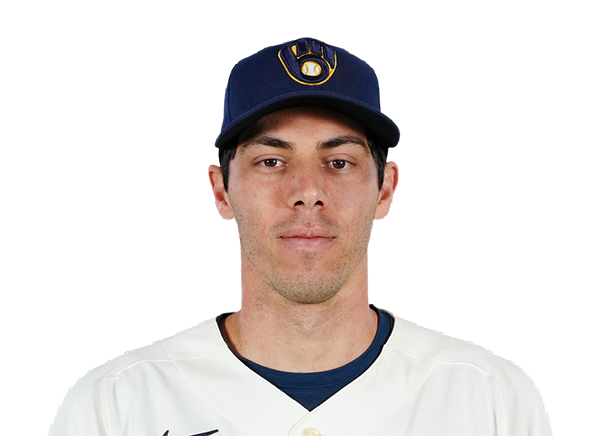 Christian Yelich | 0-5 | 5 | 1 | 0 | 0 | 0 | 0 | 2 | 20 | .278 | .350 | .444 |
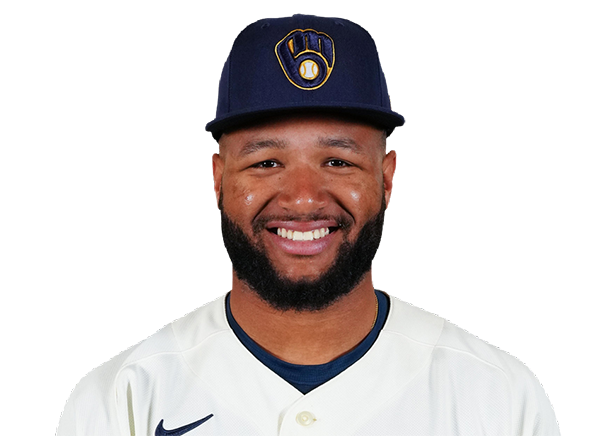 Jackson Chourio | 0-5 | 5 | 0 | 0 | 0 | 0 | 0 | 2 | 21 | .295 | .358 | .482 |
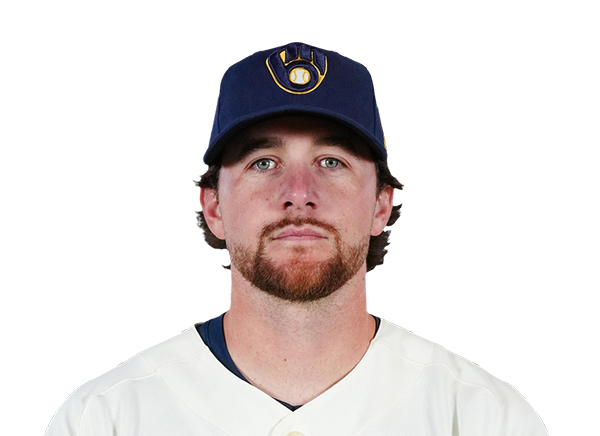 Brice Turang | 1-4 | 4 | 2 | 1 | 0 | 0 | 1 | 2 | 18 | .280 | .405 | .460 |
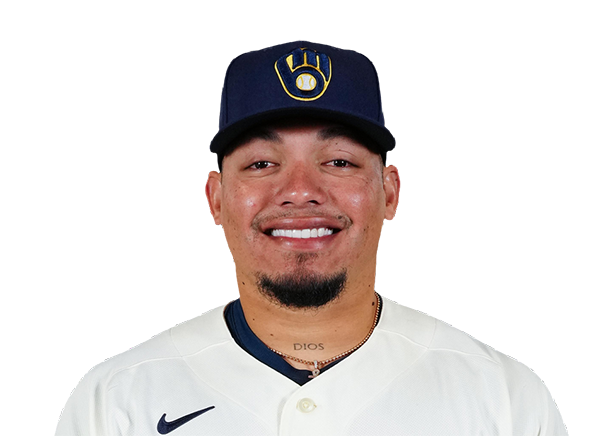 William Contreras | 0-4 | 4 | 0 | 0 | 0 | 0 | 0 | 0 | 6 | .280 | .341 | .378 |
 Blake Perkins | 0-0 | 0 | 1 | 0 | 0 | 0 | 0 | 0 | 0 | .091 | .200 | .136 |
 Gary Sanchez | 0-0 | 0 | 1 | 0 | 0 | 0 | 1 | 0 | 7 | .196 | .355 | .402 |
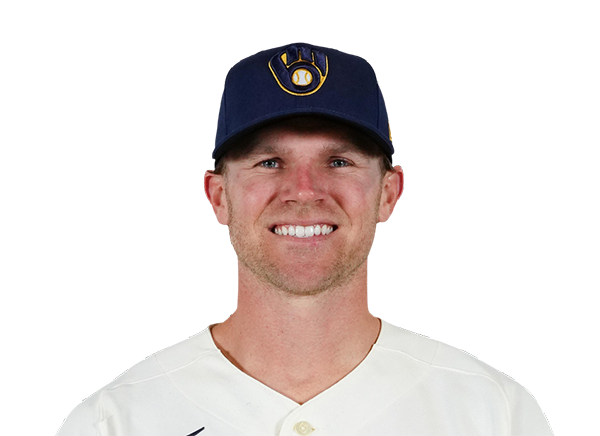 Jake Bauers | 3-5 | 5 | 3 | 3 | 3 | 0 | 0 | 1 | 18 | .277 | .361 | .497 |
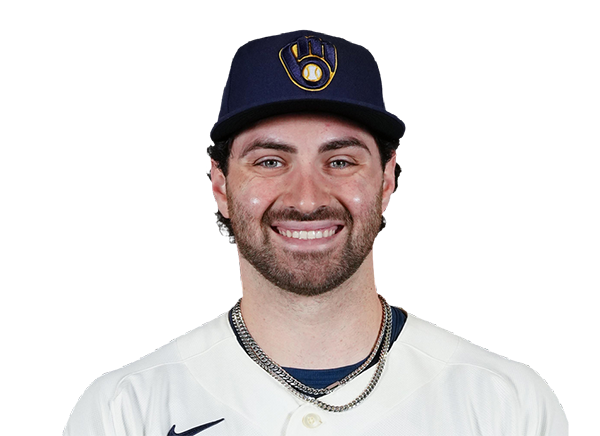 Garrett Mitchell | 1-5 | 5 | 0 | 1 | 1 | 0 | 0 | 1 | 17 | .233 | .353 | .365 |
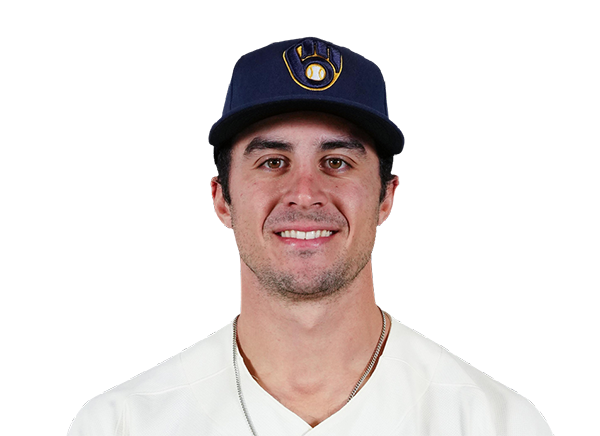 Sal Frelick | 2-3 | 3 | 1 | 2 | 2 | 0 | 2 | 0 | 22 | .230 | .302 | .319 |
 Luis Rengifo | 0-3 | 3 | 0 | 0 | 1 | 0 | 0 | 0 | 10 | .200 | .271 | .247 |
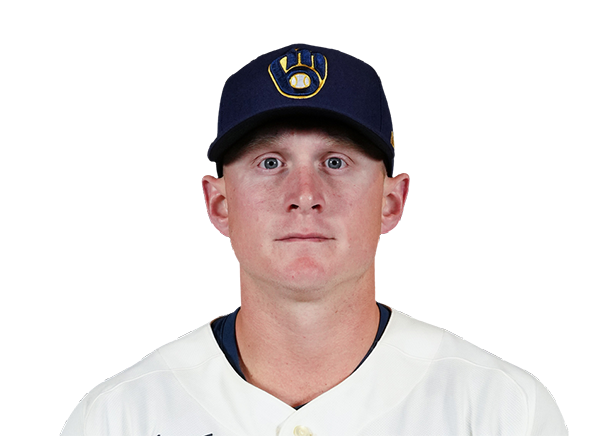 Andrew Vaughn | 1-1 | 1 | 0 | 1 | 2 | 0 | 0 | 0 | 4 | .329 | .395 | .466 |
 Joey Ortiz | 0-0 | 0 | 0 | 0 | 0 | 0 | 1 | 0 | 4 | .192 | .298 | .242 |
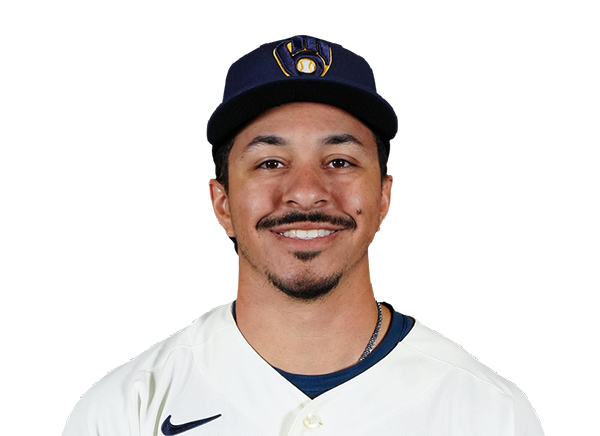 David Hamilton | 0-4 | 4 | 0 | 0 | 0 | 0 | 1 | 3 | 23 | .224 | .317 | .299 |
Colorado Rockies
| Player | H-AB | AB | R | H | RBI | HR | BB | K | #P | AVG | OBP | SLG |
|---|---|---|---|---|---|---|---|---|---|---|---|---|
 Jake McCarthy | 2-6 | 6 | 1 | 2 | 0 | 0 | 0 | 2 | 21 | .286 | .330 | .466 |
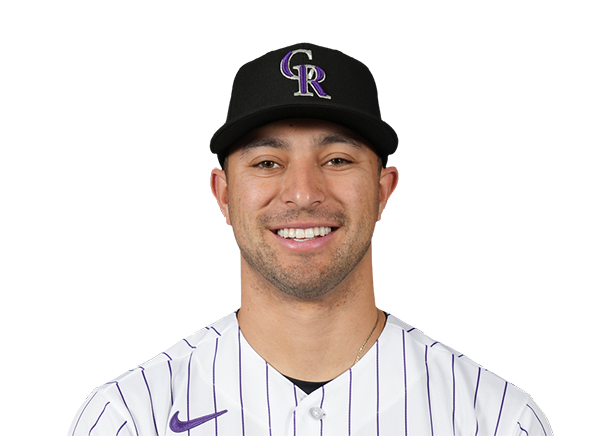 Tyler Freeman | 1-4 | 4 | 0 | 1 | 1 | 0 | 1 | 0 | 15 | .277 | .354 | .376 |
 TJ Rumfield | 0-3 | 3 | 0 | 0 | 0 | 0 | 1 | 1 | 14 | .277 | .353 | .432 |
 Chad Stevens | 0-0 | 0 | 0 | 0 | 1 | 0 | 1 | 0 | 6 | .050 | .231 | .050 |
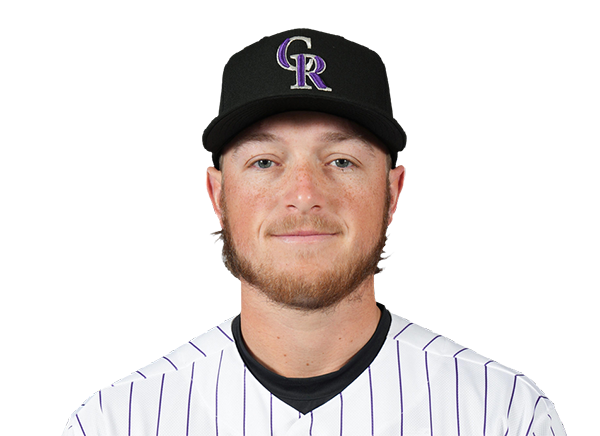 Hunter Goodman | 1-3 | 3 | 1 | 1 | 2 | 1 | 1 | 1 | 23 | .245 | .316 | .514 |
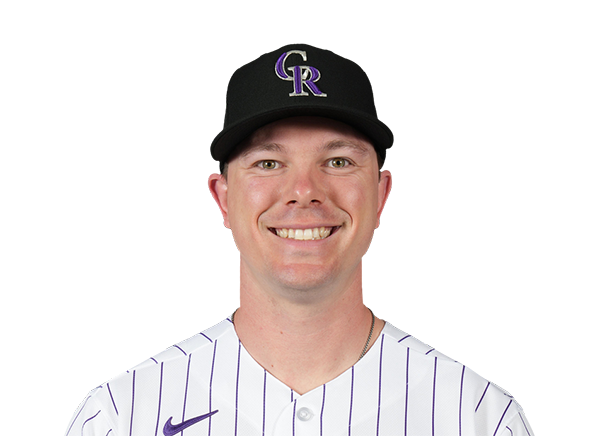 Troy Johnston | 0-5 | 5 | 1 | 0 | 0 | 0 | 0 | 0 | 12 | .312 | .368 | .426 |
 Willi Castro | 1-3 | 3 | 1 | 1 | 0 | 0 | 1 | 0 | 15 | .257 | .333 | .363 |
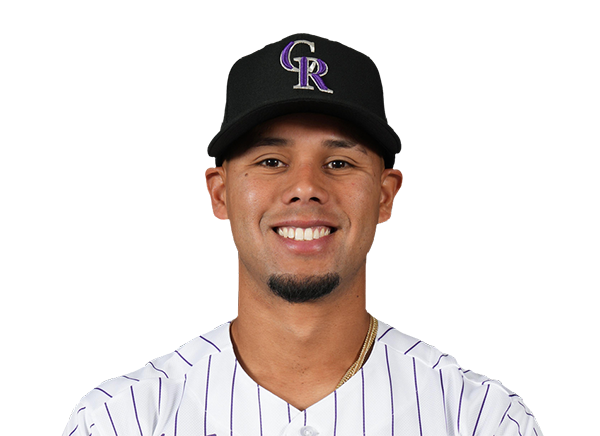 Ezequiel Tovar | 1-4 | 4 | 1 | 1 | 0 | 0 | 1 | 1 | 24 | .212 | .264 | .325 |
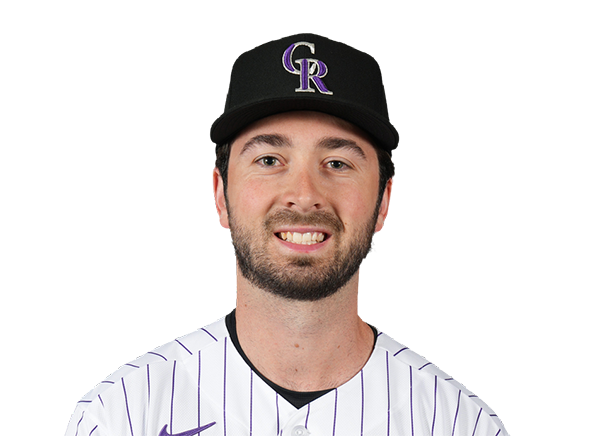 Sterlin Thompson | 3-5 | 5 | 1 | 3 | 2 | 0 | 0 | 1 | 23 | .233 | .340 | .279 |
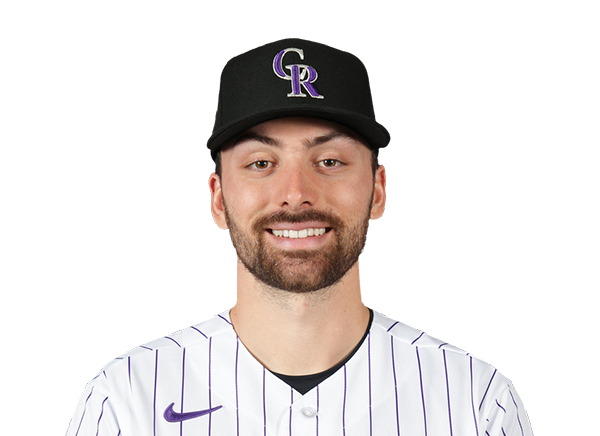 Edouard Julien | 1-2 | 2 | 0 | 1 | 1 | 0 | 0 | 1 | 9 | .221 | .326 | .302 |
 Kyle Karros | 1-2 | 2 | 0 | 1 | 0 | 0 | 0 | 1 | 9 | .222 | .322 | .324 |
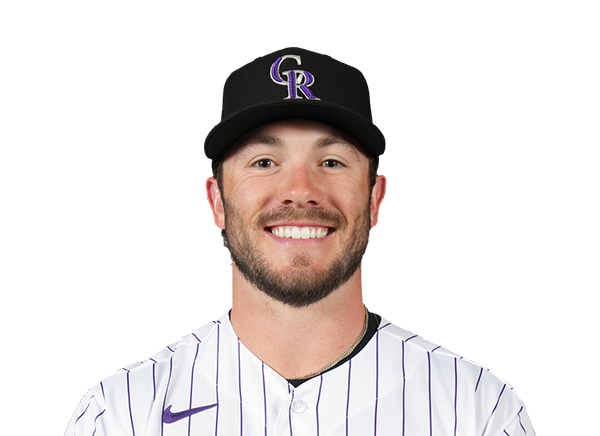 Braxton Fulford | 0-0 | 0 | 1 | 0 | 0 | 0 | 0 | 0 | 0 | .200 | .261 | .350 |
 Brett Sullivan | 0-1 | 1 | 0 | 0 | 0 | 0 | 0 | 0 | 1 | .193 | .236 | .301 |
Milwaukee Brewers
| Player | IP | H | R | ER | BB | K | HR | PC-ST | ERA | PC |
|---|---|---|---|---|---|---|---|---|---|---|
 Brandon Sproat | 5.0 | 7 | 3 | 3 | 2 | 2 | 1 | 87-51 | 6.17 | 87 |
 Brian Fitzpatrick | 1.0 | 0 | 0 | 0 | 0 | 1 | 0 | 14-11 | 1.35 | 14 |
 Craig Yoho | 2.0 | 0 | 0 | 0 | 2 | 3 | 0 | 35-20 | 0.00 | 35 |
 Trevor Megill | 1.0 | 3 | 2 | 2 | 1 | 1 | 0 | 18-13 | 4.70 | 18 |
 Aaron Ashby | 1.0 | 1 | 2 | 1 | 1 | 1 | 0 | 18-8 | 2.35 | 18 |
Colorado Rockies
| Player | IP | H | R | ER | BB | K | HR | PC-ST | ERA | PC |
|---|---|---|---|---|---|---|---|---|---|---|
 Ryan Feltner | 6.0 | 1 | 1 | 1 | 2 | 4 | 0 | 81-51 | 4.22 | 81 |
 Jaden Hill | 1.0 | 0 | 0 | 0 | 1 | 1 | 0 | 13-6 | 3.27 | 13 |
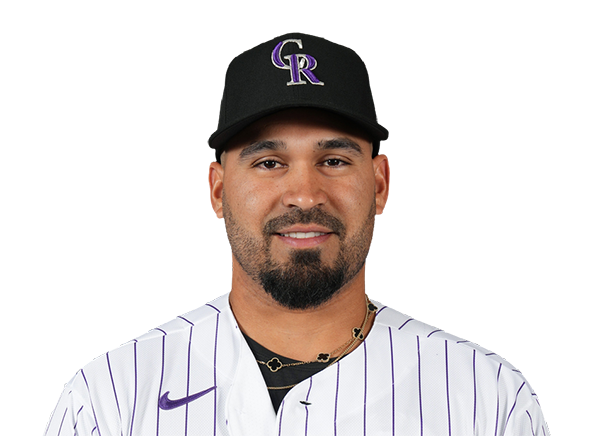 Antonio Senzatela | 1.2 | 4 | 4 | 3 | 0 | 4 | 0 | 39-25 | 1.98 | 39 |
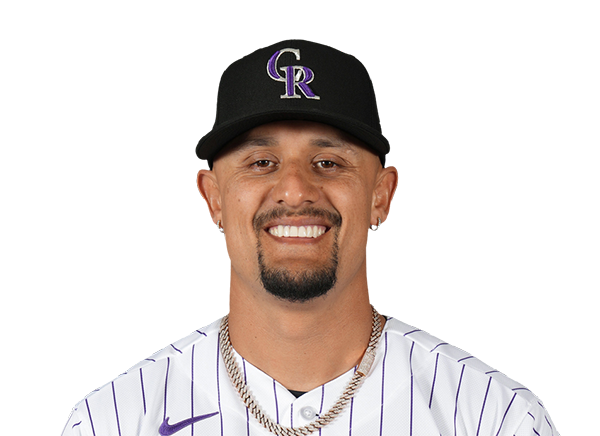 Brennan Bernardino | 0.1 | 0 | 0 | 0 | 0 | 0 | 0 | 2-1 | 3.65 | 2 |
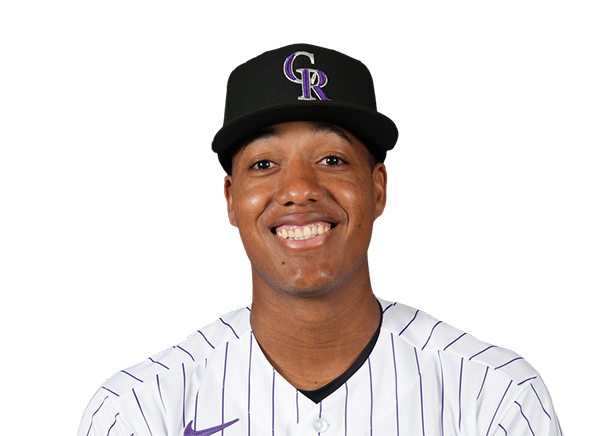 Juan Mejia | 0.1 | 3 | 4 | 3 | 2 | 1 | 0 | 22-12 | 6.67 | 22 |
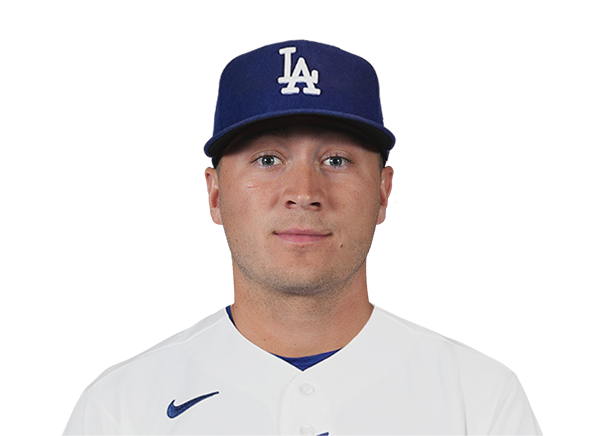 Seth Halvorsen | 0.2 | 0 | 0 | 0 | 1 | 1 | 0 | 13-5 | 2.57 | 13 |
H2H / Season Series
MIL11–2
COL
MIL8–5
COL
MIL2–5
COL
COL4–12
MIL
COL1–7
MIL
COL7–9
MIL
MIL8–4
COL
COL8–10
MIL
Last 5 Games
| Date | Opponent | Result |
|---|---|---|
| Aug 23 |  vs ATL | L2–4 |
| Aug 22 | vs ATL | W4–1 |
| Aug 21 | vs ATL | W2–1 |
| Aug 20 |  vs SEA | W7–4 |
| Aug 19 | vs SEA | L5–7 |
| Date | Opponent | Result |
|---|---|---|
| Aug 23 |  vs CLE | L2–7 |
| Aug 22 | vs CLE | L3–4 |
| Aug 21 | vs CLE | L1–9 |
| Aug 19 |  vs LAD | L4–6 |
| Aug 18 | vs LAD | L6–7 |
Standings
American League
| Team | W | L | PCT | GB | DIFF | STRK |
|---|---|---|---|---|---|---|
1 Rays | 77 | 53 | .592 | - | +44 | W1 |
2 White Sox | 68 | 62 | .523 | 9 | +43 | W1 |
3 Astros | 65 | 66 | .496 | 12.5 | -44 | L2 |
4 Yankees | 74 | 56 | .569 | 3 | +100 | W1 |
5 Red Sox | 71 | 59 | .546 | 6 | +99 | W3 |
6 Rangers | 65 | 66 | .496 | 12.5 | -46 | W1 |
| 7Guardians | 65 | 66 | .496 | 12.5 | -9 | W4 |
8 Blue Jays | 64 | 68 | .485 | 14 | -55 | L1 |
9 Twins | 63 | 68 | .481 | 14.5 | -54 | L3 |
10 Orioles | 63 | 68 | .481 | 14.5 | -35 | L1 |
| 11Mariners | 62 | 69 | .473 | 15.5 | -61 | L1 |
12 Tigers | 61 | 69 | .469 | 16 | +73 | L5 |
13 Royals | 58 | 74 | .439 | 20 | -91 | W8 |
14 Angels | 52 | 79 | .397 | 25.5 | -70 | L1 |
15 Athletics | 51 | 80 | .389 | 26.5 | -187 | W2 |
National League
| Team | W | L | PCT | GB | DIFF | STRK |
|---|---|---|---|---|---|---|
| 1Brewers | 81 | 50 | .618 | - | +161 | L1 |
| 2Dodgers | 80 | 51 | .611 | 1 | +151 | W6 |
| 3Braves | 76 | 55 | .580 | 5 | +110 | W1 |
4 Cubs | 75 | 56 | .573 | 6 | +115 | W1 |
5 Phillies | 73 | 58 | .557 | 8 | +27 | W9 |
6 Padres | 71 | 60 | .542 | 10 | +16 | W3 |
7 Diamondbacks | 69 | 62 | .527 | 12 | +9 | W1 |
8 Marlins | 67 | 64 | .511 | 14 | +21 | W3 |
9 Cardinals | 66 | 66 | .500 | 15.5 | -2 | L3 |
10 Pirates | 63 | 69 | .477 | 18.5 | +25 | L3 |
11 Reds | 62 | 69 | .473 | 19 | -94 | L1 |
12 Nationals | 61 | 71 | .462 | 20.5 | +10 | L4 |
13 Mets | 59 | 72 | .450 | 22 | -40 | L1 |
14 Giants | 52 | 78 | .400 | 28.5 | -80 | L4 |
| 15Rockies | 50 | 80 | .385 | 30.5 | -136 | L6 |
MIL
VS
COL
Pitchers
Brandon Sproat
Brian Fitzpatrick
Craig Yoho
Trevor Megill
Aaron Ashby
Catchers
William Contreras
Gary Sanchez
Infielders
Brice Turang
Jake Bauers
Luis Rengifo
Joey Ortiz
David Hamilton
Outfielders
Jackson Chourio
Garrett Mitchell
Sal Frelick
Designated Hitters
Christian Yelich
Other Players
Blake Perkins
Andrew Vaughn
Pitchers
Ryan Feltner
Jaden Hill
Antonio Senzatela
Brennan Bernardino
Juan Mejia
Seth Halvorsen
Catchers
Hunter Goodman
Infielders
TJ Rumfield
Chad Stevens
Willi Castro
Ezequiel Tovar
Edouard Julien
Kyle Karros
Brett Sullivan
Outfielders
Jake McCarthy
Tyler Freeman
Troy Johnston
Designated Hitters
Sterlin Thompson
Other Players
Braxton Fulford
Brewers
VS
Rockies
Batting
131
Team Games Played
130
4428
At Bats
4410
1123
Hits
1113
611
Runs Batted In
593
120
Home Runs
144
129
Stolen Bases
88
.254
Batting Average
.252
650
Runs
617
229
Doubles
238
21
Triples
26
1754
Total Bases
1835
543
Walks
409
1095
Strikeouts
1125
.337
On Base Percentage
.322
.396
Slugging Percentage
.416
.733
OBP Pct + SLG Pct
.738
131
Games Played
130
131
Games Started
130
33
Hit By Pitch
63
0.0
Wins Above Replacement
0.0
0.0
Offensive Wins Above Replacement
0.0
41
Caught Stealing
35
1
Is Qualified
1
617.2
Runs Created
601.1
4.8
Runs Created Per 27 Outs
4.7
.107
Walks Per Plate Appearance
.083
0.50
Walk To Strikeout Ratio
0.36
.143
Isolated Power
.164
.285
Secondary Average
.268
4.00
Pitches Per Plate Appearance
3.74
370
Extra Base Hits
408
5076
Plate Appearances
4943
36.9
At Bats Per Home Run
30.6
30
Sacrifice Hit
15
35
Sacrifice Flies
45
Pitching
131
Team Games Played
130
46
Quality Starts
21
81
Wins
50
50
Losses
80
43
Saves
29
68
Holds
50
951
Hits
1315
445
Earned runs
704
130
Home Runs
180
415
Walks
423
1269
Strikeouts
880
9.8
Strikeouts Per 9 Innings
6.9
145.4
Pitches Per Start
149.3
1.17
Walks Plus Hits Per Inning Pitched
1.52
3.42
Earned Run Average
5.54
50
Losses
80
1171.1
Innings pitched
1143.2
.618
Win Percentage
.385
61
Save Opportunities
49
.220
Opponent Batting Average
.289
.295
Opponent's On-base pct.
.351
.357
Opponent's Slugging pct.
.490
.651
Opponent's OPB Pct + SLG Pct
.841
4325
At Bats
4558
175
Doubles
291
13
Triples
44
52
Batters Hit
51
57
Stolen Bases
102
131
Games Played
130
1
Complete Games
1
9
Shutouts
1
44
Wild Pitches
35
469
Runs Batted In
723
6
Balks
5
1171.1
Innings pitched
1143.2
9.8
Strikeouts Per 9 Innings
6.9
29
Caught Stealing
20
131
Games Started
130
0.0
Wins Above Replacement
0.0
1
Is Qualified
1
489
Runs
753
445
Earned Runs
704
1542
Total Bases
2234
Fielding
131
Team Games Played
130
1171
Full Innings
1144
4592
Total Chances
4623
3514
Putouts
3431
1020
Assists
1108
58
Errors
84
229
Double Plays
238
0.987
Fielding Percentage
0.982
34.8
Range Factor
35.7
0.0
Zone Rating
0.0
131
Games Played
130
0
Games Started
0
0.0
Defensive Wins Above Replacement
0.0
1
Qualified
1