

Brewers vs Tigers Live Score (21 Apr, 2026)
Game Information
Stage
Standard
Season
2026
First Pitch
Tue, Apr 21, 6:40 pm
Venue
Comerica Park
Location
Detroit, Michigan
Attendance
20,847
Live Situation
1Balls
0Strikes
0Outs
—Pitcher
—At Bat
Pitch Sequence
1
BALL
Cutter
89 MPH
2
BALL IN PLAY
Cutter
90 MPH
Injury Report



Team Stats
 MIL
DET


12
Runs
4
16
Hits
9
1
Errors
1
0
Home Runs
0
3
Walks
5
5
Strikeouts
9
Player Box Score
Milwaukee Brewers
| Player | H-AB | AB | R | H | RBI | HR | BB | K | #P | AVG | OBP | SLG |
|---|---|---|---|---|---|---|---|---|---|---|---|---|
 Brice Turang | 2-5 | 5 | 0 | 2 | 4 | 0 | 0 | 0 | 20 | .307 | .430 | .560 |
 William Contreras | 2-5 | 5 | 1 | 2 | 2 | 0 | 0 | 0 | 10 | .295 | .382 | .436 |
 Jake Bauers | 2-5 | 5 | 0 | 2 | 1 | 0 | 0 | 0 | 23 | .236 | .304 | .472 |
 Gary Sanchez | 1-5 | 5 | 1 | 1 | 1 | 0 | 0 | 1 | 19 | .234 | .410 | .617 |
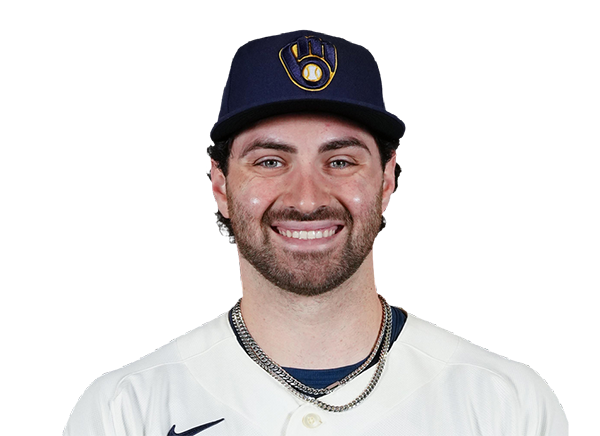 Garrett Mitchell | 2-5 | 5 | 2 | 2 | 1 | 0 | 0 | 1 | 22 | .273 | .437 | .436 |
 Luis Rengifo | 1-3 | 3 | 1 | 1 | 1 | 0 | 1 | 0 | 20 | .175 | .243 | .270 |
 Joey Ortiz | 0-1 | 1 | 1 | 0 | 0 | 0 | 0 | 1 | 5 | .192 | .263 | .192 |
 Sal Frelick | 1-3 | 3 | 2 | 1 | 1 | 0 | 1 | 0 | 19 | .197 | .305 | .268 |
 Luis Matos | 0-1 | 1 | 0 | 0 | 0 | 0 | 0 | 0 | 1 | .176 | .222 | .176 |
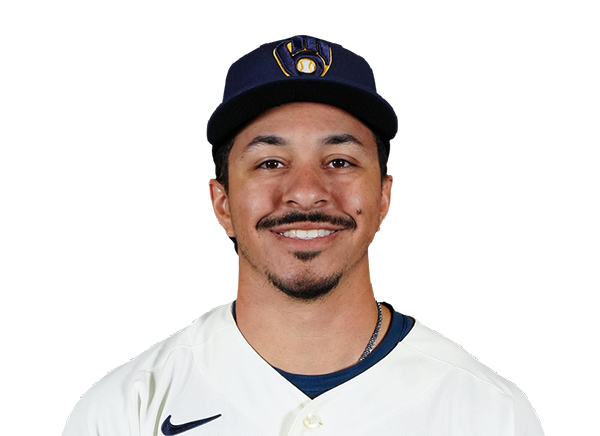 David Hamilton | 4-5 | 5 | 2 | 4 | 0 | 0 | 0 | 0 | 15 | .240 | .377 | .240 |
 Blake Perkins | 0-2 | 2 | 2 | 0 | 1 | 0 | 1 | 2 | 17 | .118 | .250 | .176 |
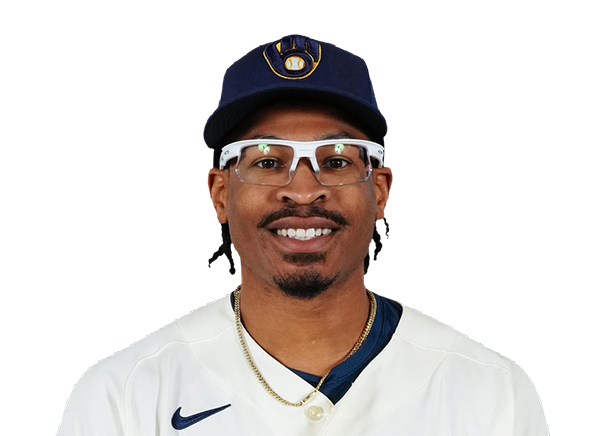 Greg Jones | 1-1 | 1 | 0 | 1 | 0 | 0 | 0 | 0 | 2 | .200 | .200 | .200 |
Detroit Tigers
| Player | H-AB | AB | R | H | RBI | HR | BB | K | #P | AVG | OBP | SLG |
|---|---|---|---|---|---|---|---|---|---|---|---|---|
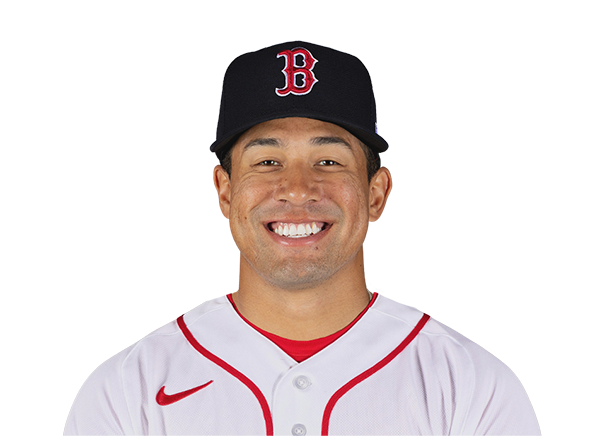 Jahmai Jones | 0-2 | 2 | 0 | 0 | 0 | 0 | 0 | 0 | 5 | .217 | .217 | .391 |
 Kerry Carpenter | 0-3 | 3 | 0 | 0 | 0 | 0 | 0 | 2 | 15 | .217 | .329 | .433 |
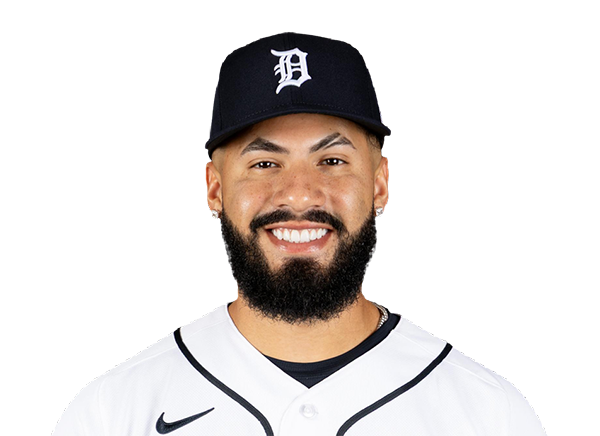 Gleyber Torres | 1-2 | 2 | 0 | 1 | 0 | 0 | 1 | 0 | 20 | .244 | .371 | .302 |
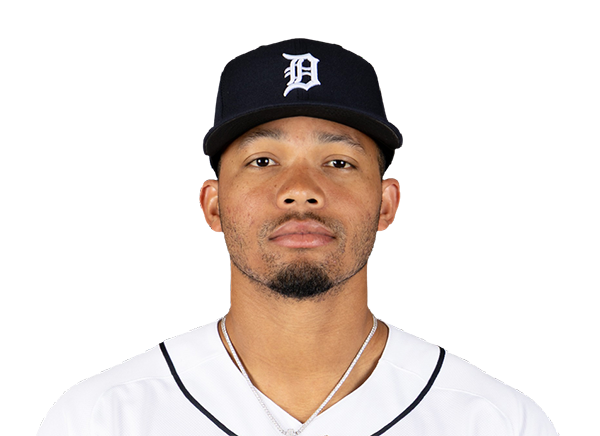 Wenceel Perez | 1-1 | 1 | 1 | 1 | 0 | 0 | 0 | 0 | 5 | .071 | .133 | .179 |
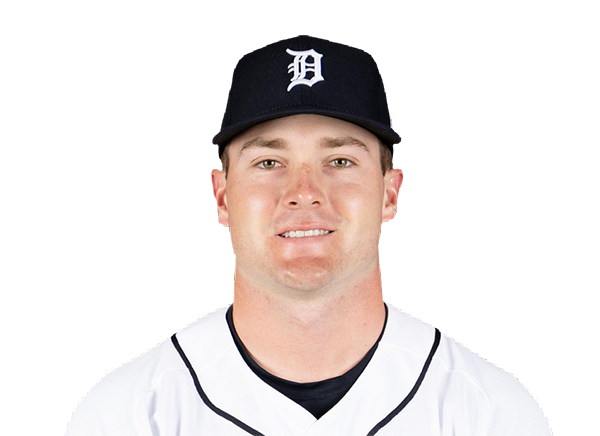 Kevin McGonigle | 2-5 | 5 | 1 | 2 | 1 | 0 | 0 | 0 | 20 | .322 | .410 | .494 |
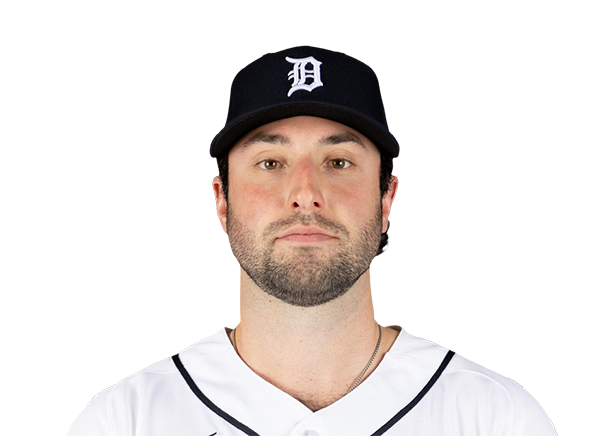 Matt Vierling | 1-4 | 4 | 0 | 1 | 2 | 0 | 1 | 0 | 18 | .238 | .267 | .405 |
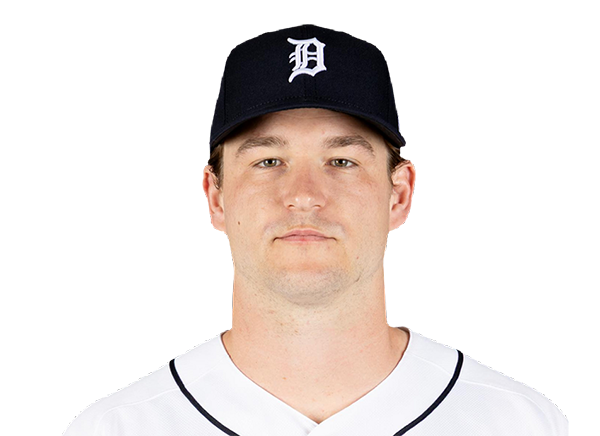 Dillon Dingler | 0-5 | 5 | 0 | 0 | 0 | 0 | 0 | 2 | 24 | .264 | .346 | .528 |
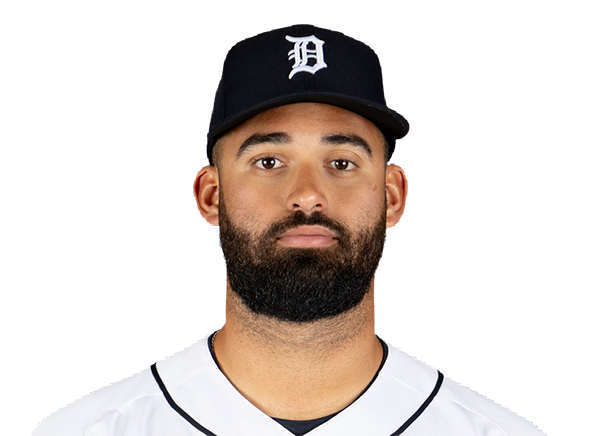 Riley Greene | 1-3 | 3 | 1 | 1 | 0 | 0 | 1 | 0 | 15 | .265 | .378 | .386 |
 Spencer Torkelson | 1-3 | 3 | 0 | 1 | 0 | 0 | 1 | 2 | 21 | .186 | .337 | .229 |
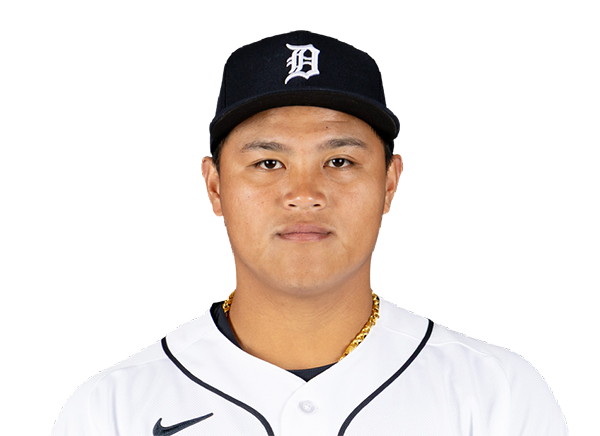 Hao-Yu Lee | 1-3 | 3 | 0 | 1 | 0 | 0 | 1 | 2 | 18 | .214 | .267 | .286 |
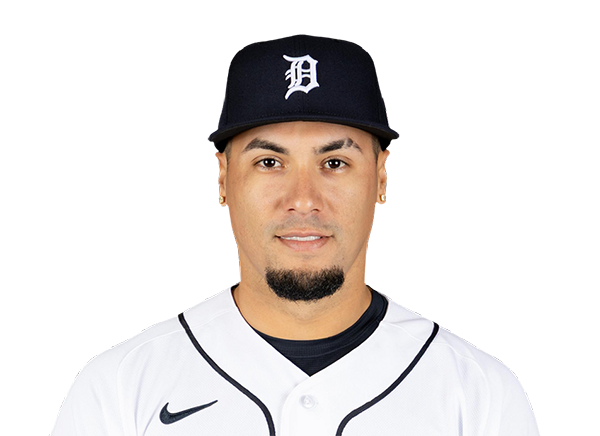 Javier Baez | 0-3 | 3 | 0 | 0 | 0 | 0 | 0 | 1 | 7 | .279 | .308 | .410 |
 Colt Keith | 1-1 | 1 | 1 | 1 | 0 | 0 | 0 | 0 | 4 | .309 | .338 | .412 |
Milwaukee Brewers
| Player | IP | H | R | ER | BB | K | HR | PC-ST | ERA | PC |
|---|---|---|---|---|---|---|---|---|---|---|
 Kyle Harrison | 3.0 | 4 | 1 | 1 | 3 | 3 | 0 | 72-39 | 3.06 | 72 |
 Grant Anderson | 2.0 | 1 | 0 | 0 | 0 | 1 | 0 | 17-10 | 2.70 | 17 |
 Trevor Megill | 1.0 | 0 | 0 | 0 | 0 | 1 | 0 | 14-10 | 9.00 | 14 |
 Aaron Ashby | 1.0 | 0 | 0 | 0 | 2 | 2 | 0 | 27-15 | 3.00 | 27 |
 Jake Woodford | 2.0 | 4 | 3 | 3 | 0 | 2 | 0 | 42-26 | 5.91 | 42 |
Detroit Tigers
| Player | IP | H | R | ER | BB | K | HR | PC-ST | ERA | PC |
|---|---|---|---|---|---|---|---|---|---|---|
 Keider Montero | 5.2 | 5 | 3 | 3 | 1 | 3 | 0 | 88-55 | 3.68 | 88 |
 Enmanuel De Jesus | 1.1 | 7 | 7 | 5 | 2 | 1 | 0 | 49-29 | 10.13 | 49 |
 Connor Seabold | 1.0 | 2 | 2 | 2 | 0 | 0 | 0 | 22-14 | 4.22 | 22 |
 Jake Rogers | 1.0 | 2 | 0 | 0 | 0 | 1 | 0 | 14-9 | 0.00 | 14 |
H2H / Season Series
DET5–4
MIL
DET5–2
MIL
DET4–12
MIL
Last 5 Games
| Date | Opponent | Result |
|---|---|---|
| Aug 22 |  vs ATL | W4–1 |
| Aug 21 | vs ATL | W2–1 |
| Aug 20 |  vs SEA | W7–4 |
| Aug 19 | vs SEA | L5–7 |
| Aug 18 | vs SEA | W22–0 |
| Date | Opponent | Result |
|---|---|---|
| Aug 21 |  @ KC | L2–5 |
| Aug 19 |  @ PIT | L3–4 |
| Aug 18 | @ PIT | L1–4 |
| Aug 17 | @ PIT | W8–5 |
| Aug 16 |  vs CHW | L5–7 |
Standings
American League
| Team | W | L | PCT | GB | DIFF | STRK |
|---|---|---|---|---|---|---|
1 Rays | 76 | 52 | .594 | - | +43 | L2 |
| 2White Sox | 67 | 61 | .523 | 9 | +47 | W1 |
3 Astros | 65 | 64 | .504 | 11.5 | -42 | W1 |
4 Yankees | 73 | 56 | .566 | 3.5 | +95 | L1 |
5 Red Sox | 69 | 59 | .539 | 7 | +97 | W1 |
6 Rangers | 64 | 65 | .496 | 12.5 | -45 | W2 |
7 Blue Jays | 64 | 67 | .489 | 13.5 | -50 | W1 |
8 Twins | 63 | 66 | .488 | 13.5 | -45 | L1 |
9 Guardians | 63 | 66 | .488 | 13.5 | -15 | W2 |
10 Orioles | 62 | 67 | .481 | 14.5 | -34 | W1 |
| 11Tigers | 61 | 67 | .477 | 15 | +79 | L3 |
| 12Mariners | 61 | 68 | .473 | 15.5 | -45 | W1 |
| 13Royals | 56 | 74 | .431 | 21 | -97 | W6 |
14 Angels | 51 | 78 | .395 | 25.5 | -71 | L1 |
15 Athletics | 49 | 80 | .380 | 27.5 | -189 | L5 |
National League
| Team | W | L | PCT | GB | DIFF | STRK |
|---|---|---|---|---|---|---|
| 1Brewers | 81 | 49 | .623 | - | +163 | W3 |
2 Dodgers | 78 | 51 | .605 | 2.5 | +146 | W4 |
| 3Braves | 75 | 55 | .577 | 6 | +108 | L2 |
4 Cubs | 74 | 55 | .574 | 6.5 | +99 | L2 |
5 Phillies | 71 | 58 | .550 | 9.5 | +16 | W7 |
6 Padres | 69 | 60 | .535 | 11.5 | +7 | W1 |
7 Diamondbacks | 68 | 61 | .527 | 12.5 | +13 | W2 |
8 Cardinals | 66 | 64 | .508 | 15 | +9 | L1 |
9 Marlins | 65 | 64 | .504 | 15.5 | +15 | W1 |
| 10Pirates | 63 | 67 | .485 | 18 | +30 | L1 |
11 Reds | 61 | 68 | .473 | 19.5 | -98 | L2 |
12 Nationals | 61 | 69 | .469 | 20 | +16 | L2 |
13 Mets | 58 | 71 | .450 | 22.5 | -44 | L1 |
14 Giants | 52 | 76 | .406 | 28 | -78 | L2 |
15 Rockies | 50 | 78 | .391 | 30 | -130 | L4 |
MIL
VS
DET
Pitchers
Kyle Harrison
Grant Anderson
Trevor Megill
Aaron Ashby
Jake Woodford
Catchers
William Contreras
Infielders
Brice Turang
Jake Bauers
Luis Rengifo
Joey Ortiz
David Hamilton
Outfielders
Garrett Mitchell
Sal Frelick
Luis Matos
Blake Perkins
Greg Jones
Designated Hitters
Gary Sanchez
Pitchers
Keider Montero
Enmanuel De Jesus
Connor Seabold
Jake Rogers
Catchers
Dillon Dingler
Infielders
Gleyber Torres
Kevin McGonigle
Spencer Torkelson
Hao-Yu Lee
Colt Keith
Outfielders
Wenceel Perez
Matt Vierling
Riley Greene
Javier Baez
Designated Hitters
Jahmai Jones
Kerry Carpenter
Brewers
VS
Tigers
Batting
129
Team Games Played
128
4361
At Bats
4322
1104
Hits
1047
605
Runs Batted In
552
119
Home Runs
152
129
Stolen Bases
36
.253
Batting Average
.242
644
Runs
579
226
Doubles
196
20
Triples
26
1727
Total Bases
1751
537
Walks
458
1084
Strikeouts
1094
.337
On Base Percentage
.319
.396
Slugging Percentage
.405
.733
OBP Pct + SLG Pct
.724
129
Games Played
128
129
Games Started
128
32
Hit By Pitch
48
0.0
Wins Above Replacement
0.0
0.0
Offensive Wins Above Replacement
0.0
41
Caught Stealing
18
1
Is Qualified
1
608.3
Runs Created
568.9
4.8
Runs Created Per 27 Outs
4.5
.107
Walks Per Plate Appearance
.094
0.50
Walk To Strikeout Ratio
0.42
.143
Isolated Power
.163
.286
Secondary Average
.273
4.00
Pitches Per Plate Appearance
3.92
365
Extra Base Hits
374
5000
Plate Appearances
4876
36.6
At Bats Per Home Run
28.4
29
Sacrifice Hit
6
34
Sacrifice Flies
37
Pitching
129
Team Games Played
128
45
Quality Starts
48
80
Wins
61
49
Losses
67
42
Saves
26
66
Holds
60
933
Hits
982
441
Earned runs
448
129
Home Runs
130
408
Walks
395
1253
Strikeouts
1047
9.8
Strikeouts Per 9 Innings
8.3
145.2
Pitches Per Start
141.7
1.16
Walks Plus Hits Per Inning Pitched
1.21
3.44
Earned Run Average
3.56
49
Losses
67
1153.1
Innings pitched
1133.1
.620
Win Percentage
.477
60
Save Opportunities
54
.219
Opponent Batting Average
.231
.294
Opponent's On-base pct.
.303
.357
Opponent's Slugging pct.
.377
.651
Opponent's OPB Pct + SLG Pct
.680
4257
At Bats
4248
172
Doubles
192
13
Triples
18
52
Batters Hit
55
55
Stolen Bases
70
129
Games Played
128
1
Complete Games
0
9
Shutouts
14
44
Wild Pitches
28
465
Runs Batted In
477
6
Balks
3
1153.1
Innings pitched
1133.1
9.8
Strikeouts Per 9 Innings
8.3
29
Caught Stealing
25
129
Games Started
128
0.0
Wins Above Replacement
0.0
1
Is Qualified
1
484
Runs
500
441
Earned Runs
448
1518
Total Bases
1600
Fielding
129
Team Games Played
128
1153
Full Innings
1133
4522
Total Chances
4590
3460
Putouts
3400
1005
Assists
1131
57
Errors
59
226
Double Plays
196
0.987
Fielding Percentage
0.987
34.8
Range Factor
36.0
0.0
Zone Rating
0.0
129
Games Played
128
0
Games Started
0
0.0
Defensive Wins Above Replacement
0.0
1
Qualified
1