

Cardinals vs Brewers Live Score (27 May, 2026)
Game Information
Stage
Standard
Season
2026
First Pitch
Wed, May 27, 1:40 pm
Venue
American Family Field
Location
Milwaukee, Wisconsin
Attendance
30,391
Live Situation
0Balls
3Strikes
0Outs
—Pitcher
—At Bat
Pitch Sequence
1
STRIKE SWINGING
Four-seam FB
99 MPH
2
STRIKE FOUL
Four-seam FB
98 MPH
3
STRIKE SWINGING
Four-seam FB
100 MPH
Injury Report


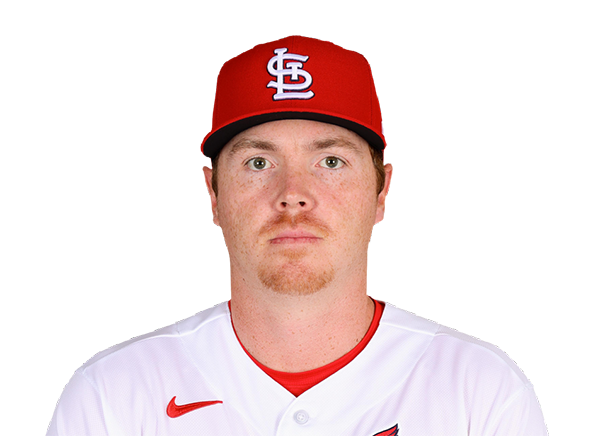


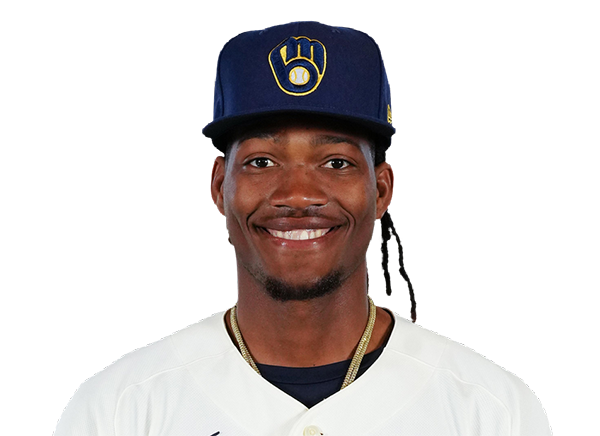
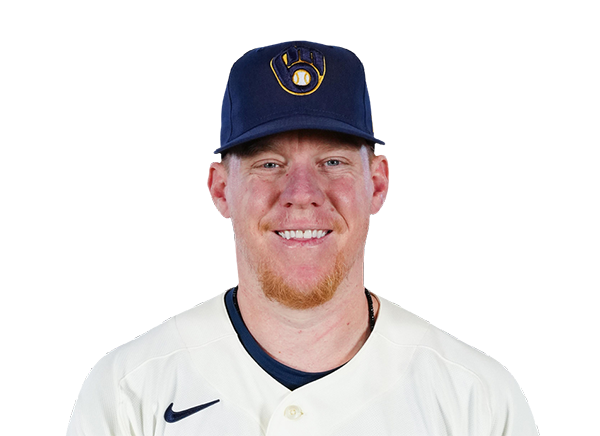
Team Stats
 STL
MIL


1
Runs
2
8
Hits
3
2
Errors
0
0
Home Runs
0
2
Walks
0
8
Strikeouts
10
Player Box Score
St. Louis Cardinals
| Player | H-AB | AB | R | H | RBI | HR | BB | K | #P | AVG | OBP | SLG |
|---|---|---|---|---|---|---|---|---|---|---|---|---|
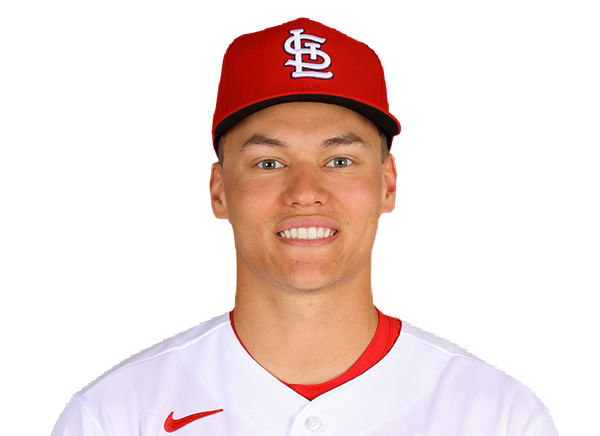 JJ Wetherholt | 1-4 | 4 | 0 | 1 | 0 | 0 | 0 | 0 | 12 | .234 | .351 | .395 |
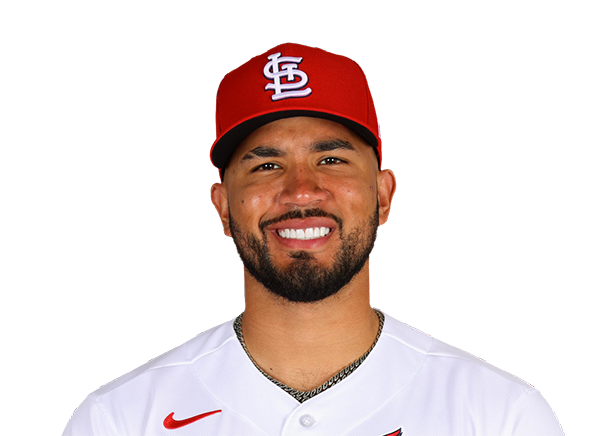 Ivan Herrera | 1-3 | 3 | 0 | 1 | 0 | 0 | 1 | 0 | 18 | .264 | .390 | .423 |
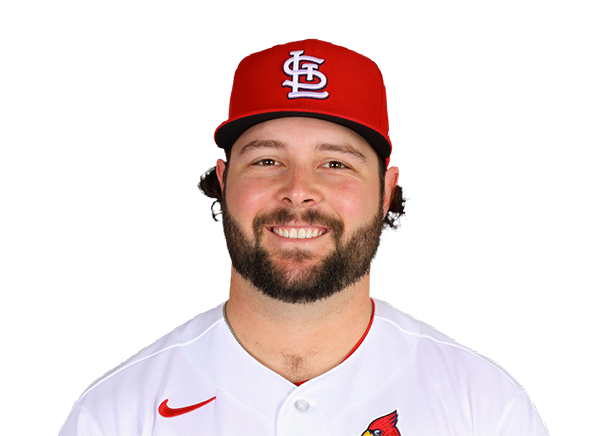 Alec Burleson | 0-4 | 4 | 0 | 0 | 0 | 0 | 0 | 1 | 15 | .282 | .351 | .447 |
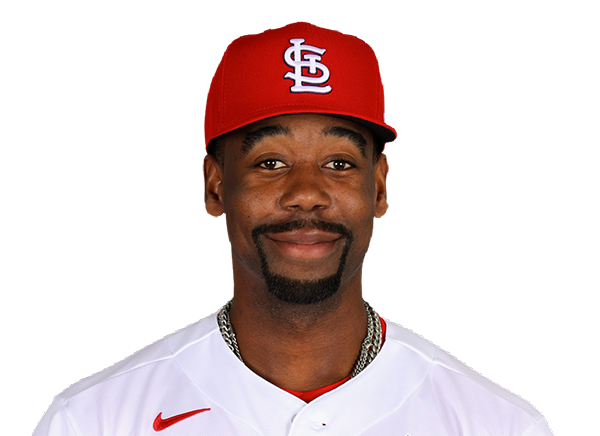 Jordan Walker | 2-4 | 4 | 1 | 2 | 0 | 0 | 0 | 0 | 8 | .300 | .367 | .576 |
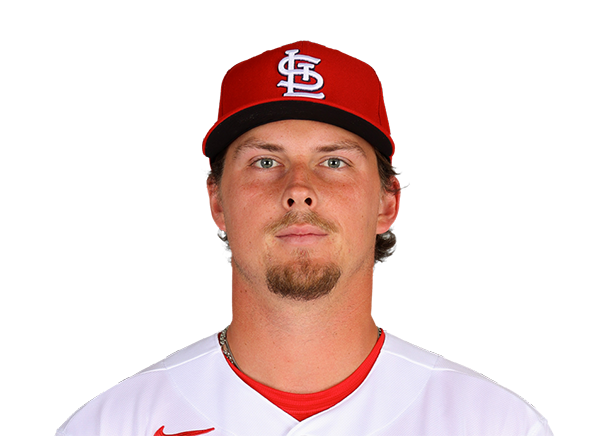 Nolan Gorman | 1-4 | 4 | 0 | 1 | 0 | 0 | 0 | 2 | 13 | .217 | .300 | .343 |
 Masyn Winn | 1-4 | 4 | 0 | 1 | 0 | 0 | 0 | 1 | 13 | .230 | .309 | .315 |
 Bryan Torres | 1-4 | 4 | 0 | 1 | 1 | 0 | 0 | 1 | 19 | .316 | .381 | .579 |
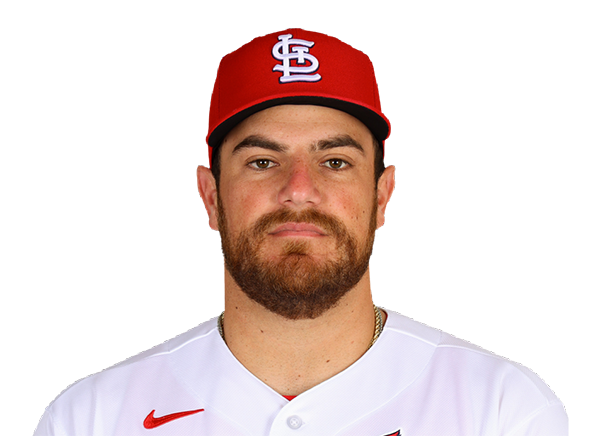 Pedro Pages | 1-3 | 3 | 0 | 1 | 0 | 0 | 0 | 1 | 12 | .219 | .262 | .360 |
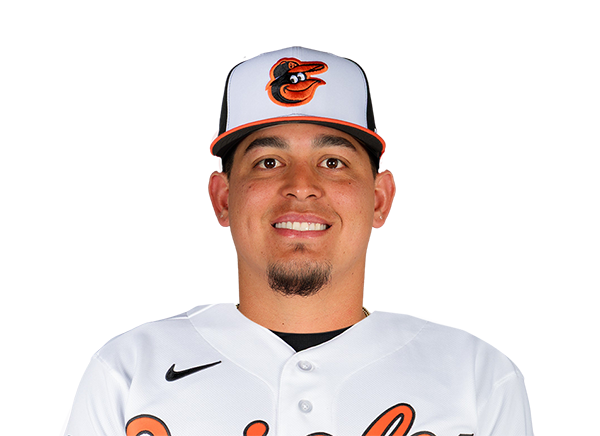 Yohel Pozo | 0-1 | 1 | 0 | 0 | 0 | 0 | 0 | 1 | 3 | .242 | .242 | .273 |
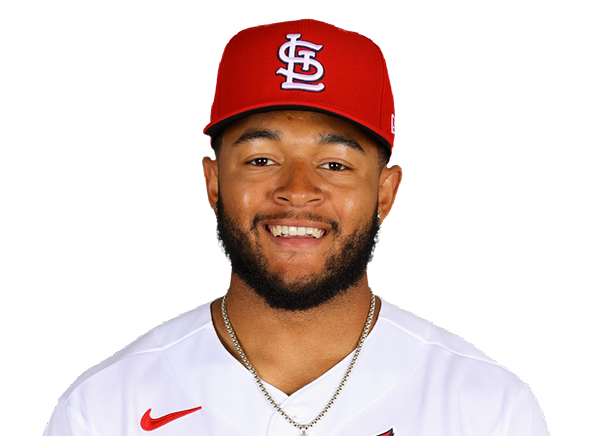 Victor Scott II | 0-2 | 2 | 0 | 0 | 0 | 0 | 1 | 1 | 18 | .194 | .259 | .261 |
Milwaukee Brewers
| Player | H-AB | AB | R | H | RBI | HR | BB | K | #P | AVG | OBP | SLG |
|---|---|---|---|---|---|---|---|---|---|---|---|---|
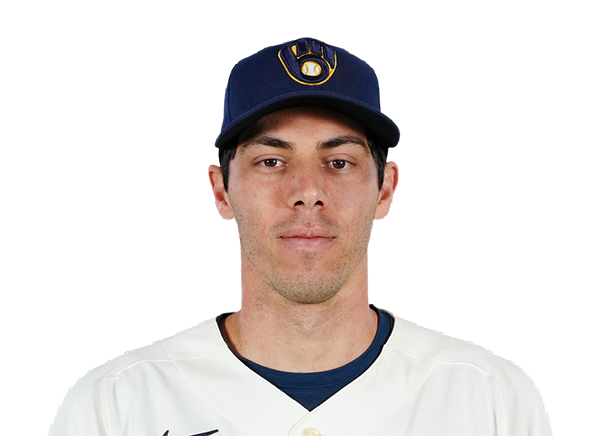 Christian Yelich | 1-4 | 4 | 0 | 1 | 1 | 0 | 0 | 1 | 16 | .280 | .337 | .484 |
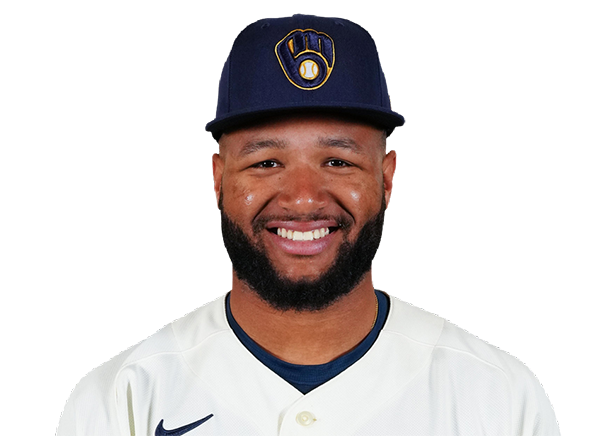 Jackson Chourio | 0-4 | 4 | 0 | 0 | 0 | 0 | 0 | 2 | 11 | .267 | .315 | .384 |
 Brice Turang | 0-4 | 4 | 0 | 0 | 0 | 0 | 0 | 2 | 15 | .276 | .400 | .459 |
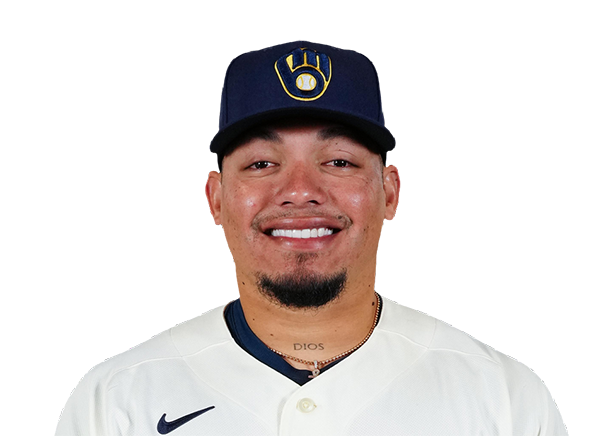 William Contreras | 0-3 | 3 | 0 | 0 | 0 | 0 | 0 | 0 | 5 | .303 | .371 | .409 |
 Jake Bauers | 0-2 | 2 | 0 | 0 | 0 | 0 | 0 | 2 | 10 | .287 | .357 | .494 |
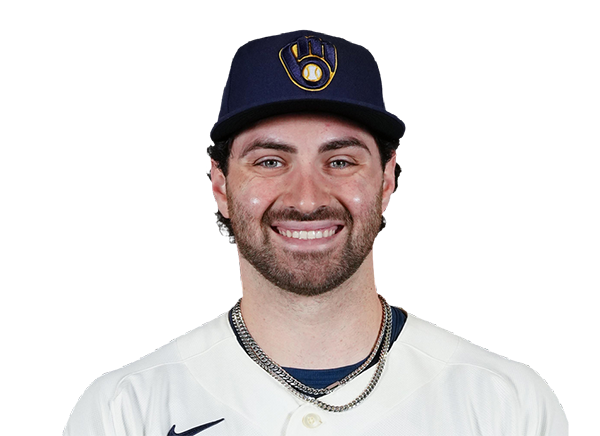 Garrett Mitchell | 1-3 | 3 | 1 | 1 | 0 | 0 | 0 | 2 | 15 | .236 | .349 | .379 |
 Luis Rengifo | 1-3 | 3 | 0 | 1 | 0 | 0 | 0 | 0 | 7 | .207 | .273 | .260 |
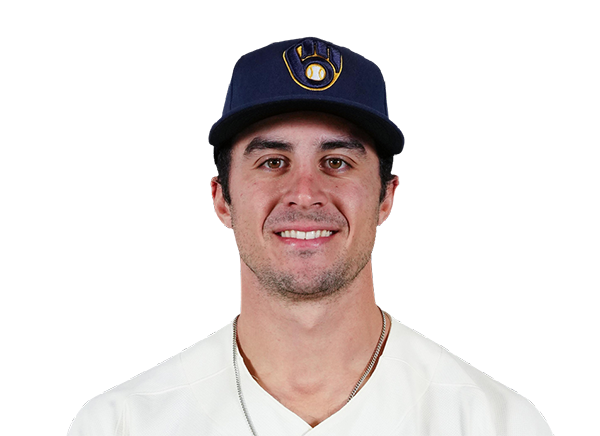 Sal Frelick | 0-2 | 2 | 1 | 0 | 0 | 0 | 0 | 0 | 11 | .217 | .289 | .301 |
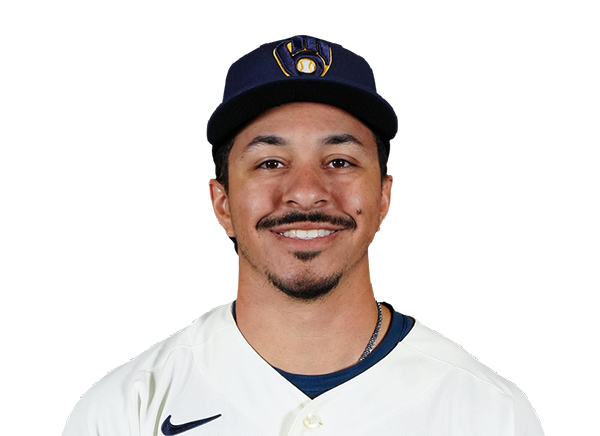 David Hamilton | 0-2 | 2 | 0 | 0 | 0 | 0 | 0 | 0 | 7 | .223 | .314 | .256 |
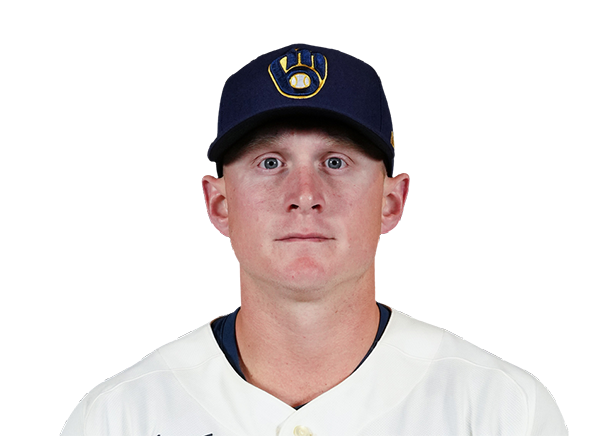 Andrew Vaughn | 0-1 | 1 | 0 | 0 | 0 | 0 | 0 | 1 | 5 | .327 | .417 | .500 |
 Joey Ortiz | 0-0 | 0 | 0 | 0 | 0 | 0 | 0 | 0 | 0 | .195 | .290 | .239 |
St. Louis Cardinals
| Player | IP | H | R | ER | BB | K | HR | PC-ST | ERA | PC |
|---|---|---|---|---|---|---|---|---|---|---|
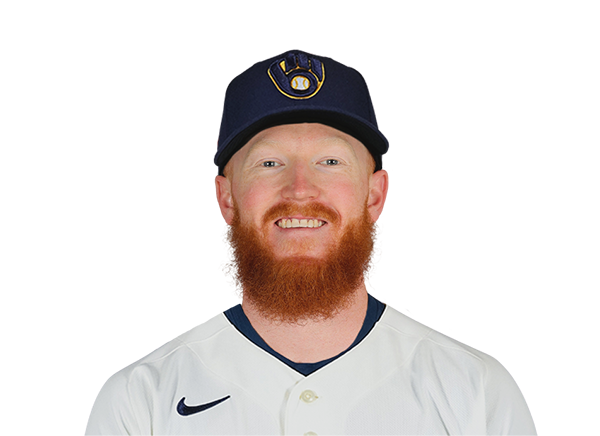 Dustin May | 7.0 | 2 | 2 | 1 | 0 | 9 | 0 | 87-62 | 4.57 | 87 |
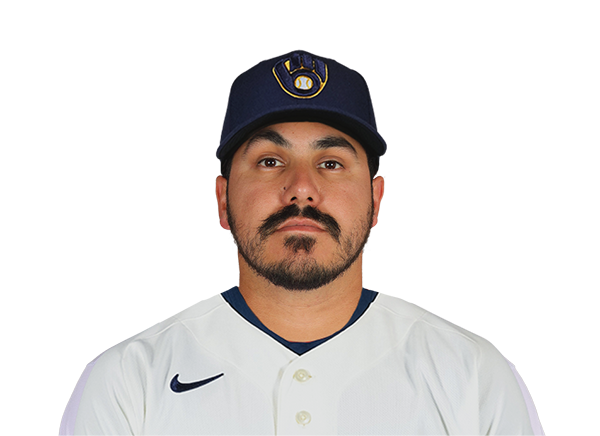 JoJo Romero | 1.0 | 1 | 0 | 0 | 0 | 1 | 0 | 15-9 | 2.81 | 15 |
Milwaukee Brewers
| Player | IP | H | R | ER | BB | K | HR | PC-ST | ERA | PC |
|---|---|---|---|---|---|---|---|---|---|---|
 Chad Patrick | 4.0 | 5 | 1 | 1 | 1 | 4 | 0 | 61-44 | 2.60 | 61 |
 Shane Drohan | 2.0 | 1 | 0 | 0 | 0 | 1 | 0 | 27-17 | 2.63 | 27 |
 Aaron Ashby | 2.0 | 1 | 0 | 0 | 1 | 2 | 0 | 30-18 | 2.06 | 30 |
 Trevor Megill | 1.0 | 1 | 0 | 0 | 0 | 1 | 0 | 13-9 | 4.74 | 13 |
H2H / Season Series
STL4–8
MIL
STL5–1
MIL
STL2–10
MIL
STL3–4
MIL
STL3–4
MIL
MIL2–1
STL
MIL6–0
STL
MIL5–1
STL
STL2–6
MIL
STL6–3
MIL
Last 5 Games
| Date | Opponent | Result |
|---|---|---|
| Aug 22 |  @ PHI | L3–12 |
| Aug 21 | @ PHI | L6–7 |
| Aug 20 |  @ CIN | W10–9 |
| Aug 19 | @ CIN | L4–5 |
| Aug 18 | @ CIN | W3–0 |
| Date | Opponent | Result |
|---|---|---|
| Aug 22 |  vs ATL | W4–1 |
| Aug 21 | vs ATL | W2–1 |
| Aug 20 |  vs SEA | W7–4 |
| Aug 19 | vs SEA | L5–7 |
| Aug 18 | vs SEA | W22–0 |
Standings
American League
| Team | W | L | PCT | GB | DIFF | STRK |
|---|---|---|---|---|---|---|
1 Rays | 76 | 53 | .589 | - | +42 | L3 |
2 White Sox | 67 | 62 | .519 | 9 | +42 | L1 |
3 Astros | 65 | 65 | .500 | 11.5 | -43 | L1 |
4 Yankees | 73 | 56 | .566 | 3 | +95 | L1 |
5 Red Sox | 70 | 59 | .543 | 6 | +98 | W2 |
6 Rangers | 64 | 66 | .492 | 12.5 | -48 | L1 |
7 Blue Jays | 64 | 67 | .489 | 13 | -50 | W1 |
8 Twins | 63 | 66 | .488 | 13 | -45 | L1 |
9 Guardians | 63 | 66 | .488 | 13 | -15 | W2 |
10 Orioles | 63 | 67 | .485 | 13.5 | -33 | W2 |
| 11Mariners | 62 | 68 | .477 | 14.5 | -44 | W2 |
12 Tigers | 61 | 68 | .473 | 15 | +77 | L4 |
13 Royals | 57 | 74 | .435 | 20 | -95 | W7 |
14 Angels | 52 | 78 | .400 | 24.5 | -68 | W1 |
15 Athletics | 50 | 80 | .385 | 26.5 | -188 | W1 |
National League
| Team | W | L | PCT | GB | DIFF | STRK |
|---|---|---|---|---|---|---|
| 1Brewers | 81 | 49 | .623 | - | +163 | W3 |
2 Dodgers | 79 | 51 | .608 | 2 | +147 | W5 |
| 3Braves | 75 | 55 | .577 | 6 | +108 | L2 |
4 Cubs | 74 | 56 | .569 | 7 | +98 | L3 |
| 5Phillies | 72 | 58 | .554 | 9 | +25 | W8 |
6 Padres | 69 | 60 | .535 | 11.5 | +7 | W1 |
7 Diamondbacks | 68 | 61 | .527 | 12.5 | +13 | W2 |
8 Marlins | 66 | 64 | .508 | 15 | +17 | W2 |
| 9Cardinals | 66 | 65 | .504 | 15.5 | 0 | L2 |
10 Pirates | 63 | 68 | .481 | 18.5 | +29 | L2 |
| 11Reds | 61 | 68 | .473 | 19.5 | -98 | L2 |
12 Nationals | 61 | 70 | .466 | 20.5 | +14 | L3 |
13 Mets | 59 | 71 | .454 | 22 | -39 | W1 |
14 Giants | 52 | 77 | .403 | 28.5 | -79 | L3 |
15 Rockies | 50 | 78 | .391 | 30 | -130 | L4 |
STL
VS
MIL
Pitchers
Dustin May
JoJo Romero
Catchers
Pedro Pages
Infielders
JJ Wetherholt
Alec Burleson
Nolan Gorman
Masyn Winn
Outfielders
Jordan Walker
Bryan Torres
Victor Scott II
Designated Hitters
Ivan Herrera
Other Players
Yohel Pozo
Pitchers
Chad Patrick
Shane Drohan
Aaron Ashby
Trevor Megill
Catchers
William Contreras
Infielders
Brice Turang
Jake Bauers
Luis Rengifo
David Hamilton
Joey Ortiz
Outfielders
Jackson Chourio
Garrett Mitchell
Sal Frelick
Designated Hitters
Christian Yelich
Other Players
Andrew Vaughn
Cardinals
VS
Brewers
Batting
130
Team Games Played
129
4364
At Bats
4361
1052
Hits
1104
563
Runs Batted In
605
135
Home Runs
119
80
Stolen Bases
129
.241
Batting Average
.253
578
Runs
644
186
Doubles
226
13
Triples
20
1669
Total Bases
1727
426
Walks
537
1012
Strikeouts
1084
.318
On Base Percentage
.337
.382
Slugging Percentage
.396
.700
OBP Pct + SLG Pct
.733
130
Games Played
129
130
Games Started
129
83
Hit By Pitch
32
0.0
Wins Above Replacement
0.0
0.0
Offensive Wins Above Replacement
0.0
22
Caught Stealing
41
1
Is Qualified
1
541.6
Runs Created
608.3
4.2
Runs Created Per 27 Outs
4.8
.086
Walks Per Plate Appearance
.107
0.42
Walk To Strikeout Ratio
0.50
.141
Isolated Power
.143
.252
Secondary Average
.286
3.86
Pitches Per Plate Appearance
4.00
334
Extra Base Hits
365
4936
Plate Appearances
5000
32.3
At Bats Per Home Run
36.6
19
Sacrifice Hit
29
42
Sacrifice Flies
34
Pitching
130
Team Games Played
129
47
Quality Starts
45
66
Wins
80
64
Losses
49
38
Saves
42
84
Holds
66
1100
Hits
933
523
Earned runs
441
126
Home Runs
129
442
Walks
408
1006
Strikeouts
1253
7.8
Strikeouts Per 9 Innings
9.8
148.8
Pitches Per Start
145.2
1.33
Walks Plus Hits Per Inning Pitched
1.16
4.06
Earned Run Average
3.44
64
Losses
49
1159.1
Innings pitched
1153.1
.508
Win Percentage
.620
62
Save Opportunities
60
.251
Opponent Batting Average
.219
.325
Opponent's On-base pct.
.294
.392
Opponent's Slugging pct.
.357
.717
Opponent's OPB Pct + SLG Pct
.651
4389
At Bats
4257
222
Doubles
172
11
Triples
13
58
Batters Hit
52
89
Stolen Bases
55
130
Games Played
129
1
Complete Games
1
9
Shutouts
9
52
Wild Pitches
44
541
Runs Batted In
465
3
Balks
6
1159.1
Innings pitched
1153.1
7.8
Strikeouts Per 9 Innings
9.8
21
Caught Stealing
29
130
Games Started
129
0.0
Wins Above Replacement
0.0
1
Is Qualified
1
569
Runs
484
523
Earned Runs
441
1722
Total Bases
1518
Fielding
130
Team Games Played
129
1159
Full Innings
1153
4752
Total Chances
4522
3478
Putouts
3460
1219
Assists
1005
55
Errors
57
186
Double Plays
226
0.988
Fielding Percentage
0.987
36.5
Range Factor
34.8
0.0
Zone Rating
0.0
130
Games Played
129
0
Games Started
0
0.0
Defensive Wins Above Replacement
0.0
1
Qualified
1