

Cardinals vs Brewers Live Score (25 Sep, 2026)
Game Information
Stage
STD
Season
2026
First Pitch
Fri, Sep 25, 7:40 pm
Venue
American Family Field
Location
Milwaukee, Wisconsin
Venue Type
Indoor
Broadcast
MLB.TV
Attendance
42,793
Live Situation
0Balls
3Strikes
0Outs
—Pitcher
—At Bat
Pitch Sequence
1
STRIKE LOOKING
Four-seam FB
96 MPH
2
STRIKE LOOKING
Knuckle Curve
87 MPH
3
STRIKE SWINGING
Knuckle Curve
88 MPH
Injury Report

Team Stats
 STL
MIL


4
Runs
8
6
Hits
12
2
Errors
0
3
Home Runs
0
1
Walks
5
12
Strikeouts
5
Player Box Score
St. Louis Cardinals
| Player | H-AB | AB | R | H | RBI | HR | BB | K | #P | AVG | OBP | SLG |
|---|---|---|---|---|---|---|---|---|---|---|---|---|
 JJ Wetherholt | 0-4 | 4 | 0 | 0 | 0 | 0 | 0 | 0 | 11 | .244 | .341 | .368 |
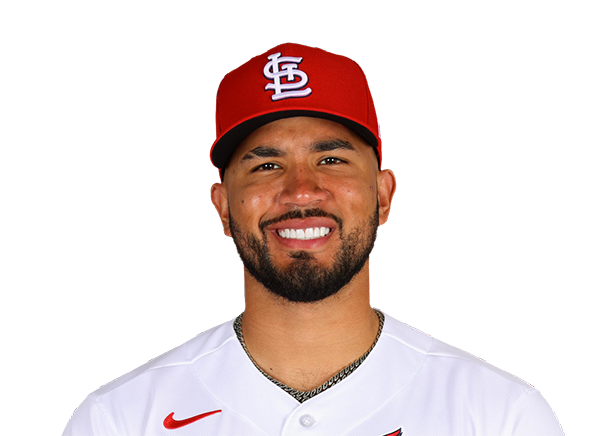 Ivan Herrera | 1-4 | 4 | 1 | 1 | 1 | 1 | 0 | 3 | 23 | .244 | .355 | .386 |
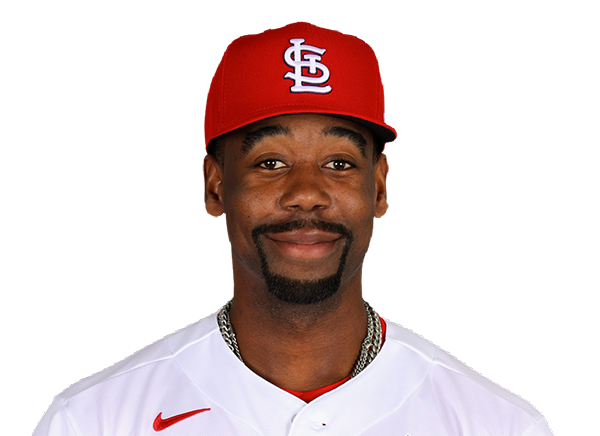 Jordan Walker | 1-4 | 4 | 1 | 1 | 1 | 1 | 0 | 2 | 16 | .271 | .329 | .471 |
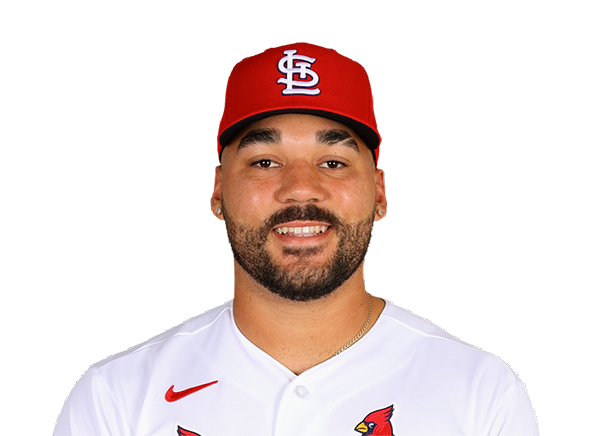 Leo Bernal | 2-4 | 4 | 1 | 2 | 0 | 0 | 0 | 0 | 8 | .292 | .330 | .461 |
 Jose Fermin | 0-2 | 2 | 0 | 0 | 0 | 0 | 0 | 1 | 11 | .252 | .313 | .360 |
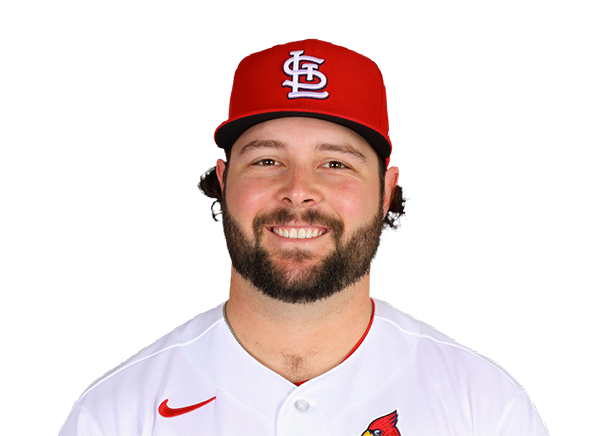 Alec Burleson | 1-2 | 2 | 1 | 1 | 2 | 1 | 0 | 0 | 8 | .280 | .344 | .469 |
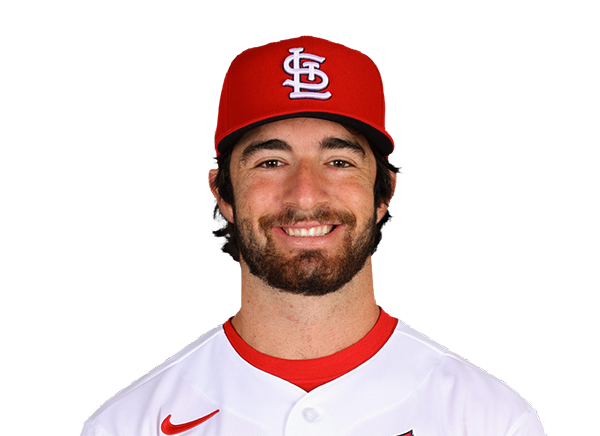 Thomas Saggese | 0-4 | 4 | 0 | 0 | 0 | 0 | 0 | 2 | 15 | .232 | .295 | .355 |
 Masyn Winn | 0-3 | 3 | 0 | 0 | 0 | 0 | 1 | 2 | 19 | .232 | .308 | .317 |
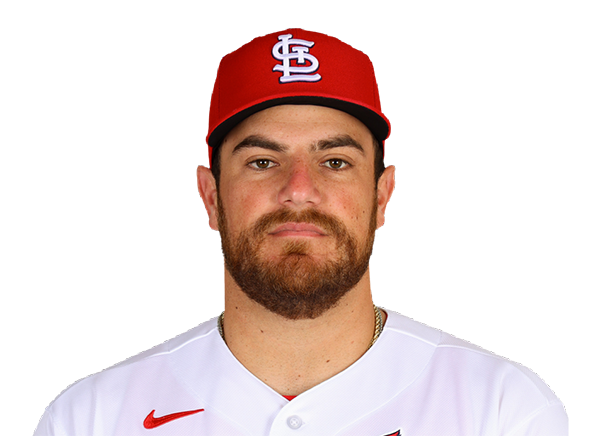 Pedro Pages | 0-2 | 2 | 0 | 0 | 0 | 0 | 0 | 1 | 8 | .213 | .265 | .309 |
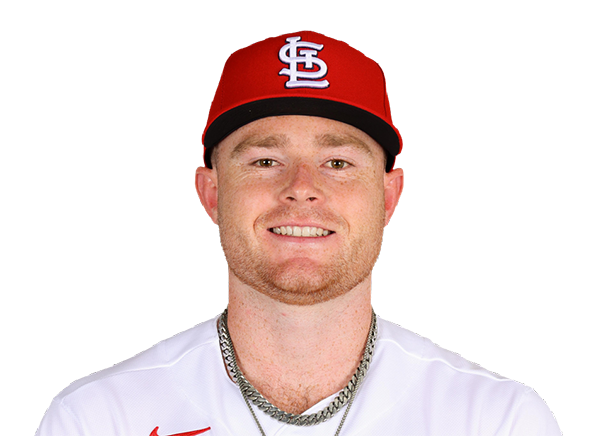 Nathan Church | 0-1 | 1 | 0 | 0 | 0 | 0 | 0 | 0 | 5 | .251 | .294 | .370 |
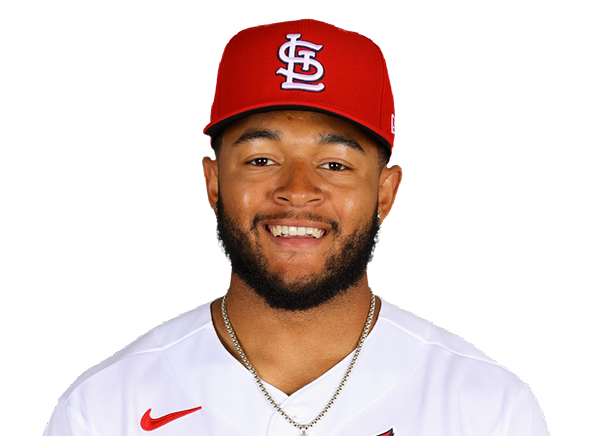 Victor Scott II | 1-3 | 3 | 0 | 1 | 0 | 0 | 0 | 1 | 10 | .193 | .270 | .253 |
Milwaukee Brewers
| Player | H-AB | AB | R | H | RBI | HR | BB | K | #P | AVG | OBP | SLG |
|---|---|---|---|---|---|---|---|---|---|---|---|---|
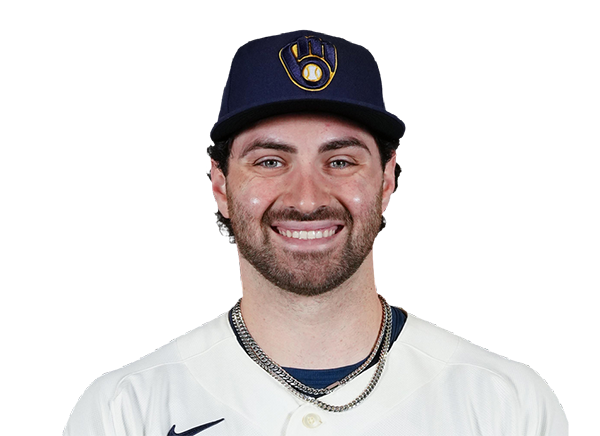 Garrett Mitchell | 1-4 | 4 | 2 | 1 | 0 | 0 | 0 | 0 | 15 | .263 | .352 | .418 |
 Brice Turang | 3-5 | 5 | 2 | 3 | 3 | 0 | 0 | 0 | 25 | .268 | .366 | .447 |
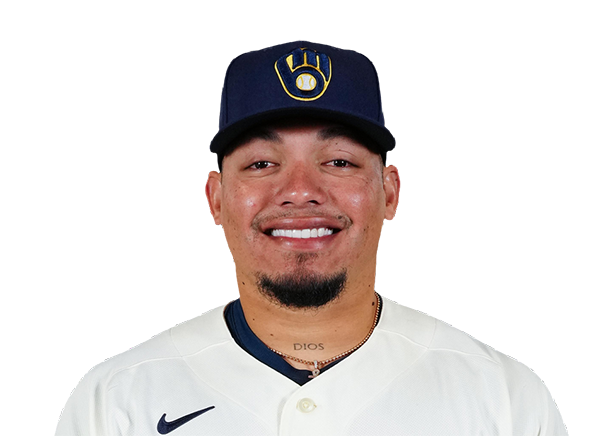 William Contreras | 1-5 | 5 | 0 | 1 | 1 | 0 | 0 | 0 | 16 | .270 | .340 | .417 |
 Jake Bauers | 1-4 | 4 | 1 | 1 | 2 | 0 | 0 | 2 | 24 | .268 | .391 | .489 |
 Christian Yelich | 1-3 | 3 | 1 | 1 | 0 | 0 | 2 | 1 | 20 | .236 | .316 | .381 |
 Joey Ortiz | 2-3 | 3 | 0 | 2 | 0 | 0 | 1 | 0 | 18 | .270 | .328 | .402 |
 Cooper Pratt | 0-1 | 1 | 0 | 0 | 0 | 0 | 0 | 0 | 7 | .281 | .349 | .367 |
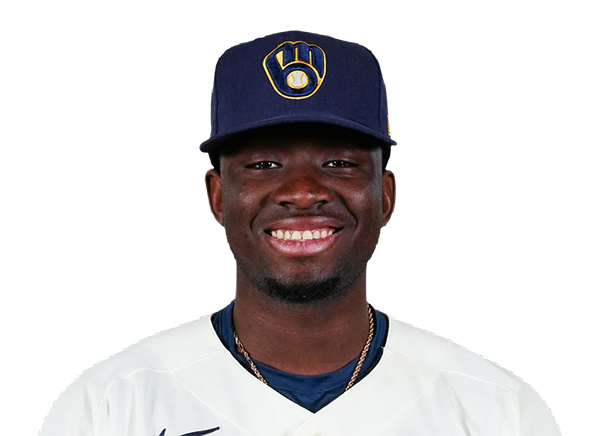 Luis Lara | 0-3 | 3 | 0 | 0 | 1 | 0 | 1 | 1 | 17 | .246 | .313 | .326 |
 Sal Frelick | 0-2 | 2 | 0 | 0 | 0 | 0 | 0 | 0 | 5 | .232 | .298 | .321 |
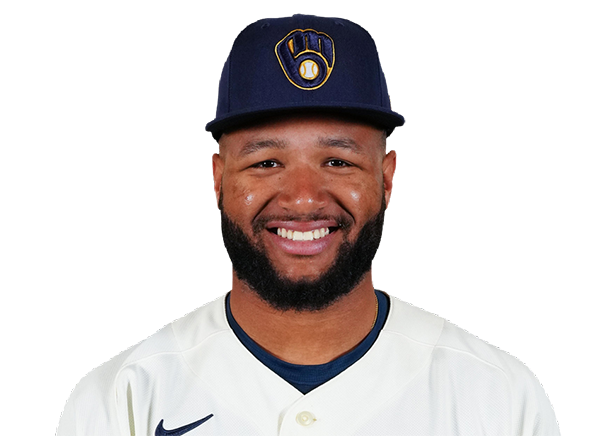 Jackson Chourio | 1-1 | 1 | 1 | 1 | 1 | 0 | 1 | 0 | 12 | .286 | .347 | .484 |
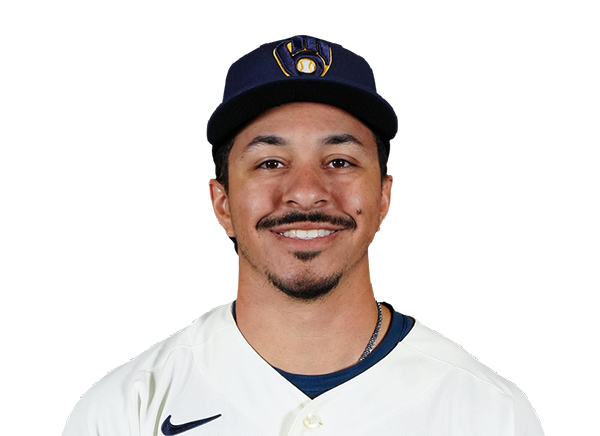 David Hamilton | 2-3 | 3 | 1 | 2 | 0 | 0 | 0 | 1 | 11 | .243 | .313 | .333 |
St. Louis Cardinals
| Player | IP | H | R | ER | BB | K | HR | PC-ST | ERA | PC |
|---|---|---|---|---|---|---|---|---|---|---|
 Michael McGreevy | 4.2 | 9 | 4 | 4 | 2 | 2 | 0 | 92-53 | 3.95 | 92 |
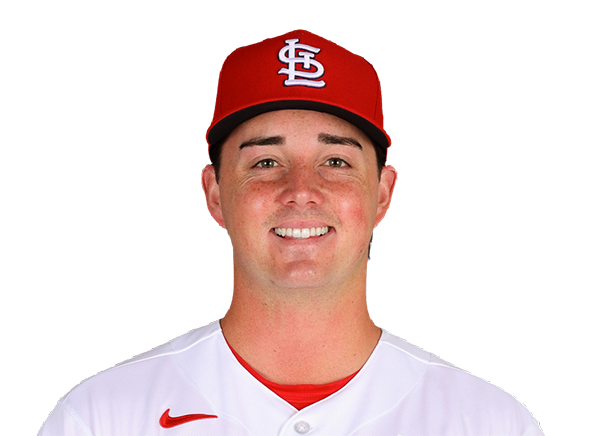 Brycen Mautz | 1.1 | 0 | 0 | 0 | 1 | 1 | 0 | 25-13 | 5.87 | 25 |
 Luis Gastelum | 1.0 | 1 | 1 | 1 | 1 | 2 | 0 | 27-19 | 4.42 | 27 |
 Justin Bruihl | 0.0 | 1 | 3 | 1 | 0 | 0 | 0 | 5-3 | 3.81 | 5 |
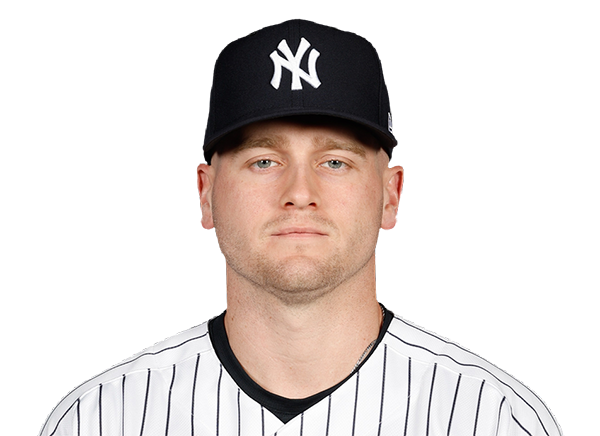 Cade Winquest | 1.0 | 1 | 0 | 0 | 1 | 0 | 0 | 21-11 | 4.26 | 21 |
Milwaukee Brewers
| Player | IP | H | R | ER | BB | K | HR | PC-ST | ERA | PC |
|---|---|---|---|---|---|---|---|---|---|---|
 Robert Gasser | 6.0 | 1 | 1 | 1 | 1 | 9 | 1 | 87-57 | 3.87 | 87 |
 Bryse Wilson | 1.0 | 3 | 3 | 3 | 0 | 1 | 2 | 25-17 | 4.33 | 25 |
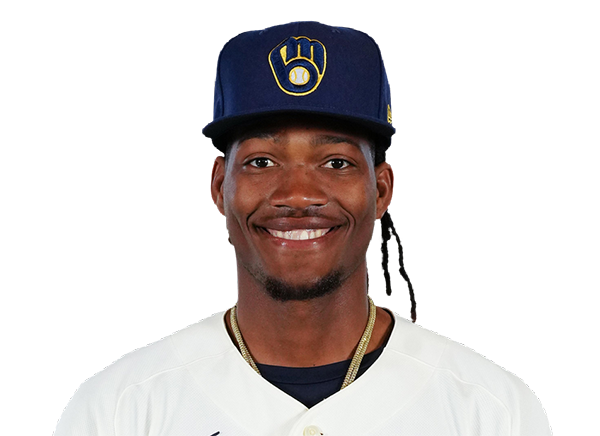 Abner Uribe | 1.0 | 1 | 0 | 0 | 0 | 1 | 0 | 11-9 | 1.97 | 11 |
 Trevor Megill | 1.0 | 1 | 0 | 0 | 0 | 1 | 0 | 11-11 | 2.63 | 11 |
H2H / Season Series
MIL8–4
STL
STL4–8
MIL
STL5–1
MIL
STL2–10
MIL
STL3–4
MIL
STL3–4
MIL
MIL2–1
STL
MIL6–0
STL
MIL5–1
STL
STL2–6
MIL
Last 5 Games
| Date | Opponent | Result |
|---|---|---|
| Sep 25 | @ MIL | L4–8 |
| Sep 24 |  @ PIT | L1–2 |
| Sep 23 | @ PIT | W5–1 |
| Sep 22 | @ PIT | L0–2 |
| Sep 20 |  vs WSH | W5–3 |
| Date | Opponent | Result |
|---|---|---|
| Sep 25 | vs STL | W8–4 |
| Sep 24 |  @ PHI | W5–1 |
| Sep 23 | @ PHI | W4–1 |
| Sep 22 | @ PHI | L4–6 |
| Sep 20 |  @ BAL | W3–0 |
Standings
American League
| Team | W | L | PCT | GB | DIFF | STRK |
|---|---|---|---|---|---|---|
1 Rays | 97 | 63 | .606 | - | +79 | W1 |
2 Guardians | 84 | 76 | .525 | 13 | +6 | W2 |
3 Astros | 79 | 81 | .494 | 18 | -52 | L1 |
4 Yankees | 93 | 68 | .578 | 4.5 | +138 | W1 |
5 Red Sox | 87 | 74 | .540 | 10.5 | +82 | W2 |
6 White Sox | 83 | 77 | .519 | 14 | +57 | W2 |
7 Rangers | 79 | 81 | .494 | 18 | -48 | L1 |
| 8Orioles | 79 | 82 | .491 | 18.5 | -21 | L1 |
9 Blue Jays | 78 | 82 | .488 | 19 | -46 | W1 |
10 Twins | 76 | 84 | .475 | 21 | -56 | W3 |
11 Tigers | 75 | 85 | .469 | 22 | +72 | W1 |
12 Mariners | 74 | 86 | .463 | 23 | -66 | L2 |
13 Royals | 68 | 92 | .425 | 29 | -115 | L2 |
14 Athletics | 64 | 96 | .400 | 33 | -218 | W1 |
15 Angels | 62 | 98 | .388 | 35 | -89 | W2 |
National League
| Team | W | L | PCT | GB | DIFF | STRK |
|---|---|---|---|---|---|---|
| 1Brewers | 101 | 59 | .631 | - | +211 | W3 |
2 Dodgers | 98 | 62 | .613 | 3 | +196 | W1 |
3 Braves | 93 | 67 | .581 | 8 | +113 | L2 |
4 Padres | 89 | 71 | .556 | 12 | +33 | L1 |
5 Cubs | 88 | 73 | .547 | 13.5 | +143 | L2 |
| 6Phillies | 87 | 73 | .544 | 14 | +22 | L3 |
7 Diamondbacks | 86 | 74 | .538 | 15 | +17 | W6 |
| 8Pirates | 81 | 79 | .506 | 20 | +27 | L1 |
9 Marlins | 79 | 81 | .494 | 22 | +6 | W1 |
| 10Cardinals | 77 | 83 | .481 | 24 | -26 | L2 |
| 11Nationals | 76 | 84 | .475 | 25 | +10 | W3 |
12 Reds | 74 | 86 | .463 | 27 | -160 | L1 |
13 Mets | 73 | 87 | .456 | 28 | -36 | L2 |
14 Giants | 65 | 95 | .406 | 36 | -86 | L3 |
15 Rockies | 57 | 103 | .356 | 44 | -193 | L5 |
STL
VS
MIL
Pitchers
Michael McGreevy
Catchers
Pedro Pages
Infielders
JJ Wetherholt
Leo Bernal
Thomas Saggese
Masyn Winn
Outfielders
Jordan Walker
Jose Fermin
Victor Scott II
Designated Hitters
Ivan Herrera
Pitchers
Robert Gasser
Catchers
William Contreras
Infielders
Brice Turang
Jake Bauers
Joey Ortiz
David Hamilton
Outfielders
Garrett Mitchell
Luis Lara
Sal Frelick
Designated Hitters
Christian Yelich
Cardinals
VS
Brewers
Batting
160
Team Games Played
160
5398
At Bats
5439
1299
Hits
1404
690
Runs Batted In
779
165
Home Runs
152
99
Stolen Bases
161
.241
Batting Average
.258
714
Runs
823
228
Doubles
276
14
Triples
26
2050
Total Bases
2188
505
Walks
662
1283
Strikeouts
1366
.314
On Base Percentage
.340
.380
Slugging Percentage
.402
.693
OBP Pct + SLG Pct
.743
160
Games Played
160
160
Games Started
160
95
Hit By Pitch
40
0.0
Wins Above Replacement
0.0
0.0
Offensive Wins Above Replacement
0.0
26
Caught Stealing
53
1
Is Qualified
1
657.2
Runs Created
776.4
4.1
Runs Created Per 27 Outs
4.9
.083
Walks Per Plate Appearance
.106
0.39
Walk To Strikeout Ratio
0.48
.139
Isolated Power
.144
.246
Secondary Average
.286
3.87
Pitches Per Plate Appearance
3.98
407
Extra Base Hits
454
6074
Plate Appearances
6229
32.7
At Bats Per Home Run
35.8
19
Sacrifice Hit
36
55
Sacrifice Flies
45
Pitching
160
Team Games Played
160
54
Quality Starts
53
77
Wins
101
83
Losses
59
46
Saves
53
95
Holds
85
1375
Hits
1179
675
Earned runs
559
156
Home Runs
169
558
Walks
512
1261
Strikeouts
1521
8.0
Strikeouts Per 9 Innings
9.6
150.0
Pitches Per Start
146.0
1.35
Walks Plus Hits Per Inning Pitched
1.18
4.26
Earned Run Average
3.52
83
Losses
59
1426.2
Innings pitched
1428.2
.481
Win Percentage
.631
76
Save Opportunities
74
.254
Opponent Batting Average
.222
.329
Opponent's On-base pct.
.298
.397
Opponent's Slugging pct.
.364
.726
Opponent's OPB Pct + SLG Pct
.662
5423
At Bats
5302
282
Doubles
218
15
Triples
14
75
Batters Hit
66
118
Stolen Bases
70
160
Games Played
160
1
Complete Games
1
9
Shutouts
12
62
Wild Pitches
50
702
Runs Batted In
585
3
Balks
6
1426.2
Innings pitched
1428.2
8.0
Strikeouts Per 9 Innings
9.6
29
Caught Stealing
31
160
Games Started
160
0.0
Wins Above Replacement
0.0
1
Is Qualified
1
740
Runs
612
675
Earned Runs
559
2155
Total Bases
1932
Fielding
160
Team Games Played
160
1427
Full Innings
1429
5858
Total Chances
5617
4280
Putouts
4286
1500
Assists
1260
78
Errors
71
228
Double Plays
276
0.987
Fielding Percentage
0.987
36.5
Range Factor
34.9
0.0
Zone Rating
0.0
160
Games Played
160
0
Games Started
0
0.0
Defensive Wins Above Replacement
0.0
1
Qualified
1