

Cardinals vs Brewers Live Score (26 Sep, 2026)
Game Information
Stage
STD
Season
2026
First Pitch
Sat, Sep 26, 7:10 pm
Venue
American Family Field
Location
Milwaukee, Wisconsin
Venue Type
Indoor
Broadcast
MLB.TV
Attendance
42,900
Live Situation
2Balls
3Strikes
0Outs
—Pitcher
—At Bat
Pitch Sequence
1
STRIKE SWINGING
Sinker
98 MPH
2
STRIKE SWINGING
Sinker
98 MPH
3
BALL
Sinker
98 MPH
4
BALL
Changeup
92 MPH
5
STRIKE SWINGING
Curve
85 MPH
Injury Report



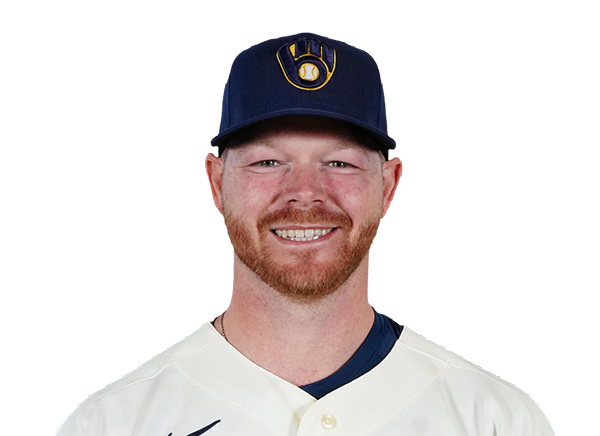
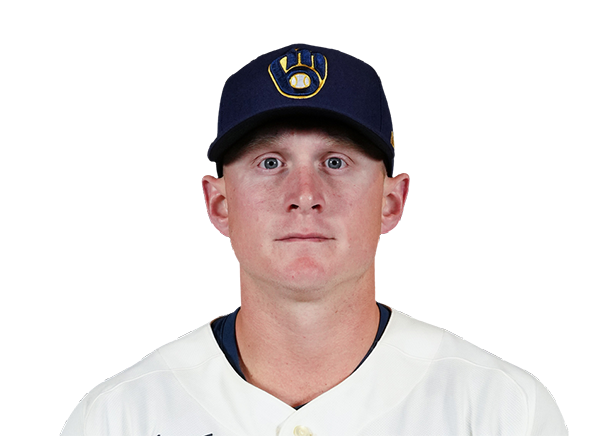

Team Stats
 STL
MIL


2
Runs
3
3
Hits
8
1
Errors
0
1
Home Runs
1
1
Walks
5
15
Strikeouts
11
Player Box Score
St. Louis Cardinals
| Player | H-AB | AB | R | H | RBI | HR | BB | K | #P | AVG | OBP | SLG |
|---|---|---|---|---|---|---|---|---|---|---|---|---|
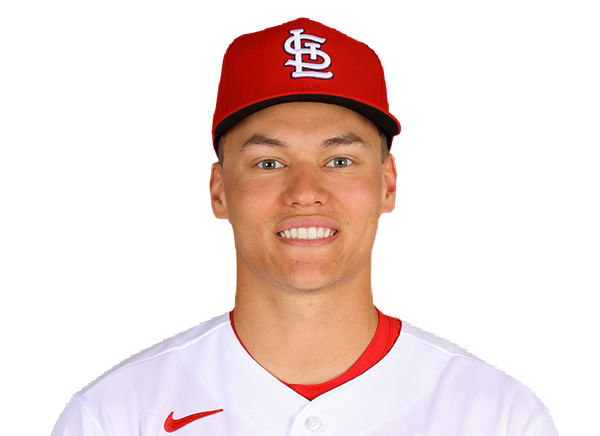 JJ Wetherholt | 0-4 | 4 | 0 | 0 | 0 | 0 | 0 | 2 | 14 | .242 | .339 | .365 |
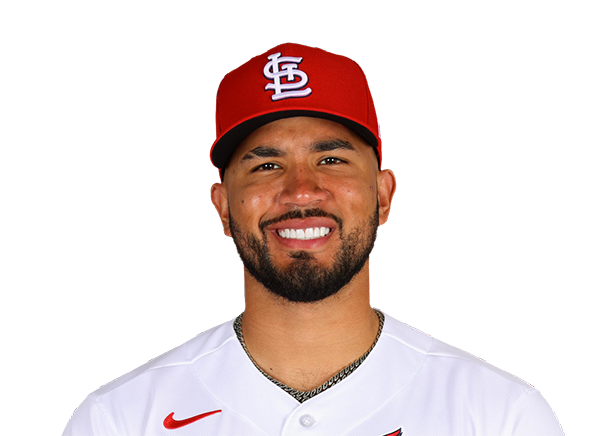 Ivan Herrera | 0-4 | 4 | 0 | 0 | 0 | 0 | 0 | 1 | 13 | .243 | .353 | .384 |
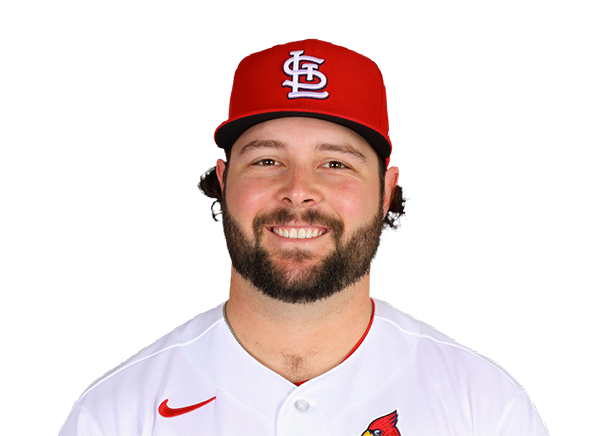 Alec Burleson | 1-4 | 4 | 1 | 1 | 1 | 1 | 0 | 2 | 21 | .279 | .343 | .473 |
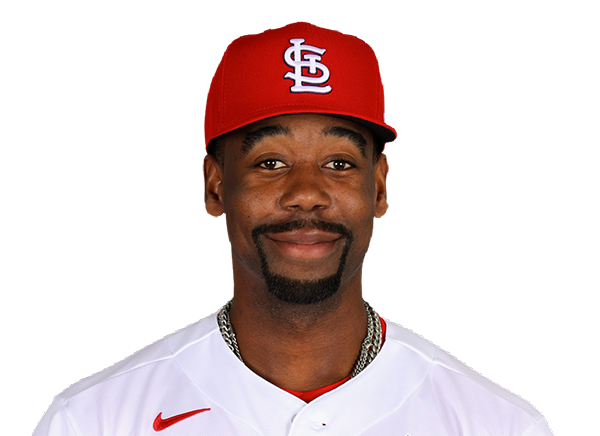 Jordan Walker | 1-4 | 4 | 1 | 1 | 0 | 0 | 0 | 1 | 13 | .271 | .329 | .469 |
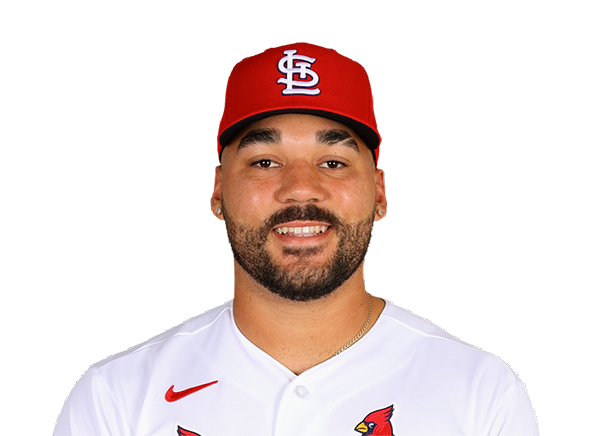 Leo Bernal | 0-4 | 4 | 0 | 0 | 0 | 0 | 0 | 3 | 22 | .280 | .316 | .441 |
 Nolan Gorman | 0-1 | 1 | 0 | 0 | 0 | 0 | 1 | 1 | 8 | .187 | .275 | .313 |
 Jose Fermin | 0-1 | 1 | 0 | 0 | 0 | 0 | 0 | 0 | 5 | .251 | .312 | .359 |
 Bryan Torres | 0-2 | 2 | 0 | 0 | 0 | 0 | 0 | 1 | 14 | .229 | .309 | .331 |
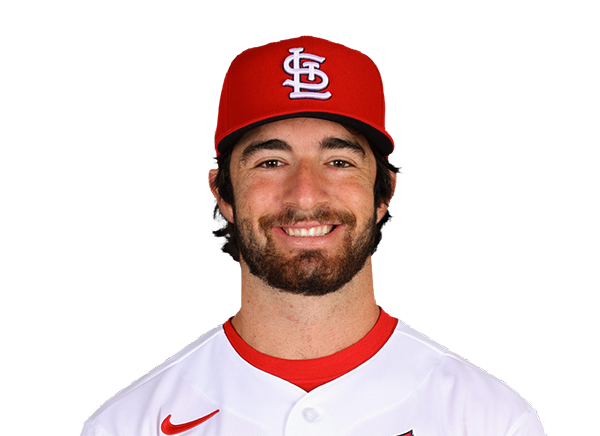 Thomas Saggese | 1-3 | 3 | 0 | 1 | 1 | 0 | 0 | 2 | 11 | .234 | .295 | .354 |
 Nathan Church | 0-3 | 3 | 0 | 0 | 0 | 0 | 0 | 2 | 23 | .249 | .292 | .367 |
Milwaukee Brewers
| Player | H-AB | AB | R | H | RBI | HR | BB | K | #P | AVG | OBP | SLG |
|---|---|---|---|---|---|---|---|---|---|---|---|---|
 Jackson Chourio | 2-4 | 4 | 1 | 2 | 1 | 0 | 0 | 0 | 17 | .288 | .348 | .485 |
 Brice Turang | 1-3 | 3 | 1 | 1 | 2 | 1 | 1 | 2 | 21 | .268 | .367 | .452 |
 Jake Bauers | 0-3 | 3 | 0 | 0 | 0 | 0 | 1 | 2 | 17 | .266 | .390 | .486 |
 William Contreras | 1-3 | 3 | 0 | 1 | 0 | 0 | 1 | 1 | 17 | .270 | .341 | .417 |
 Gary Sanchez | 0-2 | 2 | 0 | 0 | 0 | 0 | 0 | 1 | 5 | .208 | .351 | .412 |
 Christian Yelich | 0-2 | 2 | 0 | 0 | 0 | 0 | 0 | 1 | 9 | .235 | .315 | .379 |
 Luis Lara | 1-4 | 4 | 0 | 1 | 0 | 0 | 0 | 1 | 9 | .246 | .311 | .325 |
 Cooper Pratt | 1-3 | 3 | 0 | 1 | 0 | 0 | 1 | 0 | 15 | .281 | .351 | .371 |
 Brandon Lockridge | 1-2 | 2 | 1 | 1 | 0 | 0 | 0 | 1 | 6 | .277 | .348 | .327 |
 Garrett Mitchell | 0-1 | 1 | 0 | 0 | 0 | 0 | 1 | 1 | 15 | .262 | .353 | .417 |
 David Hamilton | 1-3 | 3 | 0 | 1 | 0 | 0 | 0 | 1 | 10 | .244 | .314 | .336 |
St. Louis Cardinals
| Player | IP | H | R | ER | BB | K | HR | PC-ST | ERA | PC |
|---|---|---|---|---|---|---|---|---|---|---|
 Quinn Mathews | 5.0 | 5 | 3 | 3 | 2 | 7 | 1 | 81-54 | 3.83 | 81 |
 Gordon Graceffo | 2.0 | 3 | 0 | 0 | 1 | 3 | 0 | 40-23 | 2.67 | 40 |
 Cade Winquest | 1.0 | 0 | 0 | 0 | 2 | 1 | 0 | 20-11 | 3.95 | 20 |
Milwaukee Brewers
| Player | IP | H | R | ER | BB | K | HR | PC-ST | ERA | PC |
|---|---|---|---|---|---|---|---|---|---|---|
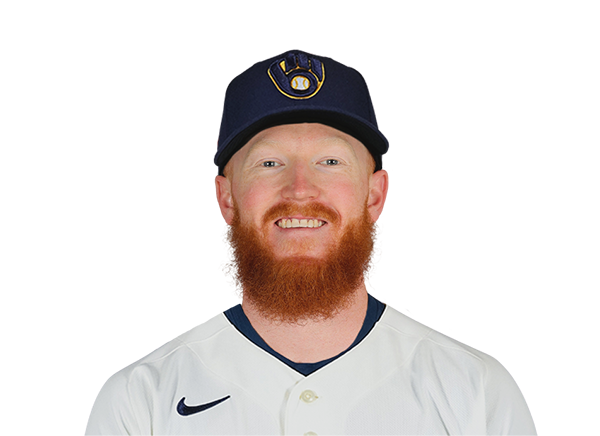 Dustin May | 3.0 | 3 | 2 | 2 | 1 | 5 | 1 | 58-38 | 4.70 | 58 |
 Kyle Harrison | 2.0 | 0 | 0 | 0 | 0 | 4 | 0 | 29-20 | 4.20 | 29 |
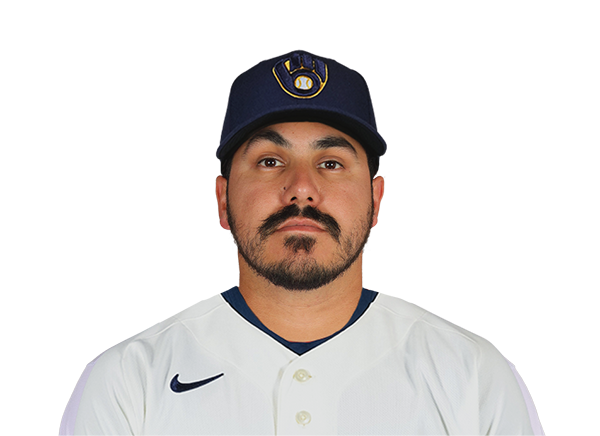 JoJo Romero | 1.2 | 0 | 0 | 0 | 0 | 3 | 0 | 26-15 | 3.36 | 26 |
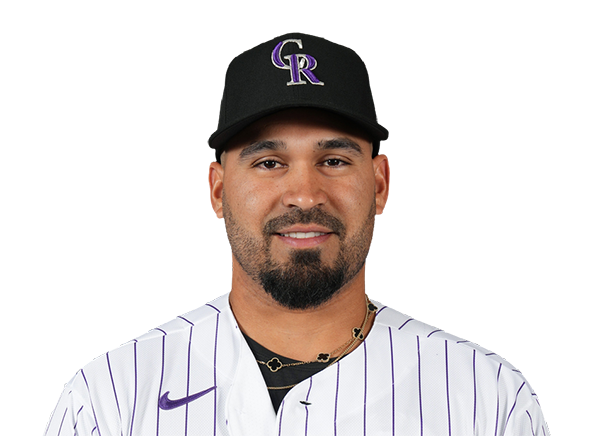 Antonio Senzatela | 0.1 | 0 | 0 | 0 | 0 | 1 | 0 | 5-4 | 4.05 | 5 |
 Aaron Ashby | 2.0 | 0 | 0 | 0 | 0 | 2 | 0 | 26-16 | 3.12 | 26 |
H2H / Season Series
MIL3–2
STL
MIL8–4
STL
STL4–8
MIL
STL5–1
MIL
STL2–10
MIL
STL3–4
MIL
STL3–4
MIL
MIL2–1
STL
MIL6–0
STL
MIL5–1
STL
Last 5 Games
| Date | Opponent | Result |
|---|---|---|
| Sep 26 | @ MIL | L2–3 |
| Sep 25 | @ MIL | L4–8 |
| Sep 24 |  @ PIT | L1–2 |
| Sep 23 | @ PIT | W5–1 |
| Sep 22 | @ PIT | L0–2 |
| Date | Opponent | Result |
|---|---|---|
| Sep 26 | vs STL | W3–2 |
| Sep 25 | vs STL | W8–4 |
| Sep 24 |  @ PHI | W5–1 |
| Sep 23 | @ PHI | W4–1 |
| Sep 22 | @ PHI | L4–6 |
Standings
American League
| Team | W | L | PCT | GB | DIFF | STRK |
|---|---|---|---|---|---|---|
1 Rays | 98 | 63 | .609 | - | +90 | W2 |
2 Guardians | 85 | 76 | .528 | 13 | +12 | W3 |
3 Astros | 80 | 81 | .497 | 18 | -41 | W1 |
4 Yankees | 93 | 68 | .578 | 5 | +138 | W1 |
5 Red Sox | 87 | 74 | .540 | 11 | +82 | W2 |
6 White Sox | 83 | 78 | .516 | 15 | +54 | L1 |
7 Rangers | 80 | 81 | .497 | 18 | -44 | W1 |
8 Orioles | 79 | 82 | .491 | 19 | -21 | L1 |
9 Blue Jays | 78 | 83 | .484 | 20 | -50 | L1 |
10 Twins | 76 | 85 | .472 | 22 | -60 | L1 |
11 Tigers | 76 | 85 | .472 | 22 | +73 | W2 |
12 Mariners | 75 | 86 | .466 | 23 | -62 | W1 |
13 Royals | 68 | 93 | .422 | 30 | -121 | L3 |
14 Athletics | 64 | 97 | .398 | 34 | -229 | L1 |
15 Angels | 62 | 99 | .385 | 36 | -93 | L1 |
National League
| Team | W | L | PCT | GB | DIFF | STRK |
|---|---|---|---|---|---|---|
| 1Brewers | 102 | 59 | .634 | - | +212 | W4 |
2 Dodgers | 99 | 62 | .615 | 3 | +197 | W2 |
3 Braves | 94 | 67 | .584 | 8 | +118 | W1 |
4 Padres | 90 | 71 | .559 | 12 | +36 | W1 |
5 Cubs | 88 | 73 | .547 | 14 | +143 | L2 |
| 6Phillies | 87 | 74 | .540 | 15 | +11 | L4 |
7 Diamondbacks | 86 | 75 | .534 | 16 | +14 | L1 |
| 8Pirates | 81 | 80 | .503 | 21 | +26 | L2 |
9 Marlins | 79 | 82 | .491 | 23 | +1 | L1 |
| 10Cardinals | 77 | 84 | .478 | 25 | -27 | L3 |
11 Nationals | 76 | 85 | .472 | 26 | +4 | L1 |
12 Reds | 75 | 86 | .466 | 27 | -156 | W1 |
13 Mets | 74 | 87 | .460 | 28 | -30 | W1 |
14 Giants | 65 | 96 | .404 | 37 | -87 | L4 |
15 Rockies | 58 | 103 | .360 | 44 | -190 | W1 |
STL
VS
MIL
Pitchers
Quinn Mathews
Catchers
Leo Bernal
Infielders
JJ Wetherholt
Alec Burleson
Nolan Gorman
Thomas Saggese
Outfielders
Jordan Walker
Bryan Torres
Nathan Church
Designated Hitters
Ivan Herrera
Pitchers
Dustin May
Catchers
William Contreras
Infielders
Brice Turang
Jake Bauers
Cooper Pratt
David Hamilton
Outfielders
Jackson Chourio
Luis Lara
Brandon Lockridge
Designated Hitters
Gary Sanchez
Cardinals
VS
Brewers
Batting
161
Team Games Played
161
5428
At Bats
5469
1302
Hits
1412
692
Runs Batted In
782
166
Home Runs
153
100
Stolen Bases
162
.240
Batting Average
.258
716
Runs
826
228
Doubles
279
14
Triples
26
2056
Total Bases
2202
506
Walks
667
1298
Strikeouts
1377
.313
On Base Percentage
.341
.379
Slugging Percentage
.403
.692
OBP Pct + SLG Pct
.743
161
Games Played
161
161
Games Started
161
96
Hit By Pitch
40
0.0
Wins Above Replacement
0.0
0.0
Offensive Wins Above Replacement
0.0
26
Caught Stealing
54
1
Is Qualified
1
657.5
Runs Created
781.3
4.1
Runs Created Per 27 Outs
4.9
.083
Walks Per Plate Appearance
.106
0.39
Walk To Strikeout Ratio
0.48
.139
Isolated Power
.144
.246
Secondary Average
.286
3.87
Pitches Per Plate Appearance
3.98
408
Extra Base Hits
458
6106
Plate Appearances
6265
32.7
At Bats Per Home Run
35.7
19
Sacrifice Hit
37
55
Sacrifice Flies
45
Pitching
161
Team Games Played
161
54
Quality Starts
53
77
Wins
102
84
Losses
59
46
Saves
54
95
Holds
87
1383
Hits
1182
678
Earned runs
561
157
Home Runs
170
563
Walks
513
1272
Strikeouts
1536
8.0
Strikeouts Per 9 Innings
9.6
150.0
Pitches Per Start
146.0
1.36
Walks Plus Hits Per Inning Pitched
1.18
4.25
Earned Run Average
3.51
84
Losses
59
1434.2
Innings pitched
1437.2
.478
Win Percentage
.634
76
Save Opportunities
75
.254
Opponent Batting Average
.222
.329
Opponent's On-base pct.
.297
.398
Opponent's Slugging pct.
.363
.727
Opponent's OPB Pct + SLG Pct
.660
5453
At Bats
5332
285
Doubles
218
15
Triples
14
75
Batters Hit
67
119
Stolen Bases
71
161
Games Played
161
1
Complete Games
1
9
Shutouts
12
62
Wild Pitches
50
705
Runs Batted In
587
3
Balks
6
1434.2
Innings pitched
1437.2
8.0
Strikeouts Per 9 Innings
9.6
30
Caught Stealing
31
161
Games Started
161
0.0
Wins Above Replacement
0.0
1
Is Qualified
1
743
Runs
614
678
Earned Runs
561
2169
Total Bases
1938
Fielding
161
Team Games Played
161
1435
Full Innings
1438
5890
Total Chances
5648
4304
Putouts
4313
1507
Assists
1264
79
Errors
71
228
Double Plays
279
0.987
Fielding Percentage
0.987
36.5
Range Factor
34.9
0.0
Zone Rating
0.0
161
Games Played
161
0
Games Started
0
0.0
Defensive Wins Above Replacement
0.0
1
Qualified
1