

Cardinals vs Cubs Live Score (14 Aug, 2026)
Game Information
Stage
Standard
Season
2026
First Pitch
Fri, Aug 14, 2:20 pm
Venue
Wrigley Field
Location
Chicago, Illinois
Attendance
40,374
Inning Scores
Injury Report

Team Stats
 STL
CHC

Array
Runs
Array
3
Hits
6
0
Errors
0
—
Home Runs
—
—
Walks
—
—
Strikeouts
—
Standings
American League
| Team | W | L | PCT | GB | DIFF | STRK |
|---|---|---|---|---|---|---|
1 Rays | 76 | 52 | .594 | - | +43 | L2 |
2 White Sox | 67 | 61 | .523 | 9 | +47 | W1 |
3 Astros | 65 | 64 | .504 | 11.5 | -42 | W1 |
4 Yankees | 73 | 56 | .566 | 3.5 | +95 | L1 |
5 Red Sox | 69 | 59 | .539 | 7 | +97 | W1 |
6 Rangers | 64 | 65 | .496 | 12.5 | -45 | W2 |
7 Blue Jays | 64 | 67 | .489 | 13.5 | -50 | W1 |
8 Twins | 63 | 66 | .488 | 13.5 | -45 | L1 |
9 Guardians | 63 | 66 | .488 | 13.5 | -15 | W2 |
10 Orioles | 62 | 67 | .481 | 14.5 | -34 | W1 |
11 Tigers | 61 | 67 | .477 | 15 | +79 | L3 |
12 Mariners | 61 | 68 | .473 | 15.5 | -45 | W1 |
13 Royals | 56 | 74 | .431 | 21 | -97 | W6 |
14 Angels | 51 | 78 | .395 | 25.5 | -71 | L1 |
15 Athletics | 49 | 80 | .380 | 27.5 | -189 | L5 |
National League
| Team | W | L | PCT | GB | DIFF | STRK |
|---|---|---|---|---|---|---|
1 Brewers | 81 | 49 | .623 | - | +163 | W3 |
2 Dodgers | 78 | 51 | .605 | 2.5 | +146 | W4 |
3 Braves | 75 | 55 | .577 | 6 | +108 | L2 |
| 4Cubs | 74 | 55 | .574 | 6.5 | +99 | L2 |
5 Phillies | 71 | 58 | .550 | 9.5 | +16 | W7 |
6 Padres | 69 | 60 | .535 | 11.5 | +7 | W1 |
7 Diamondbacks | 68 | 61 | .527 | 12.5 | +13 | W2 |
| 8Cardinals | 66 | 64 | .508 | 15 | +9 | L1 |
9 Marlins | 65 | 64 | .504 | 15.5 | +15 | W1 |
10 Pirates | 63 | 67 | .485 | 18 | +30 | L1 |
11 Reds | 61 | 68 | .473 | 19.5 | -98 | L2 |
12 Nationals | 61 | 69 | .469 | 20 | +16 | L2 |
13 Mets | 58 | 71 | .450 | 22.5 | -44 | L1 |
14 Giants | 52 | 76 | .406 | 28 | -78 | L2 |
15 Rockies | 50 | 78 | .391 | 30 | -130 | L4 |
STL
VS
CHC
Pitchers

Matthew Liberatore
George Soriano

Peter Strzelecki
Catchers
Ivan Herrera
Infielders
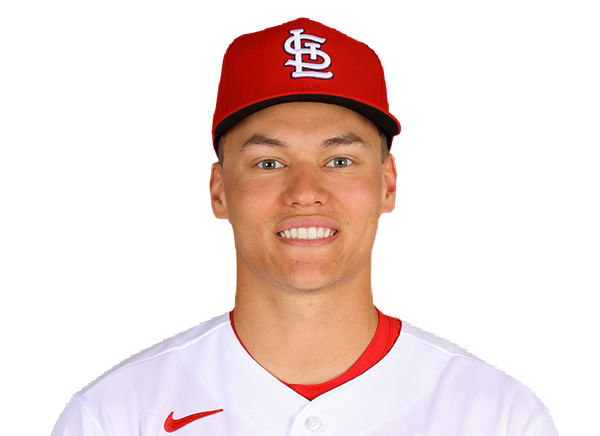
JJ Wetherholt
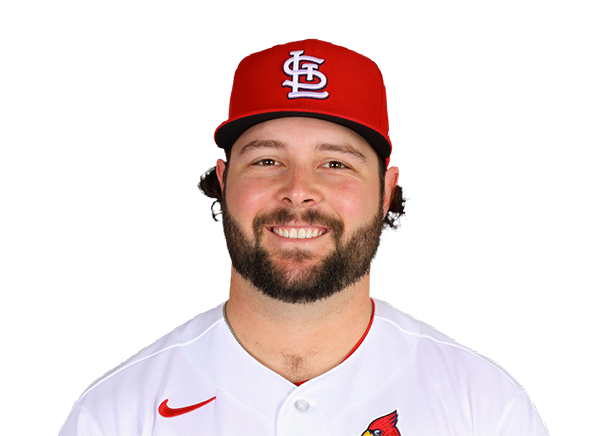
Alec Burleson

Masyn Winn

Cesar Prieto
Outfielders
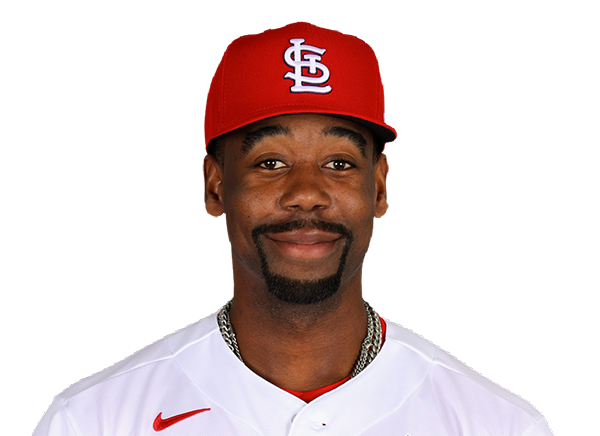
Jordan Walker

Nathan Church

Jose Fermin
Designated Hitters

Bryan Torres
Pitchers

Clay Holmes

Ryan Rolison

Ryan Zeferjahn
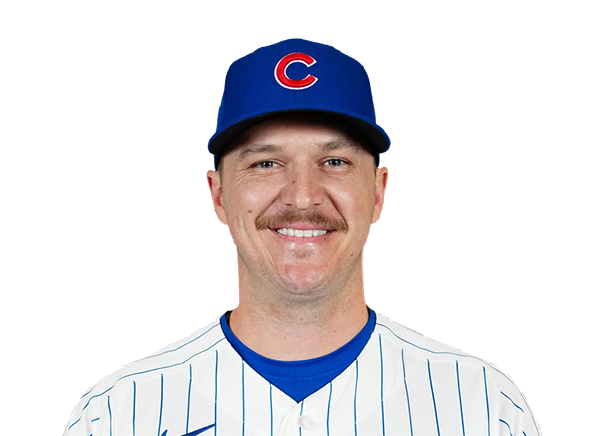
Jacob Webb
Catchers
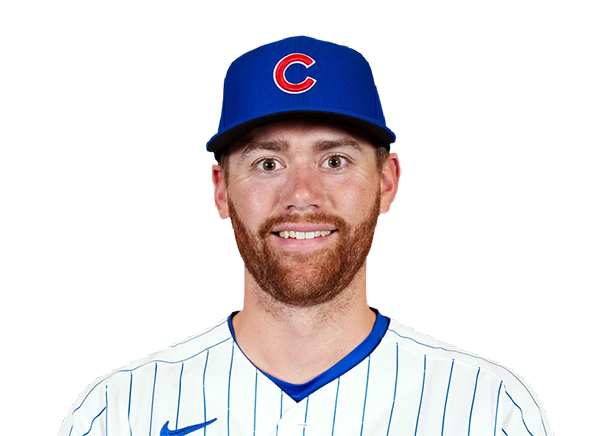
Carson Kelly
Infielders
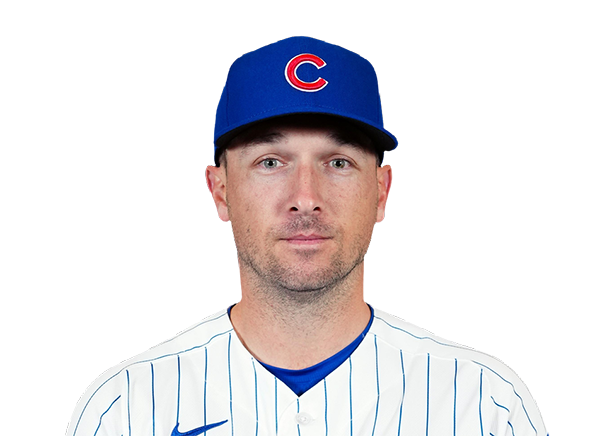
Alex Bregman

Michael Busch

Nico Hoerner

Dansby Swanson
Outfielders

Pete Crow-Armstrong
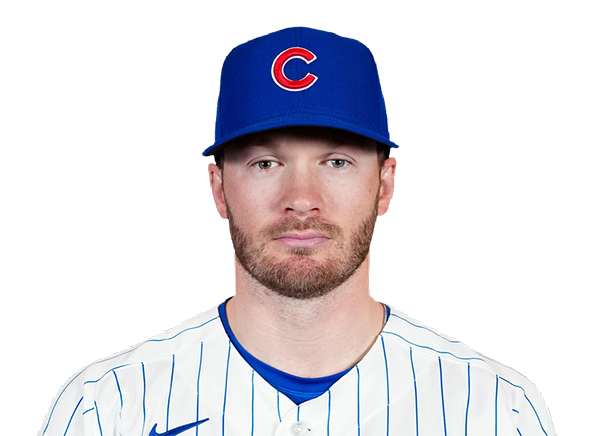
Ian Happ

Tyrone Taylor
Designated Hitters

Seiya Suzuki
Cardinals
VS
Cubs
Batting
122
Team Games Played
123
4078
At Bats
4226
977
Hits
1051
516
Runs Batted In
600
122
Home Runs
156
76
Stolen Bases
94
.240
Batting Average
.249
529
Runs
637
171
Doubles
206
12
Triples
20
1538
Total Bases
1765
395
Walks
524
939
Strikeouts
1058
.315
On Base Percentage
.338
.377
Slugging Percentage
.418
.692
OBP Pct + SLG Pct
.756
122
Games Played
123
122
Games Started
123
73
Hit By Pitch
64
0.0
Wins Above Replacement
0.0
0.0
Offensive Wins Above Replacement
0.0
21
Caught Stealing
17
1
Is Qualified
1
495.2
Runs Created
622.6
4.1
Runs Created Per 27 Outs
5.1
.086
Walks Per Plate Appearance
.108
0.42
Walk To Strikeout Ratio
0.50
.138
Isolated Power
.169
.248
Secondary Average
.311
3.86
Pitches Per Plate Appearance
3.97
305
Extra Base Hits
382
4606
Plate Appearances
4853
33.4
At Bats Per Home Run
27.1
18
Sacrifice Hit
5
40
Sacrifice Flies
33
Pitching
122
Team Games Played
123
45
Quality Starts
38
61
Wins
72
61
Losses
51
35
Saves
29
78
Holds
46
1042
Hits
1014
492
Earned runs
497
119
Home Runs
182
415
Walks
360
929
Strikeouts
943
7.7
Strikeouts Per 9 Innings
7.7
148.5
Pitches Per Start
144.3
1.34
Walks Plus Hits Per Inning Pitched
1.25
4.07
Earned Run Average
4.07
61
Losses
51
1088.1
Innings pitched
1098.2
.500
Win Percentage
.585
57
Save Opportunities
48
.252
Opponent Batting Average
.244
.327
Opponent's On-base pct.
.310
.394
Opponent's Slugging pct.
.415
.721
Opponent's OPB Pct + SLG Pct
.725
4131
At Bats
4148
210
Doubles
142
10
Triples
10
58
Batters Hit
45
87
Stolen Bases
68
122
Games Played
123
1
Complete Games
0
8
Shutouts
5
50
Wild Pitches
27
507
Runs Batted In
507
3
Balks
1
1088.1
Innings pitched
1098.2
7.7
Strikeouts Per 9 Innings
7.7
20
Caught Stealing
24
122
Games Started
123
0.0
Wins Above Replacement
0.0
1
Is Qualified
1
533
Runs
526
492
Earned Runs
497
1629
Total Bases
1722
Fielding
122
Team Games Played
123
1088
Full Innings
1099
4466
Total Chances
4489
3265
Putouts
3296
1148
Assists
1147
53
Errors
46
171
Double Plays
206
0.988
Fielding Percentage
0.990
36.5
Range Factor
36.4
0.0
Zone Rating
0.0
122
Games Played
123
0
Games Started
0
0.0
Defensive Wins Above Replacement
0.0
1
Qualified
1