

Cardinals vs Giants Live Score (9 Sep, 2026)
Game Information
Stage
STD
Season
2026
First Pitch
Tue, Sep 8, 9:45 pm
Venue
Oracle Park
Location
San Francisco, California
Venue Type
Outdoor
Broadcast
MLB.TV
Attendance
27,787
Live Situation
2Balls
2Strikes
0Outs
—Pitcher
—At Bat
Pitch Sequence
1
BALL
Sinker
94 MPH
2
BALL
Sinker
94 MPH
3
STRIKE LOOKING
Sinker
95 MPH
4
STRIKE LOOKING
Cutter
86 MPH
5
BALL IN PLAY
Sinker
96 MPH
Injury Report
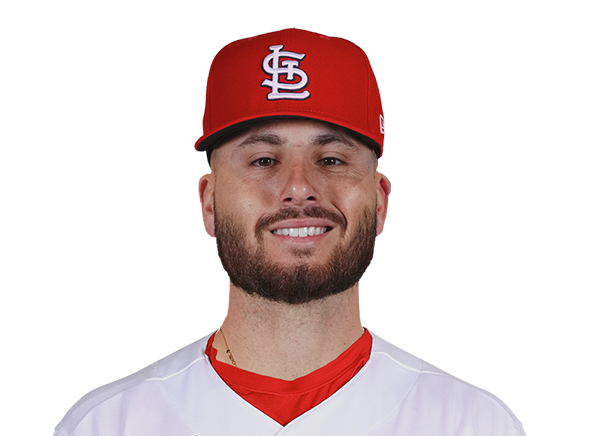
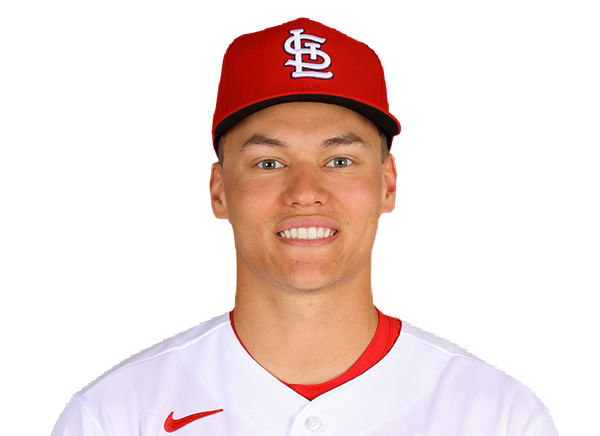

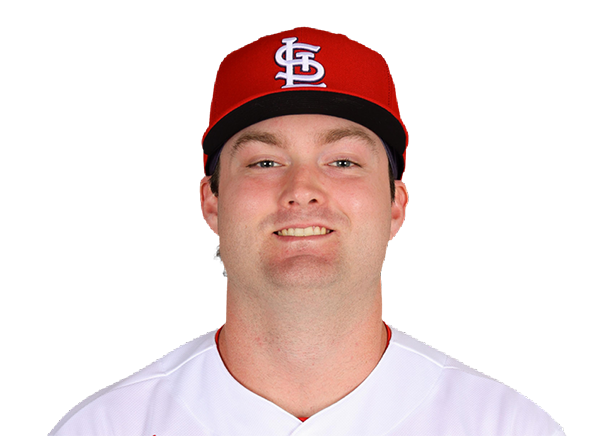
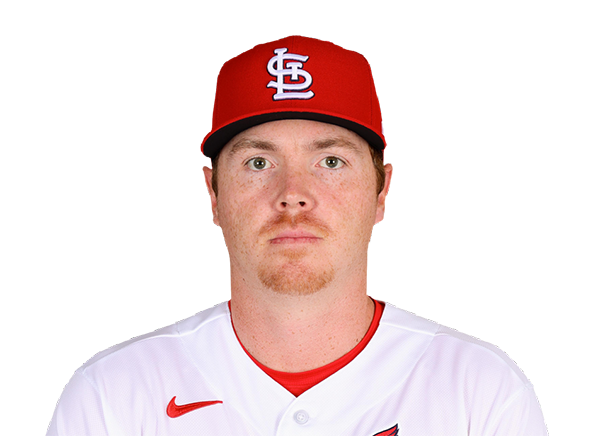
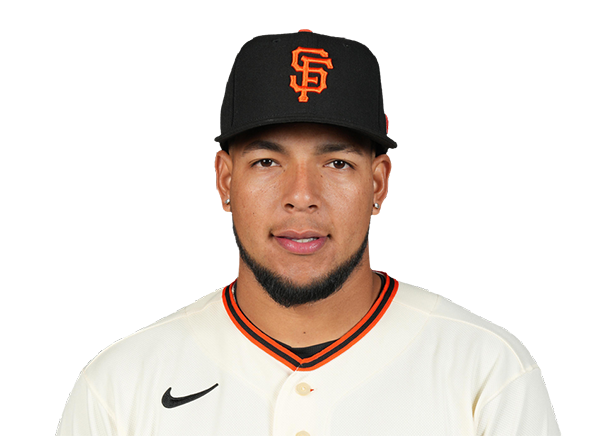

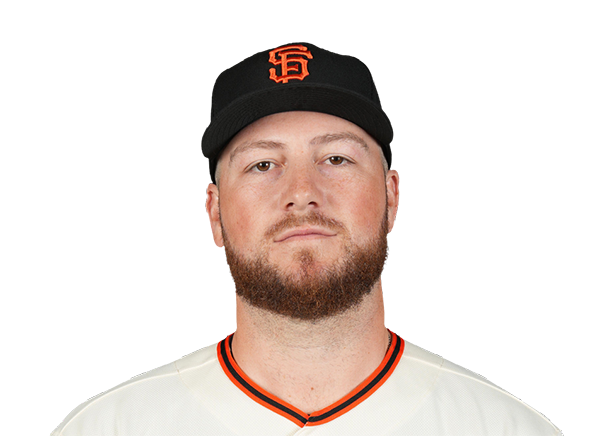
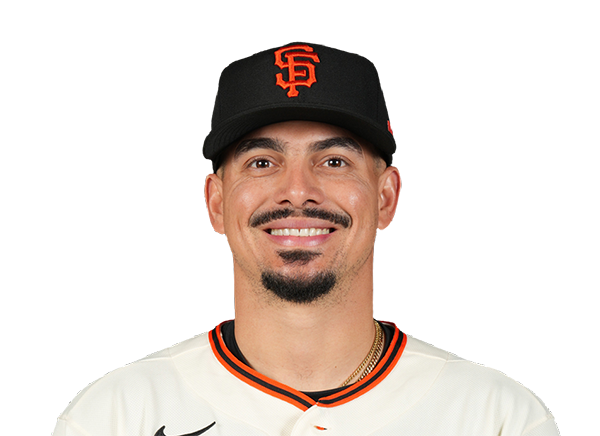
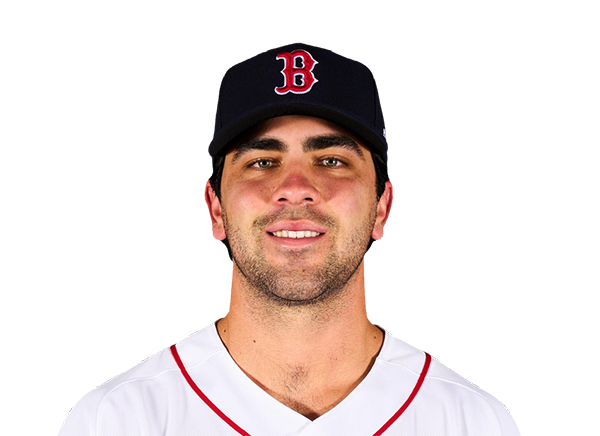
Team Stats
 STL
SF


1
Runs
2
5
Hits
6
0
Errors
1
0
Home Runs
2
6
Walks
3
3
Strikeouts
6
Player Box Score
St. Louis Cardinals
| Player | H-AB | AB | R | H | RBI | HR | BB | K | #P | AVG | OBP | SLG |
|---|---|---|---|---|---|---|---|---|---|---|---|---|
 Bryan Torres | 1-4 | 4 | 0 | 1 | 1 | 0 | 1 | 0 | 18 | .259 | .329 | .378 |
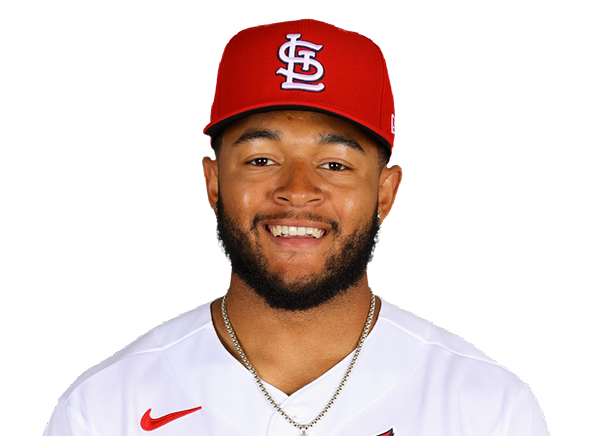 Victor Scott II | 0-0 | 0 | 0 | 0 | 0 | 0 | 0 | 0 | 0 | .197 | .278 | .261 |
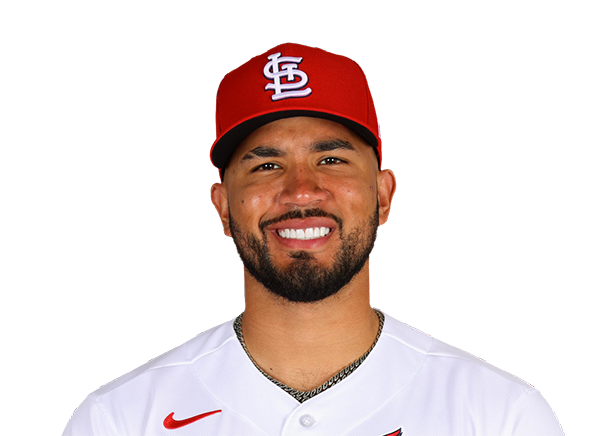 Ivan Herrera | 1-5 | 5 | 0 | 1 | 0 | 0 | 0 | 0 | 22 | .251 | .361 | .387 |
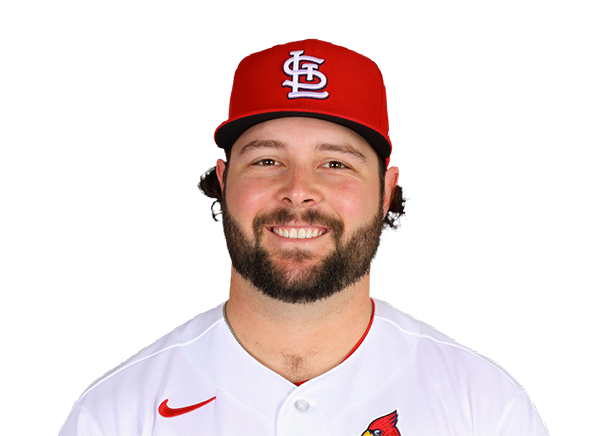 Alec Burleson | 1-1 | 1 | 0 | 1 | 0 | 0 | 3 | 0 | 25 | .284 | .349 | .468 |
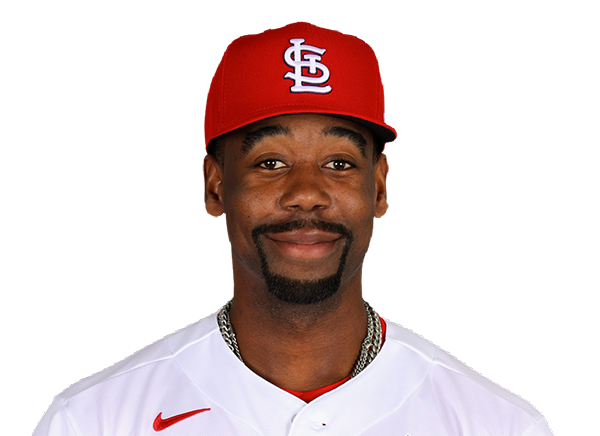 Jordan Walker | 0-4 | 4 | 0 | 0 | 0 | 0 | 0 | 0 | 12 | .282 | .338 | .490 |
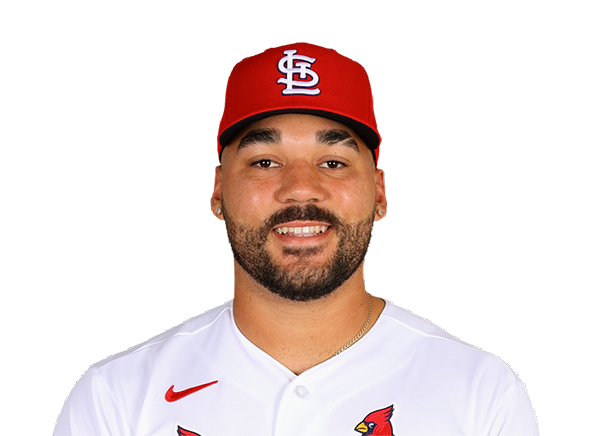 Leo Bernal | 0-3 | 3 | 0 | 0 | 0 | 0 | 1 | 1 | 16 | .281 | .361 | .406 |
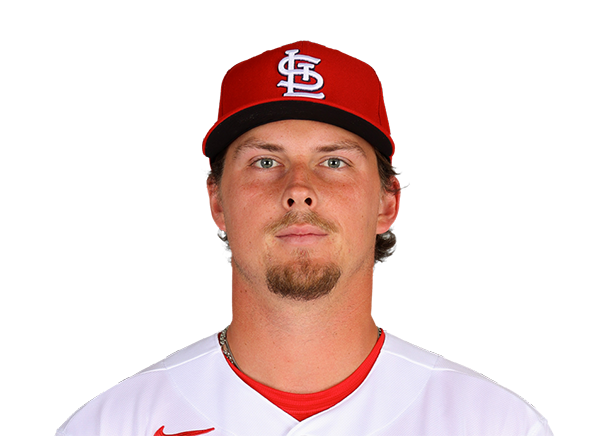 Nolan Gorman | 0-2 | 2 | 0 | 0 | 0 | 0 | 0 | 1 | 6 | .182 | .261 | .318 |
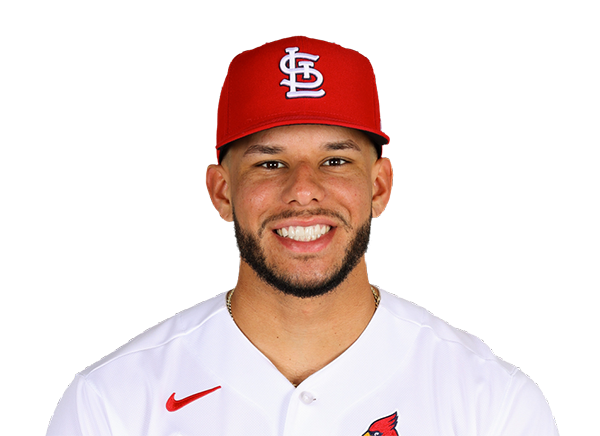 Joshua Baez | 0-2 | 2 | 0 | 0 | 0 | 0 | 0 | 0 | 10 | .238 | .295 | .550 |
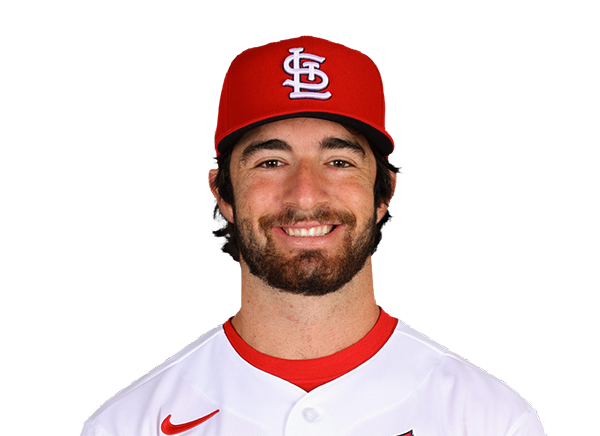 Thomas Saggese | 1-4 | 4 | 0 | 1 | 0 | 0 | 0 | 1 | 13 | .275 | .331 | .450 |
 Masyn Winn | 0-4 | 4 | 0 | 0 | 0 | 0 | 0 | 0 | 15 | .236 | .312 | .323 |
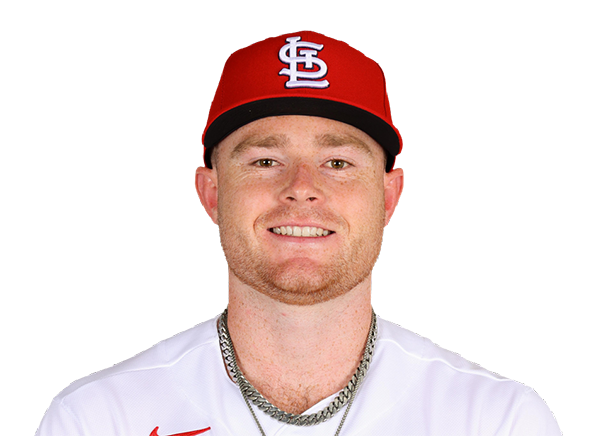 Nathan Church | 1-3 | 3 | 1 | 1 | 0 | 0 | 1 | 0 | 12 | .243 | .286 | .364 |
San Francisco Giants
| Player | H-AB | AB | R | H | RBI | HR | BB | K | #P | AVG | OBP | SLG |
|---|---|---|---|---|---|---|---|---|---|---|---|---|
 Jonah Cox | 0-3 | 3 | 0 | 0 | 0 | 0 | 0 | 0 | 10 | .278 | .316 | .478 |
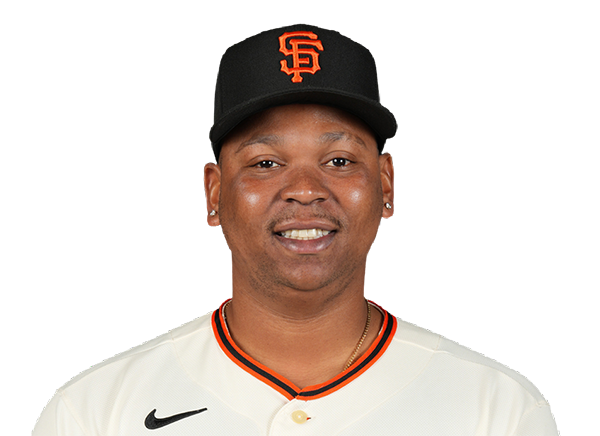 Rafael Devers | 0-4 | 4 | 0 | 0 | 0 | 0 | 0 | 1 | 15 | .258 | .340 | .518 |
 Bryce Eldridge | 1-3 | 3 | 1 | 1 | 1 | 1 | 1 | 2 | 24 | .265 | .361 | .458 |
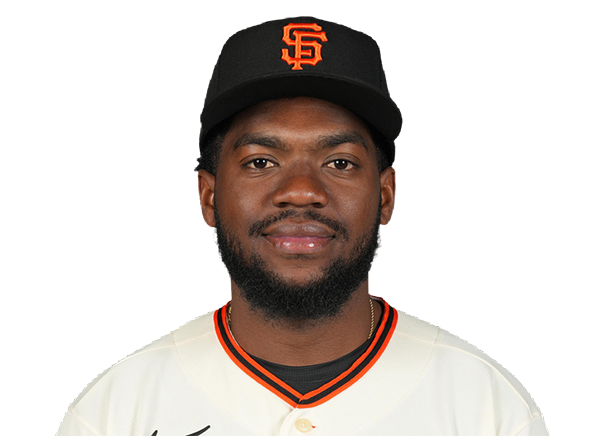 Osleivis Basabe | 0-2 | 2 | 0 | 0 | 0 | 0 | 1 | 1 | 14 | .207 | .258 | .360 |
 Jung Hoo Lee | 0-1 | 1 | 0 | 0 | 0 | 0 | 0 | 0 | 5 | .279 | .323 | .405 |
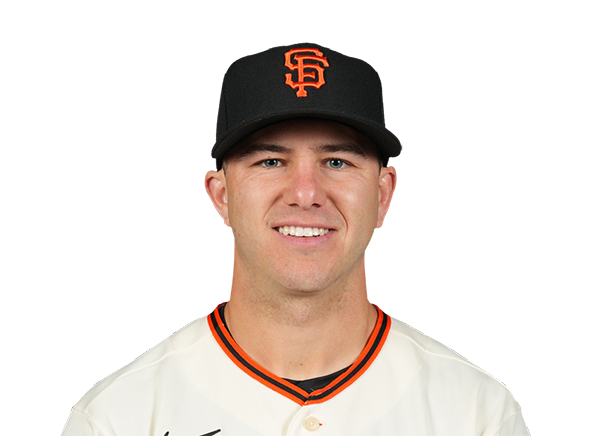 Nate Furman | 0-0 | 0 | 0 | 0 | 0 | 0 | 0 | 0 | 0 | .133 | .212 | .133 |
|
Turner Hill | 1-4 | 4 | 0 | 1 | 0 | 0 | 0 | 0 | 14 | .283 | .378 | .383 |
 Andrew Knizner | 0-4 | 4 | 0 | 0 | 0 | 0 | 0 | 1 | 16 | .146 | .222 | .268 |
 Shay Whitcomb | 1-4 | 4 | 0 | 1 | 0 | 0 | 0 | 0 | 13 | .157 | .192 | .314 |
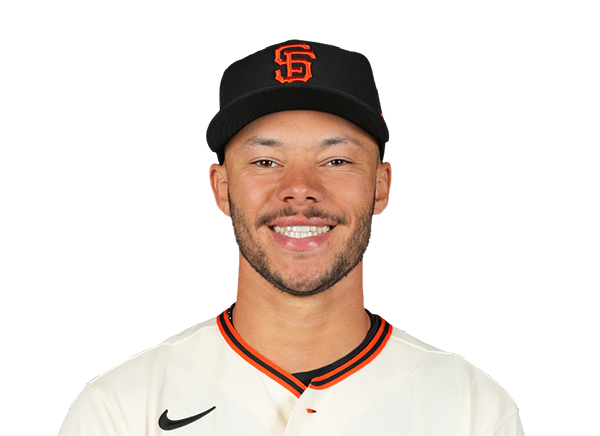 Grant McCray | 1-2 | 2 | 0 | 1 | 0 | 0 | 1 | 0 | 13 | .148 | .268 | .295 |
 Christian Koss | 2-3 | 3 | 1 | 2 | 1 | 1 | 0 | 1 | 7 | .219 | .263 | .331 |
St. Louis Cardinals
| Player | IP | H | R | ER | BB | K | HR | PC-ST | ERA | PC |
|---|---|---|---|---|---|---|---|---|---|---|
 Quinn Mathews | 6.0 | 5 | 2 | 2 | 2 | 4 | 2 | 99-62 | 4.11 | 99 |
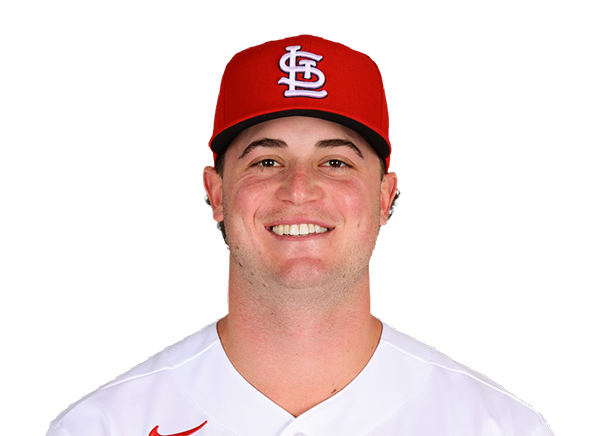 Gordon Graceffo | 2.0 | 1 | 0 | 0 | 1 | 2 | 0 | 32-20 | 2.70 | 32 |
San Francisco Giants
| Player | IP | H | R | ER | BB | K | HR | PC-ST | ERA | PC |
|---|---|---|---|---|---|---|---|---|---|---|
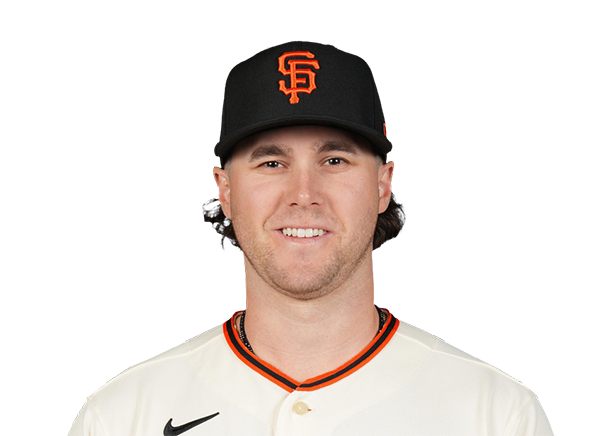 Landen Roupp | 6.0 | 2 | 0 | 0 | 4 | 2 | 0 | 81-47 | 4.00 | 81 |
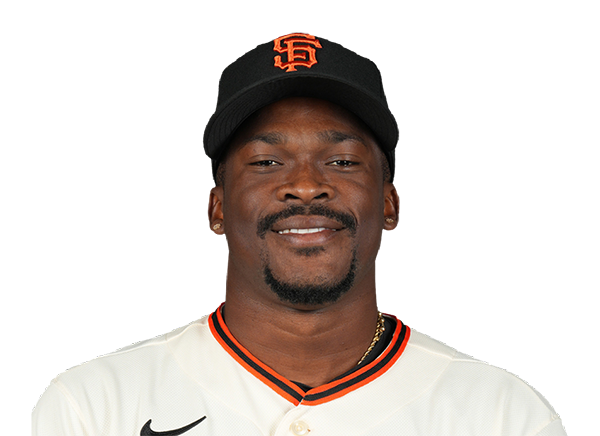 Reiver Sanmartin | 1.0 | 1 | 0 | 0 | 0 | 0 | 0 | 16-10 | 4.35 | 16 |
 Carson Seymour | 0.2 | 0 | 0 | 0 | 2 | 1 | 0 | 31-16 | 5.63 | 31 |
 Joel Kuhnel | 1.1 | 2 | 1 | 1 | 0 | 0 | 0 | 21-15 | 4.74 | 21 |
H2H / Season Series
SF2–1
STL
SF5–4
STL
Last 5 Games
| Date | Opponent | Result |
|---|---|---|
| Sep 8 | @ SF | L1–2 |
| Sep 7 | @ SF | L4–5 |
| Sep 6 |  @ COL | W10–8 |
| Sep 5 | @ COL | L7–10 |
| Sep 4 | @ COL | W7–6 |
| Date | Opponent | Result |
|---|---|---|
| Sep 8 | vs STL | W2–1 |
| Sep 7 | vs STL | W5–4 |
| Sep 6 |  @ NYM | L2–4 |
| Sep 5 | @ NYM | W9–5 |
| Sep 4 | @ NYM | L6–10 |
Standings
American League
| Team | W | L | PCT | GB | DIFF | STRK |
|---|---|---|---|---|---|---|
1 Rays | 86 | 58 | .597 | - | +53 | W1 |
2 White Sox | 75 | 69 | .521 | 11 | +43 | L1 |
3 Astros | 74 | 71 | .510 | 12.5 | -37 | W1 |
4 Yankees | 82 | 62 | .569 | 4 | +119 | W1 |
5 Red Sox | 80 | 66 | .548 | 7 | +84 | L1 |
6 Guardians | 74 | 72 | .507 | 13 | -12 | W1 |
7 Blue Jays | 73 | 73 | .500 | 14 | -37 | W1 |
8 Rangers | 72 | 73 | .497 | 14.5 | -39 | W2 |
9 Orioles | 70 | 76 | .479 | 17 | -31 | L1 |
10 Twins | 69 | 76 | .476 | 17.5 | -48 | W1 |
11 Mariners | 67 | 78 | .462 | 19.5 | -76 | L1 |
12 Tigers | 66 | 79 | .455 | 20.5 | +50 | L1 |
13 Royals | 64 | 82 | .438 | 23 | -91 | L2 |
14 Athletics | 58 | 88 | .397 | 29 | -189 | L1 |
15 Angels | 55 | 90 | .379 | 31.5 | -75 | W1 |
National League
| Team | W | L | PCT | GB | DIFF | STRK |
|---|---|---|---|---|---|---|
1 Brewers | 90 | 56 | .616 | - | +170 | W2 |
2 Dodgers | 88 | 57 | .607 | 1.5 | +156 | W6 |
3 Braves | 85 | 60 | .586 | 4.5 | +113 | L2 |
4 Phillies | 81 | 64 | .559 | 8.5 | +34 | L1 |
5 Cubs | 81 | 65 | .555 | 9 | +130 | L3 |
6 Diamondbacks | 78 | 68 | .534 | 12 | +2 | W4 |
7 Padres | 77 | 68 | .531 | 12.5 | +10 | W3 |
8 Pirates | 72 | 73 | .497 | 17.5 | +32 | W2 |
9 Marlins | 72 | 74 | .493 | 18 | +8 | L2 |
| 10Cardinals | 72 | 74 | .493 | 18 | -11 | L2 |
11 Reds | 69 | 76 | .476 | 20.5 | -109 | L2 |
| 12Mets | 67 | 78 | .462 | 22.5 | -41 | W3 |
13 Nationals | 67 | 80 | .456 | 23.5 | +7 | L6 |
| 14Giants | 61 | 85 | .418 | 29 | -73 | W2 |
| 15Rockies | 55 | 89 | .382 | 34 | -142 | L2 |
STL
VS
SF
Pitchers
Quinn Mathews
Catchers
Leo Bernal
Infielders
Alec Burleson
Nolan Gorman
Thomas Saggese
Masyn Winn
Outfielders
Bryan Torres
Jordan Walker
Nathan Church
Designated Hitters
Ivan Herrera
Pitchers
Landen Roupp
Catchers
Andrew Knizner
Infielders
Rafael Devers
Osleivis Basabe
Shay Whitcomb
Christian Koss
Outfielders
Jonah Cox
Turner Hill
Grant McCray
Designated Hitters
Bryce Eldridge
Cardinals
VS
Giants
Batting
146
Team Games Played
146
4936
At Bats
4946
1200
Hits
1224
643
Runs Batted In
589
155
Home Runs
166
94
Stolen Bases
68
.243
Batting Average
.247
662
Runs
610
208
Doubles
241
14
Triples
25
1901
Total Bases
2013
467
Walks
405
1151
Strikeouts
1168
.317
On Base Percentage
.309
.385
Slugging Percentage
.407
.702
OBP Pct + SLG Pct
.716
146
Games Played
146
146
Games Started
146
87
Hit By Pitch
50
0.0
Wins Above Replacement
0.0
0.0
Offensive Wins Above Replacement
0.0
25
Caught Stealing
21
1
Is Qualified
1
615.8
Runs Created
627.9
4.2
Runs Created Per 27 Outs
4.3
.084
Walks Per Plate Appearance
.074
0.41
Walk To Strikeout Ratio
0.35
.142
Isolated Power
.160
.251
Secondary Average
.251
3.86
Pitches Per Plate Appearance
3.85
377
Extra Base Hits
432
5561
Plate Appearances
5476
31.8
At Bats Per Home Run
29.8
19
Sacrifice Hit
34
50
Sacrifice Flies
41
Pitching
146
Team Games Played
146
49
Quality Starts
50
72
Wins
61
74
Losses
85
43
Saves
27
92
Holds
81
1259
Hits
1205
620
Earned runs
622
146
Home Runs
139
500
Walks
544
1151
Strikeouts
1094
8.0
Strikeouts Per 9 Innings
7.6
149.6
Pitches Per Start
148.2
1.35
Walks Plus Hits Per Inning Pitched
1.36
4.29
Earned Run Average
4.35
74
Losses
85
1301.2
Innings pitched
1288.0
.493
Win Percentage
.418
70
Save Opportunities
51
.254
Opponent Batting Average
.247
.328
Opponent's On-base pct.
.328
.400
Opponent's Slugging pct.
.387
.728
Opponent's OPB Pct + SLG Pct
.715
4953
At Bats
4873
257
Doubles
207
13
Triples
29
67
Batters Hit
62
102
Stolen Bases
120
146
Games Played
146
1
Complete Games
1
9
Shutouts
10
59
Wild Pitches
52
640
Runs Batted In
644
3
Balks
5
1301.2
Innings pitched
1288.0
8.0
Strikeouts Per 9 Innings
7.6
22
Caught Stealing
36
146
Games Started
146
0.0
Wins Above Replacement
0.0
1
Is Qualified
1
673
Runs
683
620
Earned Runs
622
1980
Total Bases
1887
Fielding
146
Team Games Played
146
1302
Full Innings
1288
5321
Total Chances
5328
3905
Putouts
3864
1353
Assists
1369
63
Errors
95
208
Double Plays
241
0.988
Fielding Percentage
0.982
36.4
Range Factor
36.6
0.0
Zone Rating
0.0
146
Games Played
146
0
Games Started
0
0.0
Defensive Wins Above Replacement
0.0
1
Qualified
1