

Cardinals vs Giants Live Score (9 Sep, 2026)
Game Information
Stage
STD
Season
2026
First Pitch
Wed, Sep 9, 3:45 pm
Venue
Oracle Park
Location
San Francisco, California
Venue Type
Outdoor
Broadcast
MLB.TV
Attendance
27,487
Live Situation
0Balls
0Strikes
0Outs
—Pitcher
—At Bat
Pitch Sequence
1
BALL IN PLAY
Sweeper
87 MPH
Injury Report
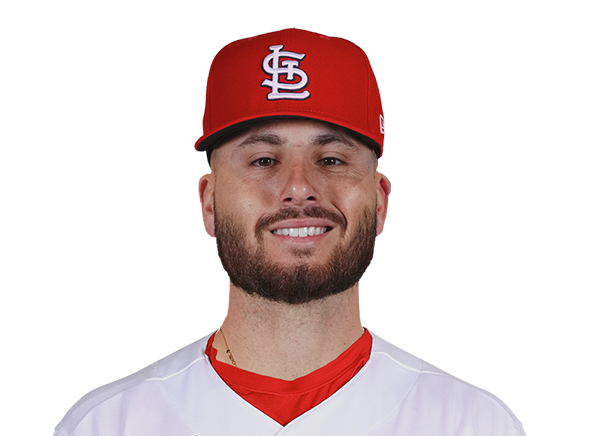
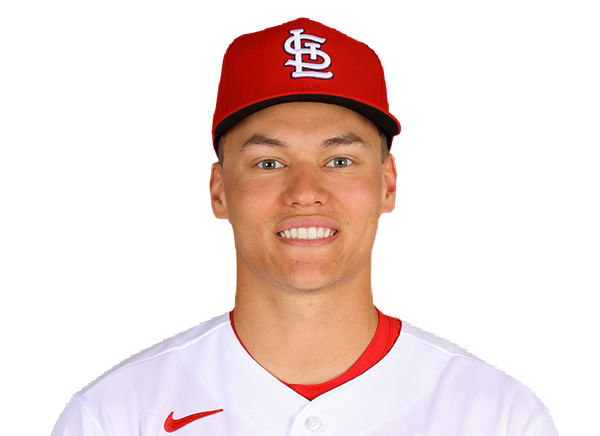

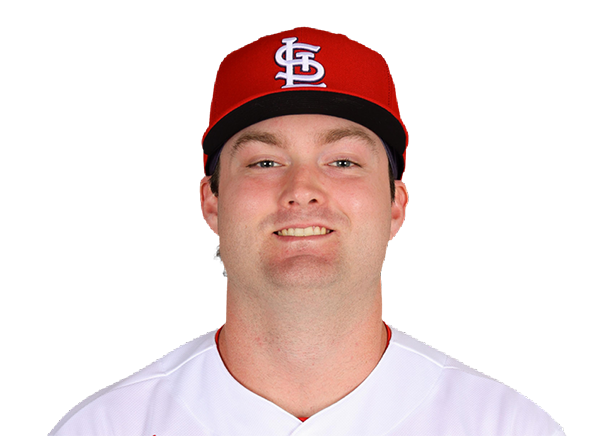
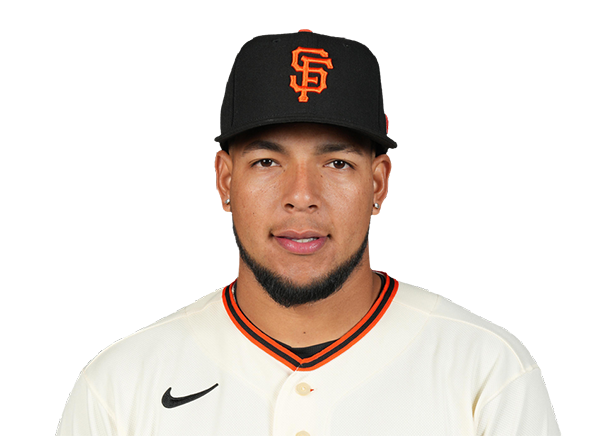

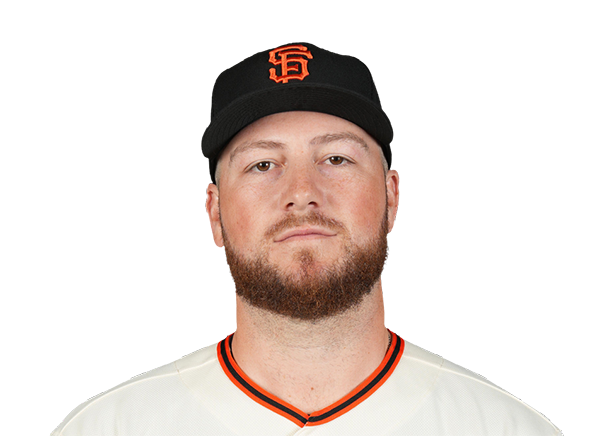
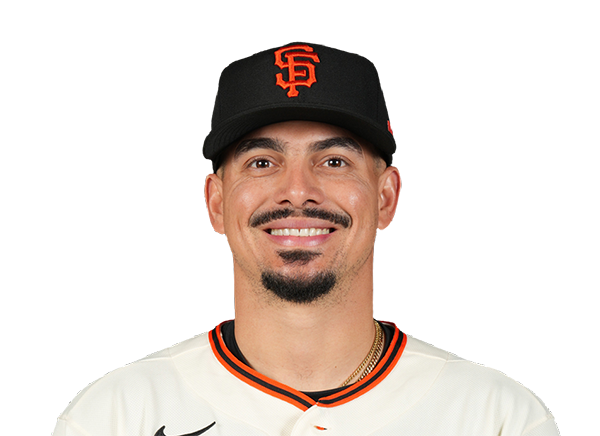
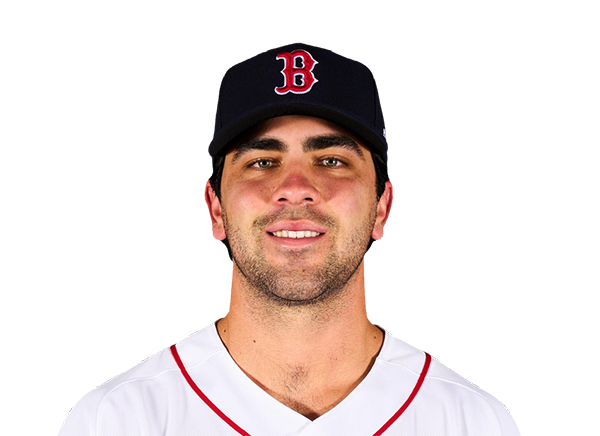
Team Stats
 STL
SF


6
Runs
7
8
Hits
10
0
Errors
3
1
Home Runs
0
3
Walks
1
5
Strikeouts
9
Player Box Score
St. Louis Cardinals
| Player | H-AB | AB | R | H | RBI | HR | BB | K | #P | AVG | OBP | SLG |
|---|---|---|---|---|---|---|---|---|---|---|---|---|
 Bryan Torres | 1-3 | 3 | 1 | 1 | 0 | 0 | 0 | 0 | 8 | .260 | .329 | .377 |
 Ramon Urias | 0-1 | 1 | 0 | 0 | 0 | 0 | 0 | 0 | 2 | .157 | .268 | .337 |
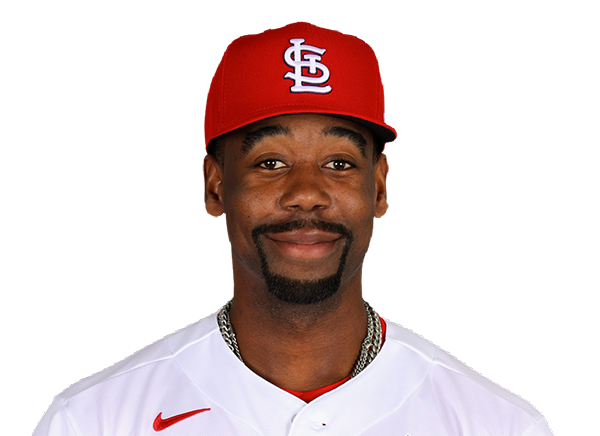 Jordan Walker | 0-1 | 1 | 0 | 0 | 0 | 0 | 0 | 0 | 3 | .281 | .337 | .489 |
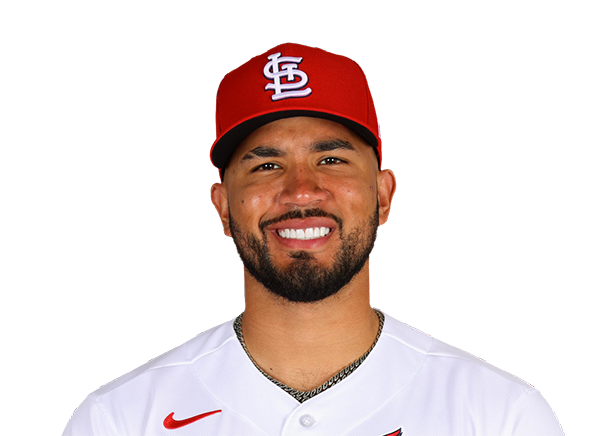 Ivan Herrera | 1-4 | 4 | 1 | 1 | 0 | 0 | 0 | 1 | 20 | .251 | .361 | .386 |
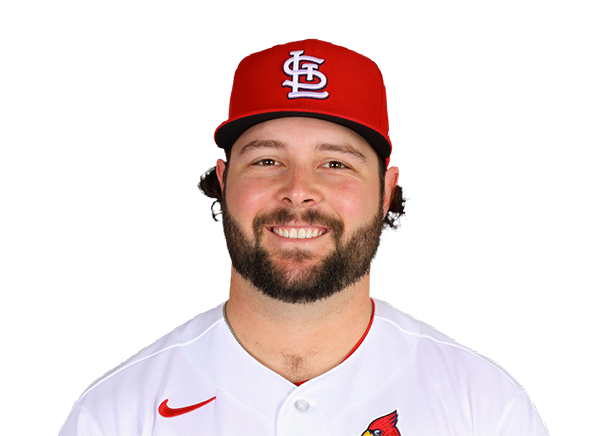 Alec Burleson | 0-2 | 2 | 1 | 0 | 0 | 0 | 2 | 0 | 17 | .283 | .350 | .467 |
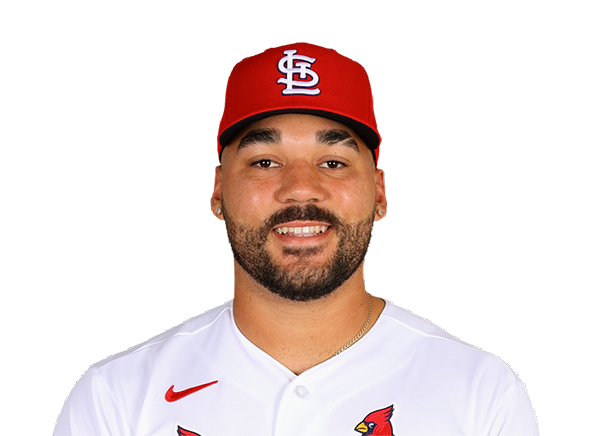 Leo Bernal | 1-4 | 4 | 1 | 1 | 3 | 1 | 0 | 0 | 10 | .278 | .350 | .472 |
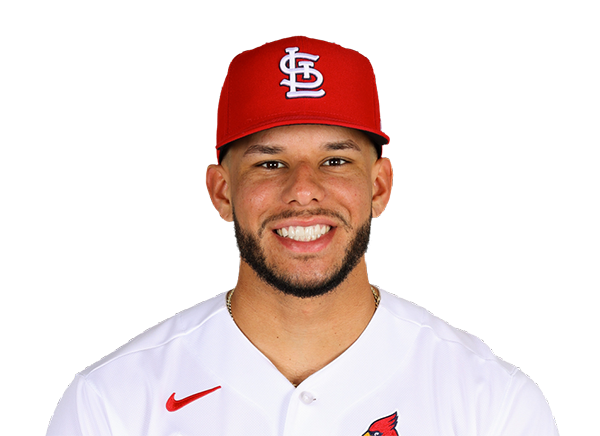 Joshua Baez | 1-4 | 4 | 1 | 1 | 0 | 0 | 0 | 1 | 17 | .238 | .293 | .548 |
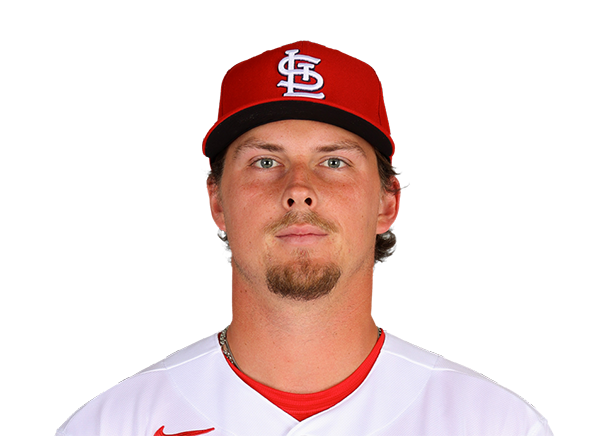 Nolan Gorman | 2-4 | 4 | 0 | 2 | 1 | 0 | 0 | 1 | 17 | .187 | .264 | .321 |
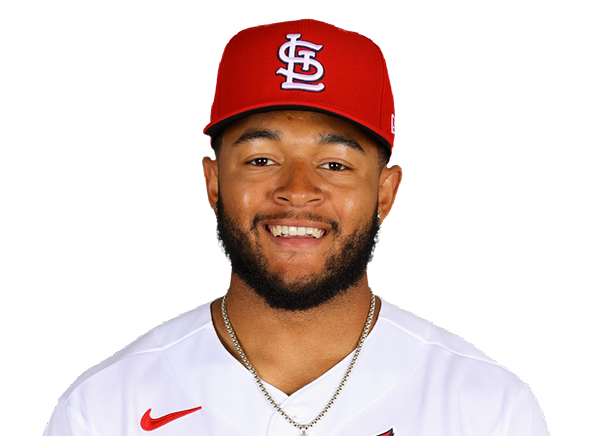 Victor Scott II | 0-0 | 0 | 0 | 0 | 0 | 0 | 0 | 0 | 0 | .197 | .278 | .261 |
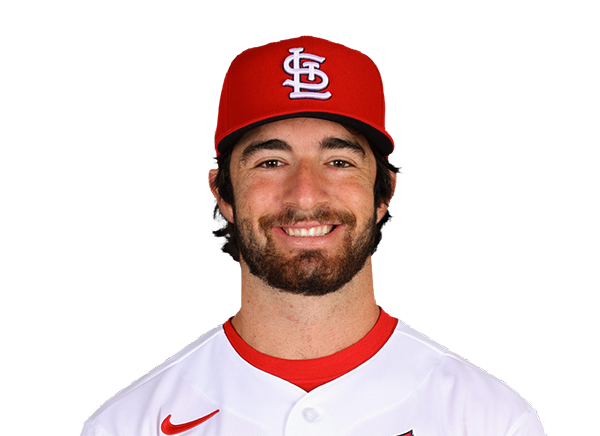 Thomas Saggese | 0-3 | 3 | 1 | 0 | 0 | 0 | 1 | 1 | 13 | .268 | .328 | .438 |
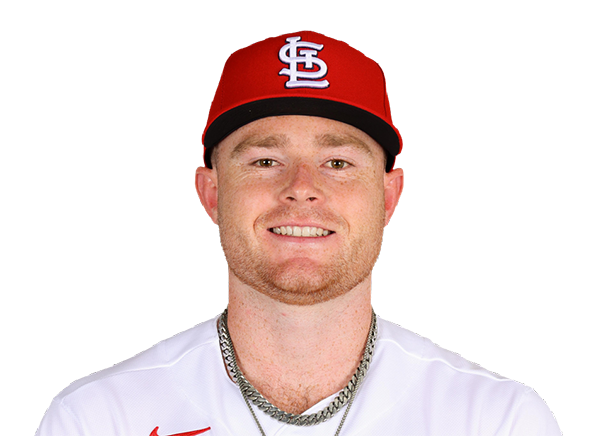 Nathan Church | 1-3 | 3 | 0 | 1 | 0 | 0 | 0 | 0 | 9 | .244 | .288 | .364 |
 Jose Fermin | 1-3 | 3 | 0 | 1 | 1 | 0 | 0 | 1 | 10 | .242 | .303 | .354 |
San Francisco Giants
| Player | H-AB | AB | R | H | RBI | HR | BB | K | #P | AVG | OBP | SLG |
|---|---|---|---|---|---|---|---|---|---|---|---|---|
 Drew Gilbert | 1-2 | 2 | 1 | 1 | 0 | 0 | 0 | 0 | 8 | .232 | .320 | .373 |
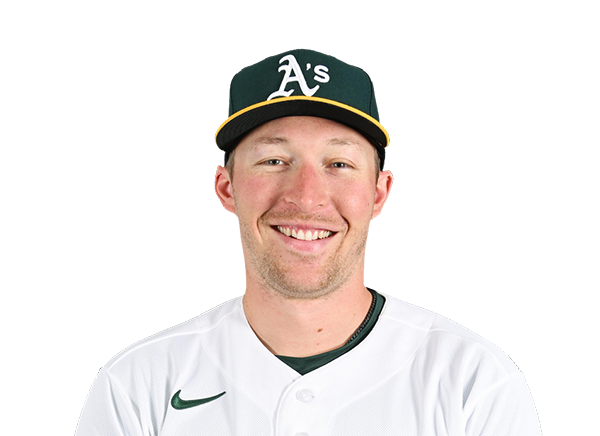 Brett Harris | 0-1 | 1 | 1 | 0 | 0 | 0 | 0 | 1 | 5 | .000 | .364 | .000 |
 Turner Hill | 0-3 | 3 | 1 | 0 | 0 | 0 | 1 | 2 | 22 | .270 | .372 | .365 |
 Bryce Eldridge | 2-4 | 4 | 1 | 2 | 3 | 0 | 0 | 1 | 14 | .268 | .362 | .459 |
|
Jonah Cox | 1-4 | 4 | 1 | 1 | 1 | 0 | 0 | 1 | 16 | .277 | .313 | .468 |
 Jung Hoo Lee | 2-4 | 4 | 1 | 2 | 2 | 0 | 0 | 0 | 27 | .281 | .324 | .408 |
 Shay Whitcomb | 1-4 | 4 | 0 | 1 | 1 | 0 | 0 | 0 | 14 | .162 | .195 | .324 |
|
Drew Cavanaugh | 1-4 | 4 | 1 | 1 | 0 | 0 | 0 | 1 | 24 | .244 | .326 | .268 |
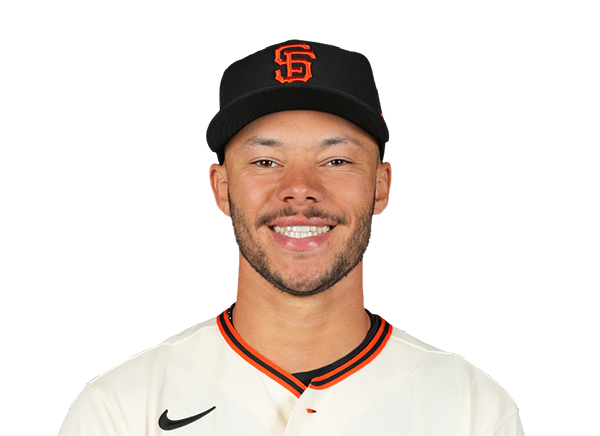 Grant McCray | 0-3 | 3 | 0 | 0 | 0 | 0 | 0 | 3 | 15 | .141 | .257 | .281 |
 Christian Koss | 2-3 | 3 | 0 | 2 | 0 | 0 | 0 | 0 | 10 | .227 | .270 | .338 |
St. Louis Cardinals
| Player | IP | H | R | ER | BB | K | HR | PC-ST | ERA | PC |
|---|---|---|---|---|---|---|---|---|---|---|
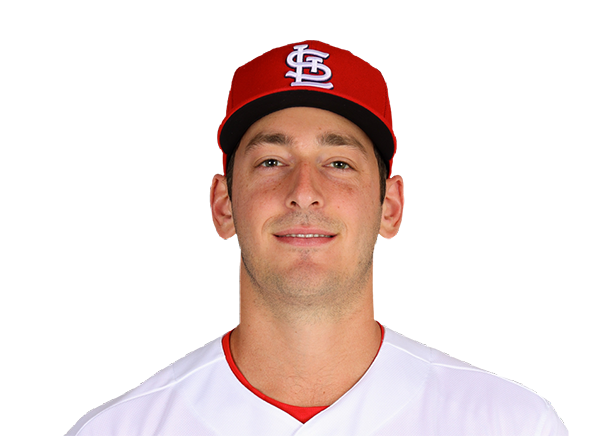 Andre Pallante | 5.0 | 5 | 1 | 1 | 0 | 4 | 0 | 88-54 | 3.45 | 88 |
 Justin Bruihl | 1.0 | 0 | 0 | 0 | 0 | 3 | 0 | 12-10 | 3.55 | 12 |
 Luis Gastelum | 1.0 | 0 | 0 | 0 | 0 | 1 | 0 | 12-8 | 4.85 | 12 |
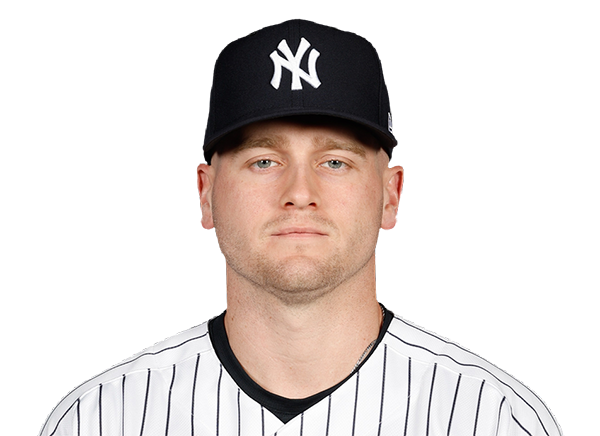 Cade Winquest | 0.2 | 2 | 4 | 4 | 1 | 1 | 0 | 23-11 | 6.75 | 23 |
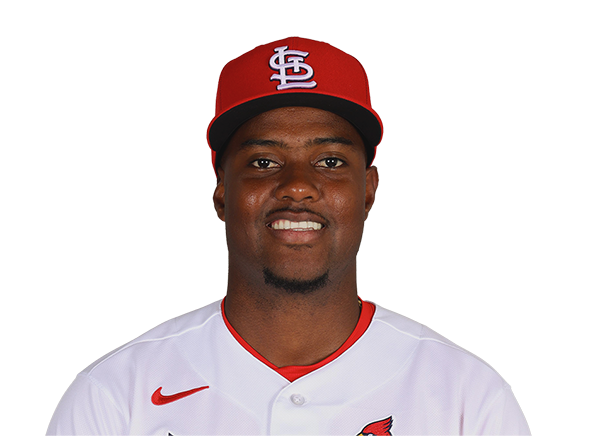 George Soriano | 0.1 | 3 | 2 | 2 | 0 | 0 | 0 | 20-15 | 4.50 | 20 |
San Francisco Giants
| Player | IP | H | R | ER | BB | K | HR | PC-ST | ERA | PC |
|---|---|---|---|---|---|---|---|---|---|---|
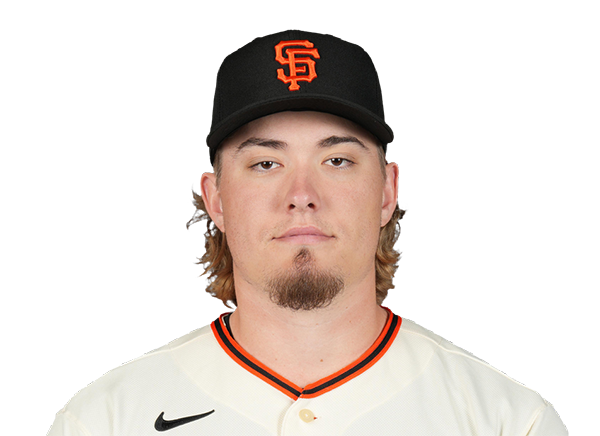 Blade Tidwell | 4.0 | 5 | 5 | 4 | 2 | 2 | 1 | 78-45 | 4.82 | 78 |
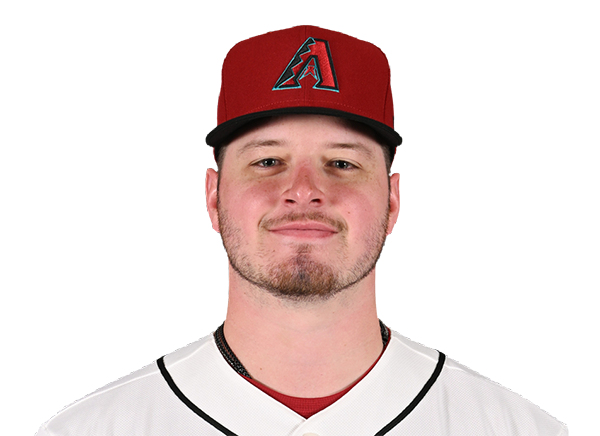 Philip Abner | 2.0 | 1 | 1 | 0 | 1 | 1 | 0 | 16-10 | 5.51 | 16 |
|
Matt Wilkinson | 2.0 | 1 | 0 | 0 | 0 | 2 | 0 | 26-19 | 5.40 | 26 |
 Trent Harris | 1.0 | 1 | 0 | 0 | 0 | 0 | 0 | 6-5 | 2.81 | 6 |
H2H / Season Series
SF7–6
STL
SF2–1
STL
SF5–4
STL
Last 5 Games
| Date | Opponent | Result |
|---|---|---|
| Sep 9 | @ SF | L6–7 |
| Sep 8 | @ SF | L1–2 |
| Sep 7 | @ SF | L4–5 |
| Sep 6 |  @ COL | W10–8 |
| Sep 5 | @ COL | L7–10 |
| Date | Opponent | Result |
|---|---|---|
| Sep 9 | vs STL | W7–6 |
| Sep 8 | vs STL | W2–1 |
| Sep 7 | vs STL | W5–4 |
| Sep 6 |  @ NYM | L2–4 |
| Sep 5 | @ NYM | W9–5 |
Standings
American League
| Team | W | L | PCT | GB | DIFF | STRK |
|---|---|---|---|---|---|---|
1 Rays | 87 | 58 | .600 | - | +58 | W2 |
2 White Sox | 75 | 70 | .517 | 12 | +41 | L2 |
3 Astros | 74 | 72 | .507 | 13.5 | -41 | L1 |
4 Yankees | 83 | 62 | .572 | 4 | +124 | W2 |
5 Red Sox | 80 | 67 | .544 | 8 | +82 | L2 |
6 Guardians | 74 | 73 | .503 | 14 | -16 | L1 |
7 Blue Jays | 73 | 74 | .497 | 15 | -39 | L1 |
8 Rangers | 72 | 74 | .493 | 15.5 | -40 | L1 |
9 Orioles | 71 | 76 | .483 | 17 | -27 | W1 |
10 Twins | 69 | 77 | .473 | 18.5 | -53 | L1 |
11 Mariners | 68 | 78 | .466 | 19.5 | -75 | W1 |
12 Tigers | 67 | 79 | .459 | 20.5 | +55 | W1 |
13 Royals | 65 | 82 | .442 | 23 | -88 | W1 |
14 Athletics | 59 | 88 | .401 | 29 | -187 | W1 |
15 Angels | 56 | 90 | .384 | 31.5 | -73 | W2 |
National League
| Team | W | L | PCT | GB | DIFF | STRK |
|---|---|---|---|---|---|---|
1 Brewers | 91 | 56 | .619 | - | +172 | W3 |
2 Dodgers | 89 | 57 | .610 | 1.5 | +169 | W7 |
3 Braves | 85 | 61 | .582 | 5.5 | +108 | L3 |
4 Phillies | 82 | 64 | .562 | 8.5 | +38 | W1 |
5 Cubs | 81 | 66 | .551 | 10 | +128 | L4 |
6 Padres | 78 | 68 | .534 | 12.5 | +17 | W4 |
7 Diamondbacks | 78 | 69 | .531 | 13 | -1 | L1 |
8 Pirates | 73 | 73 | .500 | 17.5 | +34 | W3 |
9 Marlins | 72 | 75 | .490 | 19 | +7 | L3 |
| 10Cardinals | 72 | 75 | .490 | 19 | -12 | L3 |
11 Reds | 69 | 77 | .473 | 21.5 | -122 | L3 |
| 12Mets | 68 | 78 | .466 | 22.5 | -40 | W4 |
13 Nationals | 67 | 81 | .453 | 24.5 | 0 | L7 |
| 14Giants | 62 | 85 | .422 | 29 | -72 | W3 |
| 15Rockies | 55 | 90 | .379 | 35 | -147 | L3 |
STL
VS
SF
Pitchers
Andre Pallante
Catchers
Leo Bernal
Infielders
Alec Burleson
Nolan Gorman
Thomas Saggese

Masyn Winn
Outfielders
Bryan Torres
Joshua Baez
Nathan Church
Designated Hitters
Ivan Herrera
Pitchers
Blade Tidwell
Catchers
Drew Cavanaugh
Infielders
Bryce Eldridge
Jonah Cox
Shay Whitcomb
Christian Koss
Outfielders
Drew Gilbert
Jung Hoo Lee
Grant McCray
Designated Hitters
Turner Hill
Cardinals
VS
Giants
Batting
147
Team Games Played
147
4968
At Bats
4978
1208
Hits
1234
648
Runs Batted In
596
156
Home Runs
166
95
Stolen Bases
69
.243
Batting Average
.248
668
Runs
617
209
Doubles
244
14
Triples
25
1913
Total Bases
2026
470
Walks
406
1156
Strikeouts
1177
.317
On Base Percentage
.309
.385
Slugging Percentage
.407
.702
OBP Pct + SLG Pct
.716
147
Games Played
147
147
Games Started
147
89
Hit By Pitch
51
0.0
Wins Above Replacement
0.0
0.0
Offensive Wins Above Replacement
0.0
25
Caught Stealing
22
1
Is Qualified
1
619.9
Runs Created
632.0
4.2
Runs Created Per 27 Outs
4.3
.084
Walks Per Plate Appearance
.074
0.41
Walk To Strikeout Ratio
0.34
.142
Isolated Power
.159
.251
Secondary Average
.250
3.86
Pitches Per Plate Appearance
3.85
379
Extra Base Hits
435
5599
Plate Appearances
5510
31.8
At Bats Per Home Run
30.0
19
Sacrifice Hit
34
51
Sacrifice Flies
41
Pitching
147
Team Games Played
147
49
Quality Starts
50
72
Wins
62
75
Losses
85
43
Saves
28
92
Holds
81
1269
Hits
1213
627
Earned runs
626
146
Home Runs
140
501
Walks
547
1160
Strikeouts
1099
8.0
Strikeouts Per 9 Innings
7.6
149.6
Pitches Per Start
148.0
1.35
Walks Plus Hits Per Inning Pitched
1.36
4.31
Earned Run Average
4.34
75
Losses
85
1309.2
Innings pitched
1297.0
.490
Win Percentage
.422
71
Save Opportunities
52
.255
Opponent Batting Average
.247
.328
Opponent's On-base pct.
.328
.400
Opponent's Slugging pct.
.387
.728
Opponent's OPB Pct + SLG Pct
.715
4985
At Bats
4905
260
Doubles
208
13
Triples
29
68
Batters Hit
64
103
Stolen Bases
121
147
Games Played
147
1
Complete Games
1
9
Shutouts
10
59
Wild Pitches
52
647
Runs Batted In
649
3
Balks
5
1309.2
Innings pitched
1297.0
8.0
Strikeouts Per 9 Innings
7.6
23
Caught Stealing
36
147
Games Started
147
0.0
Wins Above Replacement
0.0
1
Is Qualified
1
680
Runs
689
627
Earned Runs
626
1993
Total Bases
1899
Fielding
147
Team Games Played
147
1310
Full Innings
1297
5355
Total Chances
5371
3929
Putouts
3891
1363
Assists
1382
63
Errors
98
209
Double Plays
244
0.988
Fielding Percentage
0.982
36.4
Range Factor
36.6
0.0
Zone Rating
0.0
147
Games Played
147
0
Games Started
0
0.0
Defensive Wins Above Replacement
0.0
1
Qualified
1