

Cardinals vs Pirates Live Score (22 Sep, 2026)
Game Information
Stage
STD
Season
2026
First Pitch
Tue, Sep 22, 6:40 pm
Venue
PNC Park
Location
Pittsburgh, Pennsylvania
Venue Type
Outdoor
Broadcast
MLB.TV
Attendance
11,375
Live Situation
0Balls
0Strikes
0Outs
—Pitcher
—At Bat
Pitch Sequence
1
BALL IN PLAY
Sinker
98 MPH
Injury Report





Team Stats
 STL
PIT


0
Runs
2
1
Hits
5
1
Errors
0
0
Home Runs
0
2
Walks
3
14
Strikeouts
4
Player Box Score
St. Louis Cardinals
| Player | H-AB | AB | R | H | RBI | HR | BB | K | #P | AVG | OBP | SLG |
|---|---|---|---|---|---|---|---|---|---|---|---|---|
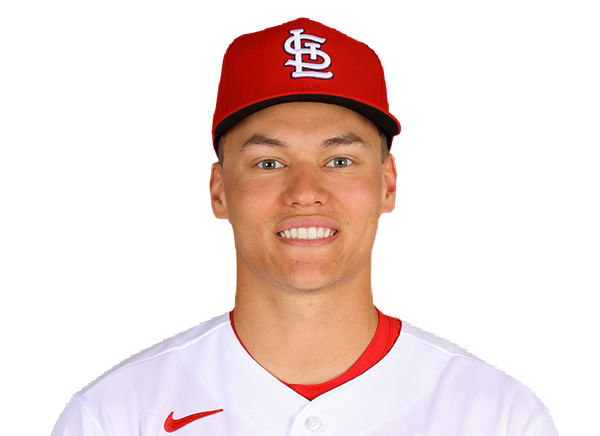 JJ Wetherholt | 0-4 | 4 | 0 | 0 | 0 | 0 | 0 | 3 | 19 | .240 | .339 | .365 |
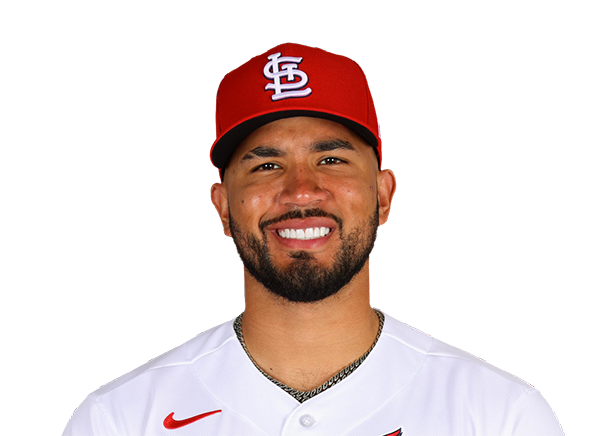 Ivan Herrera | 0-4 | 4 | 0 | 0 | 0 | 0 | 0 | 4 | 19 | .245 | .356 | .385 |
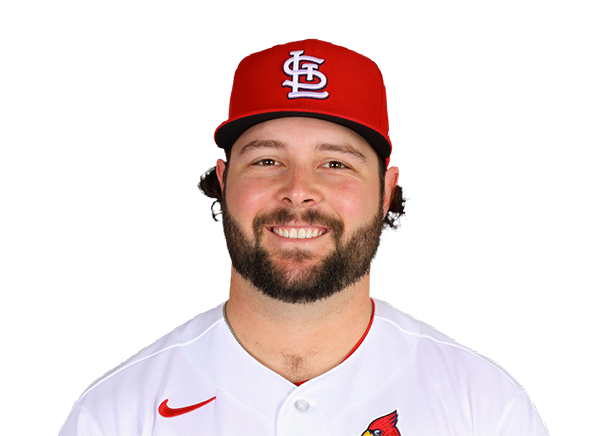 Alec Burleson | 0-4 | 4 | 0 | 0 | 0 | 0 | 0 | 0 | 10 | .280 | .345 | .463 |
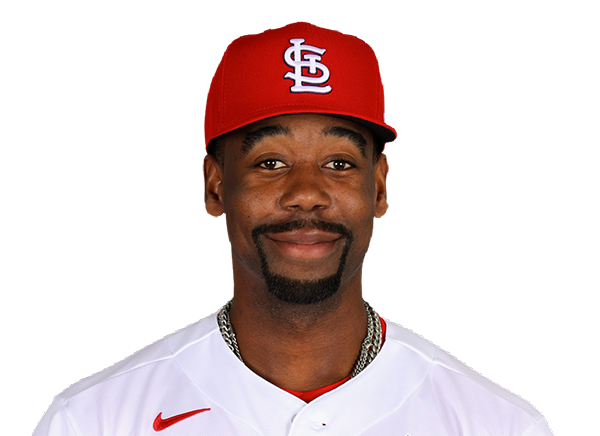 Jordan Walker | 0-3 | 3 | 0 | 0 | 0 | 0 | 0 | 0 | 5 | .273 | .331 | .471 |
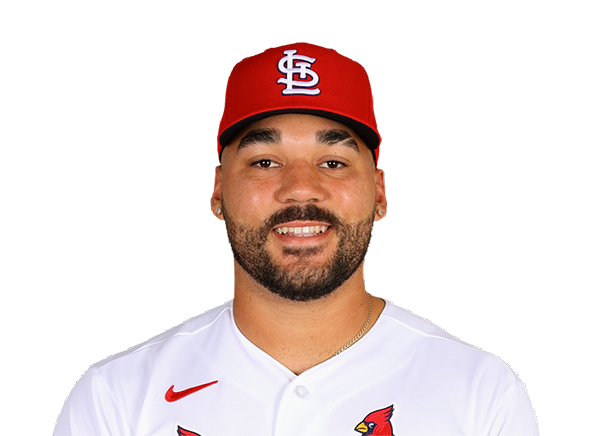 Leo Bernal | 0-3 | 3 | 0 | 0 | 0 | 0 | 0 | 2 | 14 | .299 | .341 | .494 |
 Bryan Torres | 0-3 | 3 | 0 | 0 | 0 | 0 | 0 | 2 | 15 | .235 | .308 | .340 |
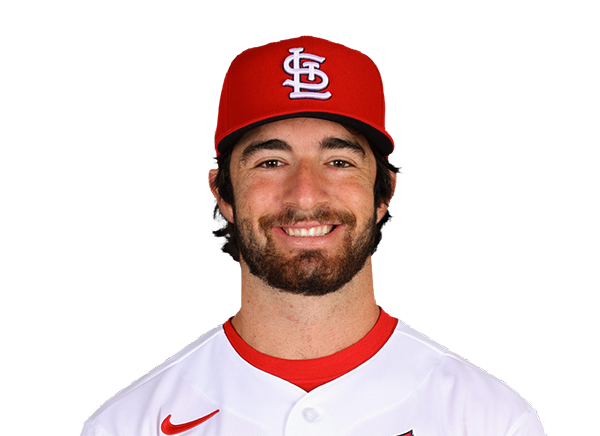 Thomas Saggese | 0-2 | 2 | 0 | 0 | 0 | 0 | 1 | 1 | 17 | .243 | .303 | .372 |
 Nathan Church | 1-3 | 3 | 0 | 1 | 0 | 0 | 0 | 1 | 11 | .253 | .297 | .375 |
 Masyn Winn | 0-2 | 2 | 0 | 0 | 0 | 0 | 1 | 1 | 15 | .234 | .309 | .319 |
Pittsburgh Pirates
| Player | H-AB | AB | R | H | RBI | HR | BB | K | #P | AVG | OBP | SLG |
|---|---|---|---|---|---|---|---|---|---|---|---|---|
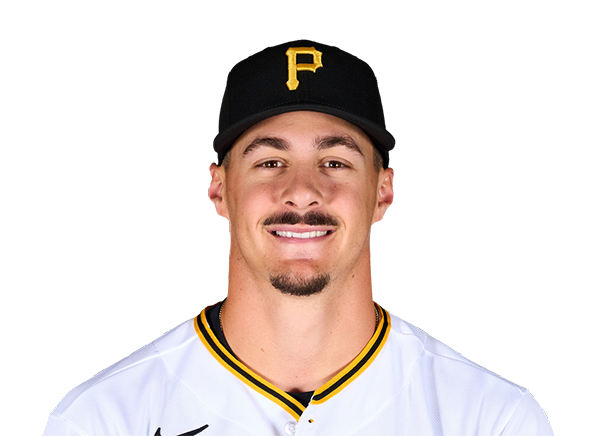 Konnor Griffin | 2-4 | 4 | 0 | 2 | 0 | 0 | 0 | 1 | 20 | .271 | .324 | .397 |
 Brandon Lowe | 0-4 | 4 | 0 | 0 | 0 | 0 | 0 | 0 | 12 | .260 | .330 | .489 |
 Bryan Reynolds | 1-3 | 3 | 0 | 1 | 0 | 0 | 0 | 0 | 10 | .262 | .365 | .425 |
 Oneil Cruz | 0-3 | 3 | 1 | 0 | 0 | 0 | 1 | 1 | 19 | .278 | .366 | .486 |
 Rafael Flores Jr. | 0-3 | 3 | 0 | 0 | 0 | 0 | 1 | 1 | 18 | .279 | .351 | .544 |
 Ryan O'Hearn | 1-4 | 4 | 0 | 1 | 1 | 0 | 0 | 1 | 18 | .264 | .330 | .441 |
 Ronny Simon | 0-3 | 3 | 0 | 0 | 0 | 0 | 0 | 0 | 13 | .294 | .333 | .412 |
 Billy Cook | 0-0 | 0 | 0 | 0 | 0 | 0 | 0 | 0 | 0 | .176 | .208 | .235 |
 Spencer Horwitz | 1-2 | 2 | 1 | 1 | 0 | 0 | 1 | 0 | 8 | .249 | .349 | .370 |
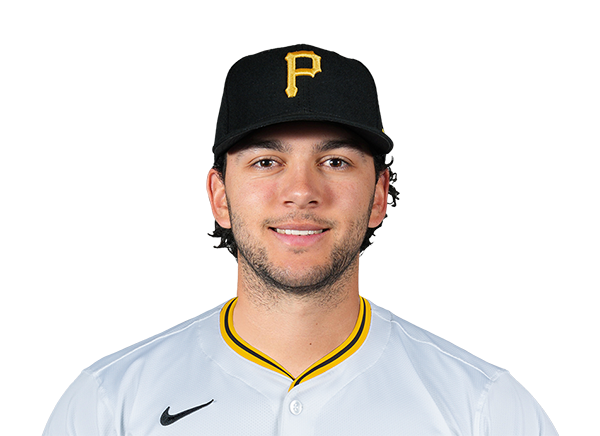 Jacob Gonzalez | 0-2 | 2 | 0 | 0 | 0 | 0 | 0 | 0 | 6 | .221 | .273 | .353 |
 Jared Triolo | 0-1 | 1 | 0 | 0 | 0 | 0 | 0 | 0 | 6 | .240 | .311 | .306 |
St. Louis Cardinals
| Player | IP | H | R | ER | BB | K | HR | PC-ST | ERA | PC |
|---|---|---|---|---|---|---|---|---|---|---|
 Andre Pallante | 6.0 | 3 | 1 | 1 | 2 | 2 | 0 | 89-58 | 3.61 | 89 |
 Justin Bruihl | 0.2 | 1 | 1 | 1 | 1 | 0 | 0 | 19-9 | 3.69 | 19 |
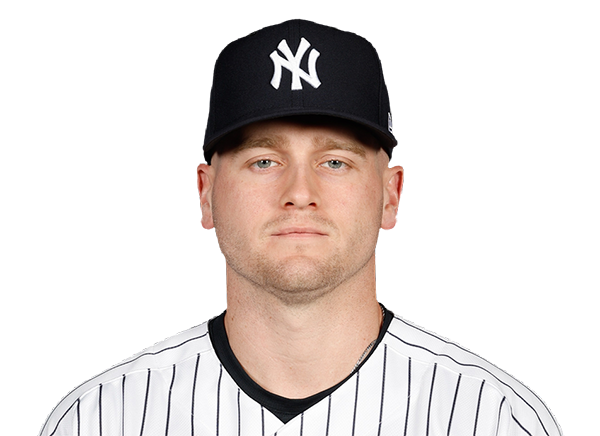 Cade Winquest | 1.1 | 1 | 0 | 0 | 0 | 2 | 0 | 22-15 | 4.63 | 22 |
Pittsburgh Pirates
| Player | IP | H | R | ER | BB | K | HR | PC-ST | ERA | PC |
|---|---|---|---|---|---|---|---|---|---|---|
 Jared Jones | 7.0 | 1 | 0 | 0 | 0 | 9 | 0 | 86-63 | 3.87 | 86 |
 Luke Weaver | 1.0 | 0 | 0 | 0 | 1 | 3 | 0 | 21-14 | 2.75 | 21 |
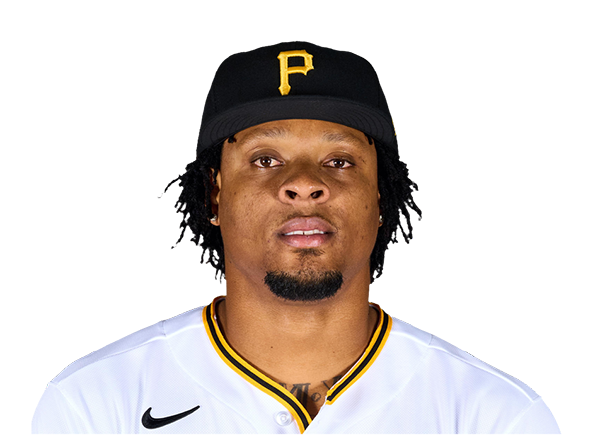 Gregory Soto | 1.0 | 0 | 0 | 0 | 1 | 2 | 0 | 18-8 | 3.72 | 18 |
H2H / Season Series
PIT2–0
STL
STL4–5
PIT
STL2–6
PIT
STL4–1
PIT
STL2–6
PIT
STL0–7
PIT
STL9–6
PIT
PIT5–10
STL
PIT4–5
STL
PIT7–11
STL
Last 5 Games
| Date | Opponent | Result |
|---|---|---|
| Sep 22 | @ PIT | L0–2 |
| Sep 20 |  vs WSH | W5–3 |
| Sep 19 | vs WSH | L5–8 |
| Sep 18 | vs WSH | L1–9 |
| Sep 16 |  vs SF | L5–6 |
| Date | Opponent | Result |
|---|---|---|
| Sep 22 | vs STL | W2–0 |
| Sep 20 |  vs KC | W4–3 |
| Sep 19 | vs KC | W6–5 |
| Sep 18 | vs KC | W8–5 |
| Sep 17 |  vs MIL | W7–4 |
Standings
American League
| Team | W | L | PCT | GB | DIFF | STRK |
|---|---|---|---|---|---|---|
1 Rays | 96 | 61 | .611 | - | +86 | W1 |
2 Guardians | 82 | 75 | .522 | 14 | +3 | W6 |
3 Astros | 78 | 79 | .497 | 18 | -52 | W1 |
4 Yankees | 90 | 67 | .573 | 6 | +134 | L1 |
5 Red Sox | 84 | 73 | .535 | 12 | +79 | L3 |
6 White Sox | 81 | 76 | .516 | 15 | +45 | W3 |
7 Rangers | 78 | 79 | .497 | 18 | -37 | L2 |
8 Blue Jays | 77 | 80 | .490 | 19 | -43 | L1 |
9 Orioles | 76 | 81 | .484 | 20 | -30 | W1 |
10 Twins | 74 | 84 | .468 | 22.5 | -66 | W1 |
11 Tigers | 74 | 84 | .468 | 22.5 | +73 | L1 |
12 Mariners | 73 | 84 | .465 | 23 | -63 | L1 |
| 13Royals | 67 | 90 | .427 | 29 | -105 | L5 |
14 Athletics | 62 | 95 | .395 | 34 | -221 | W1 |
15 Angels | 60 | 97 | .382 | 36 | -89 | L2 |
National League
| Team | W | L | PCT | GB | DIFF | STRK |
|---|---|---|---|---|---|---|
| 1Brewers | 98 | 59 | .624 | - | +200 | L1 |
2 Dodgers | 97 | 60 | .618 | 1 | +200 | W5 |
3 Braves | 92 | 65 | .586 | 6 | +116 | L1 |
4 Phillies | 87 | 70 | .554 | 11 | +31 | W2 |
5 Cubs | 87 | 70 | .554 | 11 | +146 | L1 |
6 Padres | 87 | 70 | .554 | 11 | +34 | L1 |
7 Diamondbacks | 83 | 74 | .529 | 15 | +4 | W3 |
| 8Pirates | 80 | 77 | .510 | 18 | +31 | W5 |
9 Marlins | 77 | 80 | .490 | 21 | +3 | W1 |
| 10Cardinals | 76 | 81 | .484 | 22 | -25 | L1 |
| 11Nationals | 74 | 84 | .468 | 24.5 | +7 | W1 |
12 Reds | 73 | 84 | .465 | 25 | -159 | W1 |
13 Mets | 72 | 85 | .459 | 26 | -38 | W1 |
| 14Giants | 65 | 93 | .411 | 33.5 | -82 | L1 |
15 Rockies | 57 | 100 | .363 | 41 | -182 | L2 |
STL
VS
PIT
Pitchers
Andre Pallante
Catchers
Leo Bernal
Infielders
JJ Wetherholt
Alec Burleson
Thomas Saggese
Masyn Winn
Outfielders
Jordan Walker
Bryan Torres
Nathan Church
Designated Hitters
Ivan Herrera
Pitchers
Jared Jones
Catchers
Rafael Flores Jr.
Infielders
Konnor Griffin
Brandon Lowe
Spencer Horwitz
Jacob Gonzalez
Outfielders
Bryan Reynolds
Oneil Cruz
Ronny Simon
Designated Hitters
Ryan O'Hearn
Cardinals
VS
Pirates
Batting
157
Team Games Played
157
5300
At Bats
5388
1278
Hits
1368
681
Runs Batted In
716
161
Home Runs
181
97
Stolen Bases
129
.241
Batting Average
.254
704
Runs
750
226
Doubles
240
14
Triples
16
2015
Total Bases
2183
498
Walks
554
1248
Strikeouts
1456
.314
On Base Percentage
.331
.380
Slugging Percentage
.405
.695
OBP Pct + SLG Pct
.736
157
Games Played
157
157
Games Started
157
93
Hit By Pitch
84
0.0
Wins Above Replacement
0.0
0.0
Offensive Wins Above Replacement
0.0
25
Caught Stealing
28
1
Is Qualified
1
647.8
Runs Created
737.7
4.1
Runs Created Per 27 Outs
4.7
.083
Walks Per Plate Appearance
.091
0.40
Walk To Strikeout Ratio
0.38
.139
Isolated Power
.151
.247
Secondary Average
.273
3.87
Pitches Per Plate Appearance
3.91
401
Extra Base Hits
437
5967
Plate Appearances
6075
32.9
At Bats Per Home Run
29.8
19
Sacrifice Hit
12
55
Sacrifice Flies
32
Pitching
157
Team Games Played
157
54
Quality Starts
46
76
Wins
80
81
Losses
77
46
Saves
39
95
Holds
75
1350
Hits
1253
667
Earned runs
648
155
Home Runs
150
547
Walks
565
1239
Strikeouts
1443
8.0
Strikeouts Per 9 Innings
9.3
150.0
Pitches Per Start
149.7
1.35
Walks Plus Hits Per Inning Pitched
1.30
4.28
Earned Run Average
4.16
81
Losses
77
1401.2
Innings pitched
1401.1
.484
Win Percentage
.510
76
Save Opportunities
64
.253
Opponent Batting Average
.237
.329
Opponent's On-base pct.
.318
.398
Opponent's Slugging pct.
.381
.727
Opponent's OPB Pct + SLG Pct
.699
5327
At Bats
5289
276
Doubles
280
15
Triples
15
74
Batters Hit
85
116
Stolen Bases
98
157
Games Played
157
1
Complete Games
1
9
Shutouts
12
61
Wild Pitches
52
691
Runs Batted In
676
3
Balks
6
1401.2
Innings pitched
1401.1
8.0
Strikeouts Per 9 Innings
9.3
28
Caught Stealing
31
157
Games Started
157
0.0
Wins Above Replacement
0.0
1
Is Qualified
1
729
Runs
719
667
Earned Runs
648
2121
Total Bases
2013
Fielding
157
Team Games Played
157
1402
Full Innings
1401
5752
Total Chances
5540
4205
Putouts
4204
1473
Assists
1241
74
Errors
95
226
Double Plays
240
0.987
Fielding Percentage
0.983
36.5
Range Factor
35.0
0.0
Zone Rating
0.0
157
Games Played
157
0
Games Started
0
0.0
Defensive Wins Above Replacement
0.0
1
Qualified
1