

Cardinals vs Pirates Live Score (23 Sep, 2026)
Game Information
Stage
STD
Season
2026
First Pitch
Wed, Sep 23, 6:40 pm
Venue
PNC Park
Location
Pittsburgh, Pennsylvania
Venue Type
Outdoor
Broadcast
MLB.TV
Attendance
13,176
Live Situation
0Balls
3Strikes
0Outs
—Pitcher
—At Bat
Pitch Sequence
1
STRIKE FOUL
Four-seam FB
96 MPH
2
STRIKE FOUL
Four-seam FB
97 MPH
3
STRIKE FOUL
Changeup
91 MPH
4
STRIKE FOUL
Four-seam FB
96 MPH
5
STRIKE FOUL
Slider
90 MPH
6
STRIKE SWINGING
Changeup
91 MPH
Injury Report


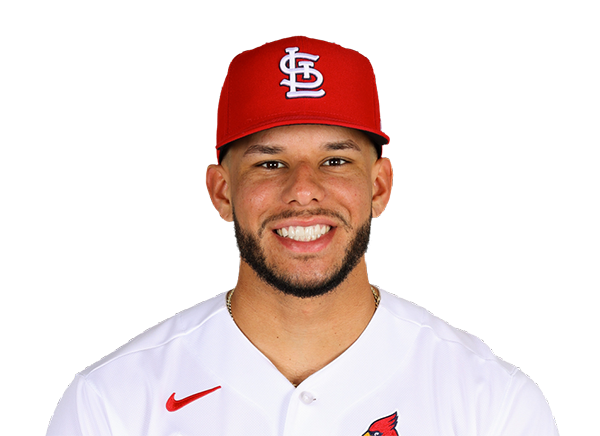
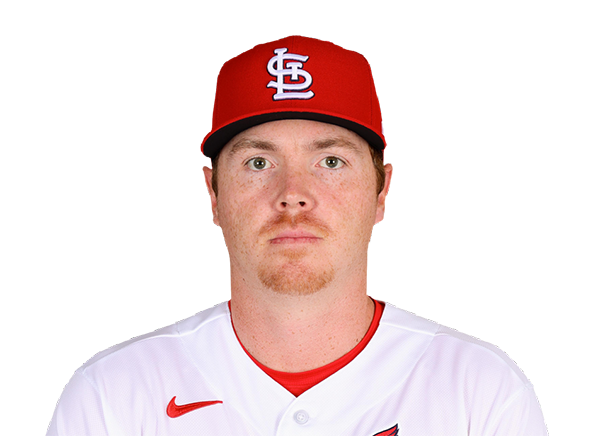

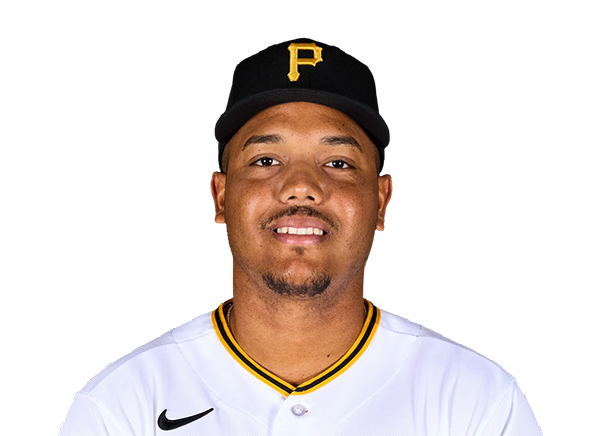



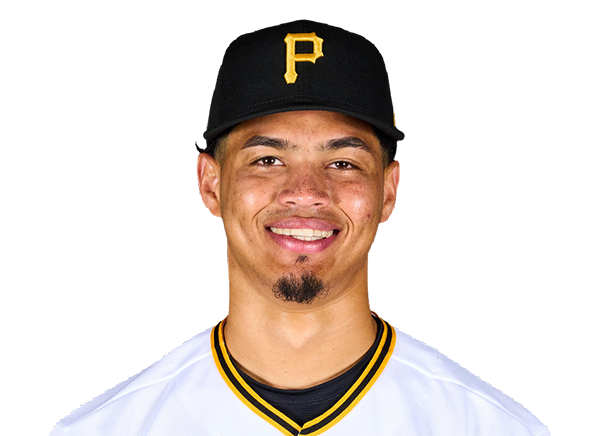
Team Stats
 STL
PIT


5
Runs
1
10
Hits
6
0
Errors
0
0
Home Runs
1
4
Walks
1
10
Strikeouts
9
Player Box Score
St. Louis Cardinals
| Player | H-AB | AB | R | H | RBI | HR | BB | K | #P | AVG | OBP | SLG |
|---|---|---|---|---|---|---|---|---|---|---|---|---|
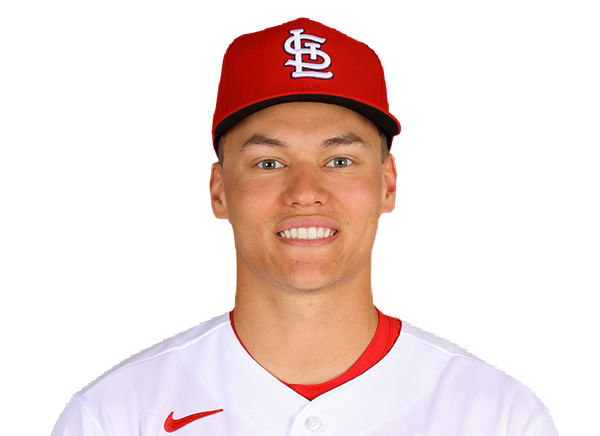 JJ Wetherholt | 3-4 | 4 | 1 | 3 | 1 | 0 | 1 | 1 | 19 | .244 | .343 | .368 |
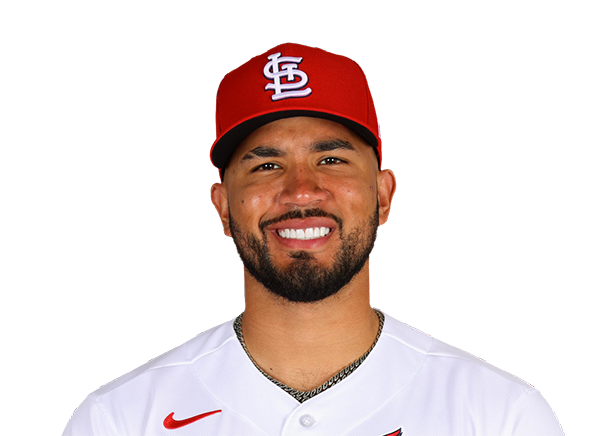 Ivan Herrera | 0-3 | 3 | 1 | 0 | 0 | 0 | 1 | 0 | 14 | .244 | .357 | .383 |
 Alec Burleson | 1-5 | 5 | 1 | 1 | 1 | 0 | 0 | 3 | 26 | .279 | .344 | .461 |
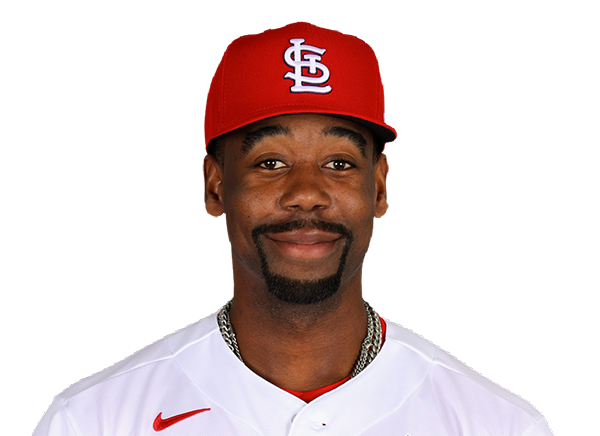 Jordan Walker | 1-4 | 4 | 0 | 1 | 0 | 0 | 0 | 1 | 12 | .273 | .330 | .470 |
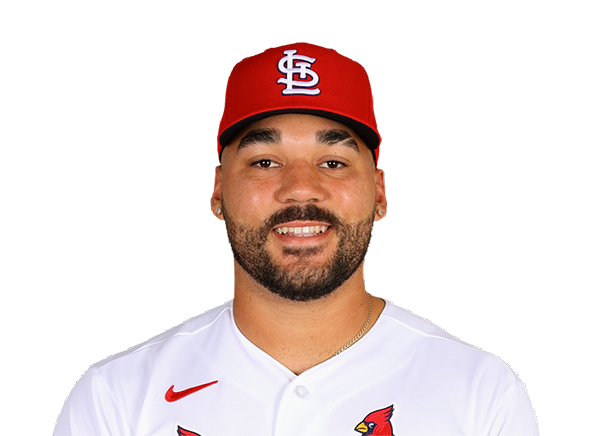 Leo Bernal | 1-4 | 4 | 0 | 1 | 1 | 0 | 0 | 1 | 19 | .296 | .337 | .481 |
 Nolan Gorman | 1-3 | 3 | 0 | 1 | 0 | 0 | 1 | 1 | 18 | .188 | .274 | .314 |
 Jose Fermin | 2-4 | 4 | 1 | 2 | 0 | 0 | 0 | 1 | 13 | .254 | .316 | .364 |
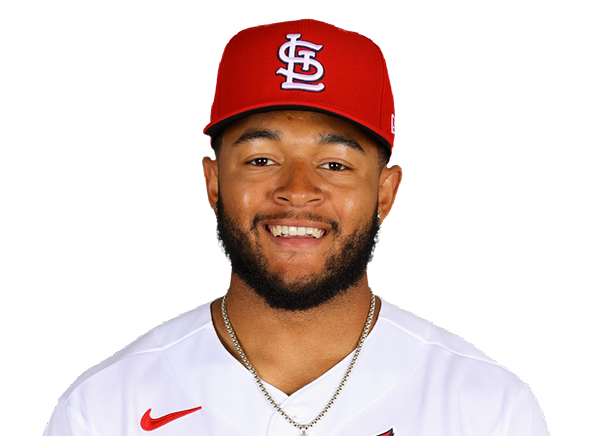 Victor Scott II | 0-0 | 0 | 0 | 0 | 0 | 0 | 0 | 0 | 0 | .190 | .269 | .252 |
 Nathan Church | 0-4 | 4 | 0 | 0 | 0 | 0 | 0 | 0 | 20 | .251 | .295 | .371 |
 Masyn Winn | 1-3 | 3 | 1 | 1 | 1 | 0 | 1 | 2 | 25 | .235 | .310 | .321 |
Pittsburgh Pirates
| Player | H-AB | AB | R | H | RBI | HR | BB | K | #P | AVG | OBP | SLG |
|---|---|---|---|---|---|---|---|---|---|---|---|---|
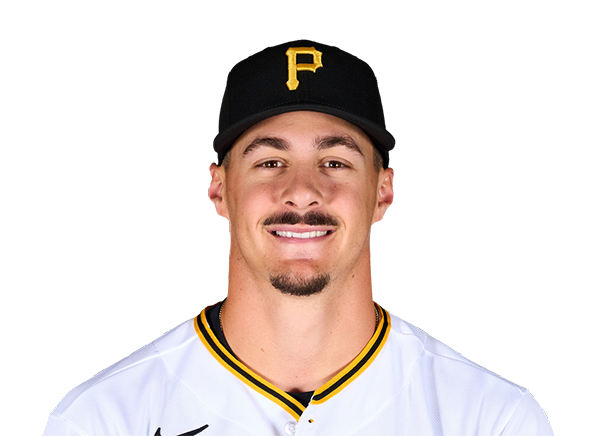 Konnor Griffin | 0-4 | 4 | 0 | 0 | 0 | 0 | 0 | 0 | 9 | .267 | .320 | .392 |
 Rafael Flores Jr. | 0-4 | 4 | 0 | 0 | 0 | 0 | 0 | 1 | 15 | .271 | .342 | .529 |
 Bryan Reynolds | 0-3 | 3 | 0 | 0 | 0 | 0 | 1 | 1 | 20 | .261 | .364 | .422 |
 Brandon Lowe | 2-4 | 4 | 1 | 2 | 1 | 1 | 0 | 1 | 10 | .262 | .331 | .494 |
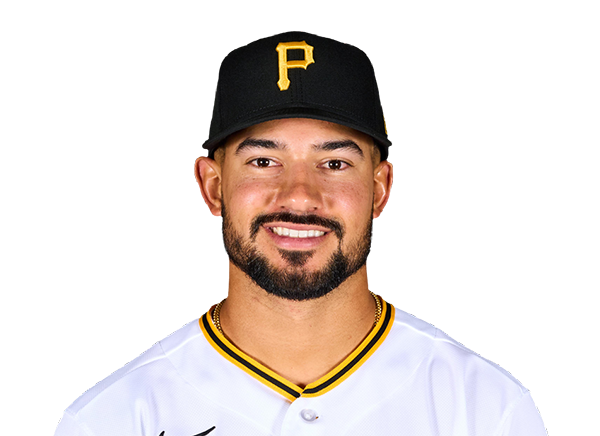 Nick Gonzales | 1-4 | 4 | 0 | 1 | 0 | 0 | 0 | 1 | 12 | .301 | .364 | .388 |
 Ronny Simon | 0-4 | 4 | 0 | 0 | 0 | 0 | 0 | 2 | 17 | .273 | .310 | .382 |
 Ryan O'Hearn | 2-3 | 3 | 0 | 2 | 0 | 0 | 0 | 0 | 13 | .267 | .333 | .448 |
 Jared Triolo | 1-3 | 3 | 0 | 1 | 0 | 0 | 0 | 1 | 16 | .241 | .311 | .306 |
 Jake Mangum | 0-3 | 3 | 0 | 0 | 0 | 0 | 0 | 2 | 17 | .277 | .334 | .367 |
St. Louis Cardinals
| Player | IP | H | R | ER | BB | K | HR | PC-ST | ERA | PC |
|---|---|---|---|---|---|---|---|---|---|---|
 Matthew Liberatore | 5.2 | 6 | 1 | 1 | 0 | 6 | 1 | 81-53 | 5.23 | 81 |
 Luis Gastelum | 1.1 | 0 | 0 | 0 | 0 | 0 | 0 | 20-13 | 4.29 | 20 |
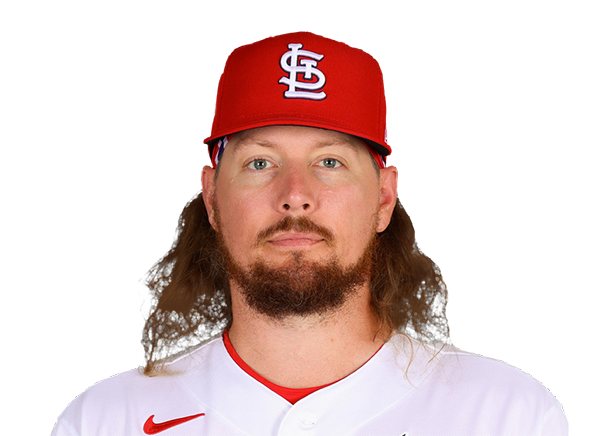 Ryne Stanek | 1.0 | 0 | 0 | 0 | 0 | 1 | 0 | 11-7 | 4.09 | 11 |
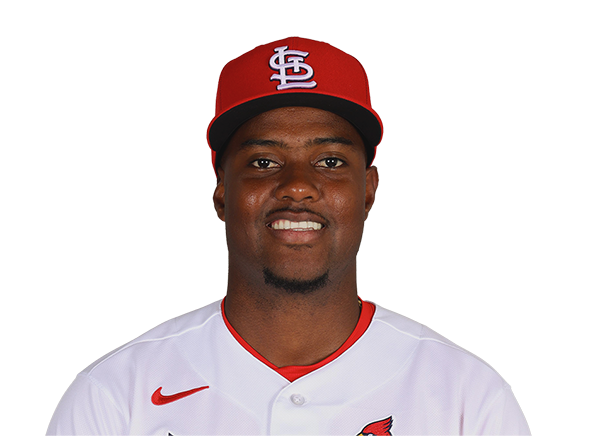 George Soriano | 1.0 | 0 | 0 | 0 | 1 | 2 | 0 | 17-13 | 4.23 | 17 |
Pittsburgh Pirates
| Player | IP | H | R | ER | BB | K | HR | PC-ST | ERA | PC |
|---|---|---|---|---|---|---|---|---|---|---|
 Lake Bachar | 1.2 | 1 | 0 | 0 | 1 | 2 | 0 | 30-18 | 3.49 | 30 |
 Brandon Eisert | 0.2 | 2 | 3 | 3 | 1 | 1 | 0 | 18-8 | 5.65 | 18 |
 Khristian Curtis | 3.2 | 5 | 2 | 2 | 1 | 3 | 0 | 71-45 | 4.71 | 71 |
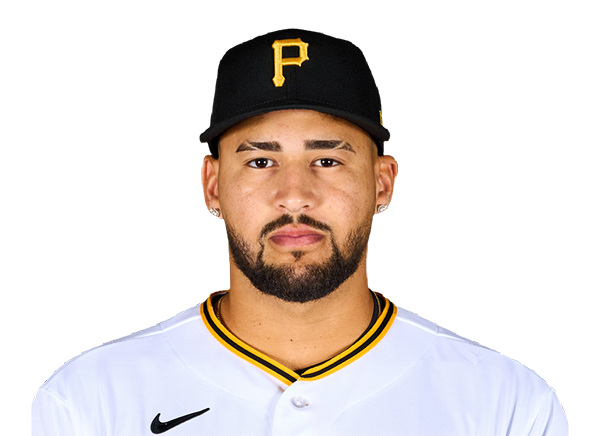 Antwone Kelly | 2.0 | 1 | 0 | 0 | 1 | 3 | 0 | 33-20 | 4.41 | 33 |
 Kirby Yates | 1.0 | 1 | 0 | 0 | 0 | 1 | 0 | 14-9 | 3.32 | 14 |
H2H / Season Series
PIT1–5
STL
PIT2–0
STL
STL4–5
PIT
STL2–6
PIT
STL4–1
PIT
STL2–6
PIT
STL0–7
PIT
STL9–6
PIT
PIT5–10
STL
PIT4–5
STL
Last 5 Games
| Date | Opponent | Result |
|---|---|---|
| Sep 23 | @ PIT | W5–1 |
| Sep 22 | @ PIT | L0–2 |
| Sep 20 |  vs WSH | W5–3 |
| Sep 19 | vs WSH | L5–8 |
| Sep 18 | vs WSH | L1–9 |
| Date | Opponent | Result |
|---|---|---|
| Sep 23 | vs STL | L1–5 |
| Sep 22 | vs STL | W2–0 |
| Sep 20 |  vs KC | W4–3 |
| Sep 19 | vs KC | W6–5 |
| Sep 18 | vs KC | W8–5 |
Standings
American League
| Team | W | L | PCT | GB | DIFF | STRK |
|---|---|---|---|---|---|---|
1 Rays | 96 | 62 | .608 | - | +79 | L1 |
2 Guardians | 82 | 76 | .519 | 14 | +2 | L1 |
3 Astros | 78 | 80 | .494 | 18 | -53 | L1 |
4 Yankees | 91 | 67 | .576 | 5 | +141 | W1 |
5 Red Sox | 85 | 73 | .538 | 11 | +80 | W1 |
6 White Sox | 81 | 77 | .513 | 15 | +44 | L1 |
7 Rangers | 78 | 80 | .494 | 18 | -42 | L3 |
8 Orioles | 78 | 81 | .491 | 18.5 | -26 | W3 |
9 Blue Jays | 77 | 82 | .484 | 19.5 | -47 | L3 |
10 Twins | 75 | 84 | .472 | 21.5 | -64 | W2 |
11 Mariners | 74 | 84 | .468 | 22 | -62 | W1 |
12 Tigers | 74 | 85 | .465 | 22.5 | +71 | L2 |
| 13Royals | 68 | 90 | .430 | 28 | -104 | W1 |
14 Athletics | 63 | 95 | .399 | 33 | -217 | W2 |
15 Angels | 60 | 98 | .380 | 36 | -93 | L3 |
National League
| Team | W | L | PCT | GB | DIFF | STRK |
|---|---|---|---|---|---|---|
1 Brewers | 99 | 59 | .627 | - | +203 | W1 |
2 Dodgers | 97 | 61 | .614 | 2 | +196 | L1 |
3 Braves | 93 | 65 | .589 | 6 | +117 | W1 |
4 Padres | 88 | 70 | .557 | 11 | +38 | W1 |
5 Cubs | 87 | 71 | .551 | 12 | +145 | L2 |
6 Phillies | 87 | 71 | .551 | 12 | +28 | L1 |
7 Diamondbacks | 84 | 74 | .532 | 15 | +6 | W4 |
| 8Pirates | 80 | 78 | .506 | 19 | +27 | L1 |
9 Marlins | 78 | 80 | .494 | 21 | +4 | W2 |
| 10Cardinals | 77 | 81 | .487 | 22 | -21 | W1 |
| 11Nationals | 75 | 84 | .472 | 24.5 | +9 | W2 |
12 Reds | 73 | 85 | .462 | 26 | -160 | L1 |
13 Mets | 73 | 85 | .462 | 26 | -33 | W2 |
14 Giants | 65 | 94 | .409 | 34.5 | -84 | L2 |
15 Rockies | 57 | 101 | .361 | 42 | -184 | L3 |
STL
VS
PIT
Pitchers
Matthew Liberatore
Catchers
Leo Bernal
Infielders
JJ Wetherholt
Alec Burleson
Nolan Gorman
Masyn Winn
Outfielders
Jordan Walker
Jose Fermin
Nathan Church
Designated Hitters
Ivan Herrera
Pitchers
Lake Bachar
Catchers
Rafael Flores Jr.
Infielders
Konnor Griffin
Brandon Lowe
Ryan O'Hearn
Jared Triolo
Outfielders
Bryan Reynolds
Ronny Simon
Jake Mangum
Designated Hitters
Nick Gonzales
Cardinals
VS
Pirates
Batting
158
Team Games Played
158
5334
At Bats
5420
1288
Hits
1374
685
Runs Batted In
717
161
Home Runs
182
99
Stolen Bases
129
.241
Batting Average
.254
709
Runs
751
227
Doubles
242
14
Triples
16
2026
Total Bases
2194
502
Walks
555
1258
Strikeouts
1465
.315
On Base Percentage
.330
.380
Slugging Percentage
.405
.695
OBP Pct + SLG Pct
.735
158
Games Played
158
158
Games Started
158
94
Hit By Pitch
84
0.0
Wins Above Replacement
0.0
0.0
Offensive Wins Above Replacement
0.0
26
Caught Stealing
28
1
Is Qualified
1
652.3
Runs Created
739.5
4.1
Runs Created Per 27 Outs
4.7
.084
Walks Per Plate Appearance
.091
0.40
Walk To Strikeout Ratio
0.38
.138
Isolated Power
.151
.246
Secondary Average
.272
3.87
Pitches Per Plate Appearance
3.91
402
Extra Base Hits
440
6006
Plate Appearances
6108
33.1
At Bats Per Home Run
29.8
19
Sacrifice Hit
12
55
Sacrifice Flies
32
Pitching
158
Team Games Played
158
54
Quality Starts
46
77
Wins
80
81
Losses
78
46
Saves
39
95
Holds
75
1356
Hits
1263
668
Earned runs
653
156
Home Runs
150
548
Walks
569
1248
Strikeouts
1453
8.0
Strikeouts Per 9 Innings
9.3
149.9
Pitches Per Start
149.8
1.35
Walks Plus Hits Per Inning Pitched
1.30
4.26
Earned Run Average
4.17
81
Losses
78
1410.2
Innings pitched
1410.1
.487
Win Percentage
.506
76
Save Opportunities
64
.253
Opponent Batting Average
.237
.328
Opponent's On-base pct.
.319
.398
Opponent's Slugging pct.
.380
.726
Opponent's OPB Pct + SLG Pct
.699
5359
At Bats
5323
278
Doubles
281
15
Triples
15
74
Batters Hit
86
116
Stolen Bases
100
158
Games Played
158
1
Complete Games
1
9
Shutouts
12
61
Wild Pitches
54
692
Runs Batted In
680
3
Balks
6
1410.2
Innings pitched
1410.1
8.0
Strikeouts Per 9 Innings
9.3
28
Caught Stealing
32
158
Games Started
158
0.0
Wins Above Replacement
0.0
1
Is Qualified
1
730
Runs
724
668
Earned Runs
653
2132
Total Bases
2024
Fielding
158
Team Games Played
158
1411
Full Innings
1410
5790
Total Chances
5573
4232
Putouts
4231
1484
Assists
1247
74
Errors
95
227
Double Plays
242
0.987
Fielding Percentage
0.983
36.5
Range Factor
35.0
0.0
Zone Rating
0.0
158
Games Played
158
0
Games Started
0
0.0
Defensive Wins Above Replacement
0.0
1
Qualified
1