

Cardinals vs Reds Live Score (20 Aug, 2026)
Game Information
Stage
Standard
Season
2026
First Pitch
Thu, Aug 20, 12:40 pm
Venue
Great American Ball Park
Location
Cincinnati, Ohio
Attendance
0
Live Situation
2Balls
2Strikes
1Outs
Brady SingerPitcher
Ivan HerreraAt Bat
Pitch 4 : Strike 2 Looking
Pitch Sequence
1
STRIKE LOOKING
Sinker
92 MPH
2
BALL
Sinker
90 MPH
3
BALL
Slider
82 MPH
4
STRIKE LOOKING
Sinker
91 MPH
Injury Report




Team Stats
 STL
CIN


1
Runs
0
2
Hits
1
0
Errors
0
0
Home Runs
0
0
Walks
0
1
Strikeouts
0
Player Box Score
St. Louis Cardinals
| Player | H-AB | AB | R | H | RBI | HR | BB | K | #P | AVG | OBP | SLG |
|---|---|---|---|---|---|---|---|---|---|---|---|---|
 JJ Wetherholt | 1-1 | 1 | 1 | 1 | 0 | 0 | 0 | 0 | 13 | .245 | .350 | .376 |
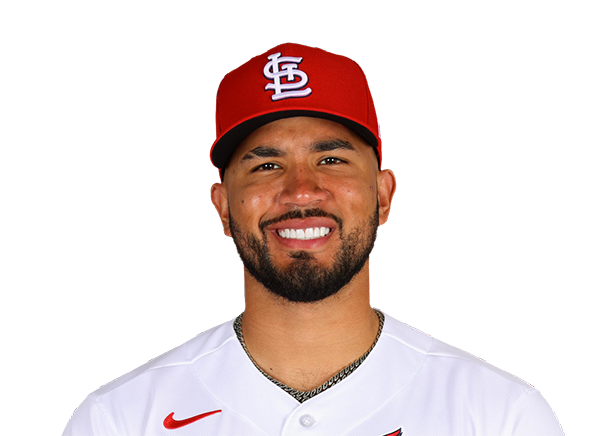 Ivan Herrera | 1-1 | 1 | 0 | 1 | 0 | 0 | 0 | 0 | 12 | .245 | .360 | .386 |
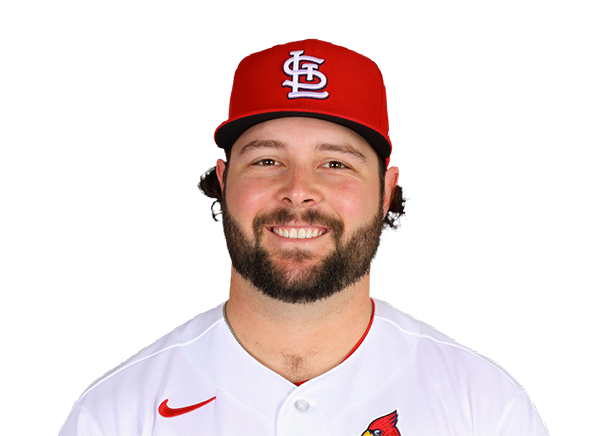 Alec Burleson | 0-1 | 1 | 0 | 0 | 0 | 0 | 0 | 0 | 3 | .288 | .354 | .490 |
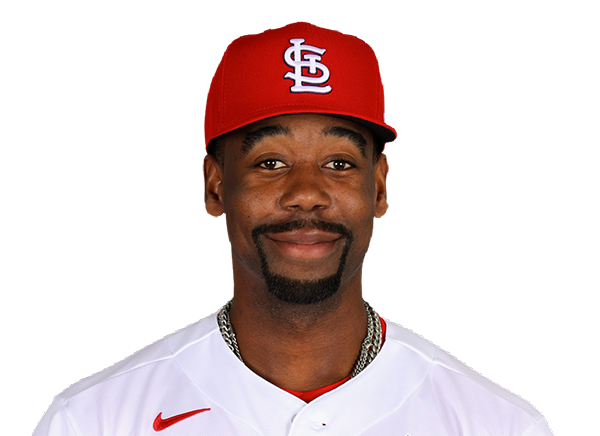 Jordan Walker | 0-1 | 1 | 0 | 0 | 1 | 0 | 0 | 0 | 3 | .288 | .347 | .501 |
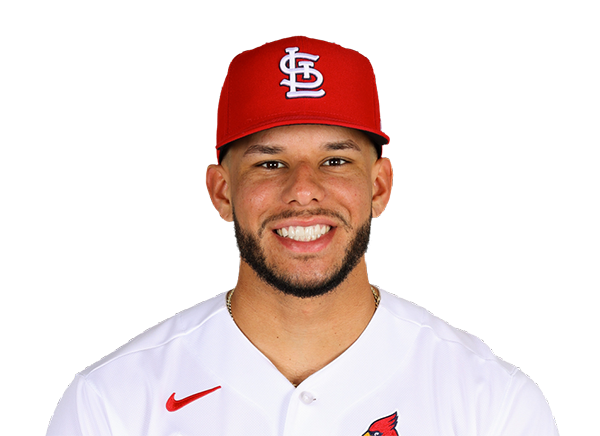 Joshua Baez | 0-1 | 1 | 0 | 0 | 0 | 0 | 0 | 0 | 4 | .174 | .231 | .565 |
 Nathan Church | 0-1 | 1 | 0 | 0 | 0 | 0 | 0 | 1 | 5 | .234 | .278 | .354 |
 Bryan Torres | 0-1 | 1 | 0 | 0 | 0 | 0 | 0 | 0 | 2 | .232 | .293 | .384 |
 Blaze Jordan | 0-1 | 1 | 0 | 0 | 0 | 0 | 0 | 0 | 3 | .247 | .275 | .373 |
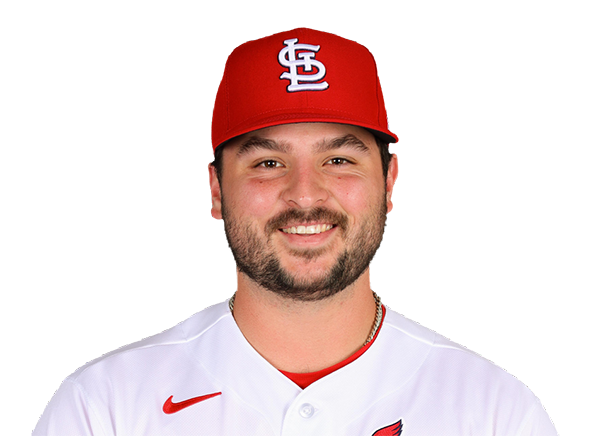 Jimmy Crooks | 0-1 | 1 | 0 | 0 | 0 | 0 | 0 | 0 | 2 | .175 | .248 | .317 |
Cincinnati Reds
| Player | H-AB | AB | R | H | RBI | HR | BB | K | #P | AVG | OBP | SLG |
|---|---|---|---|---|---|---|---|---|---|---|---|---|
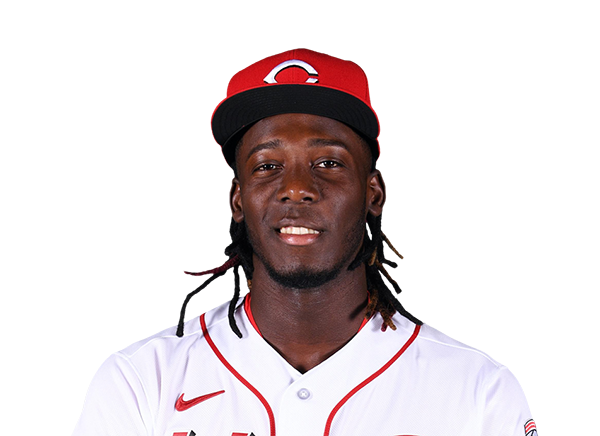 Elly De La Cruz | 1-1 | 1 | 0 | 1 | 0 | 0 | 0 | 0 | 5 | .261 | .342 | .469 |
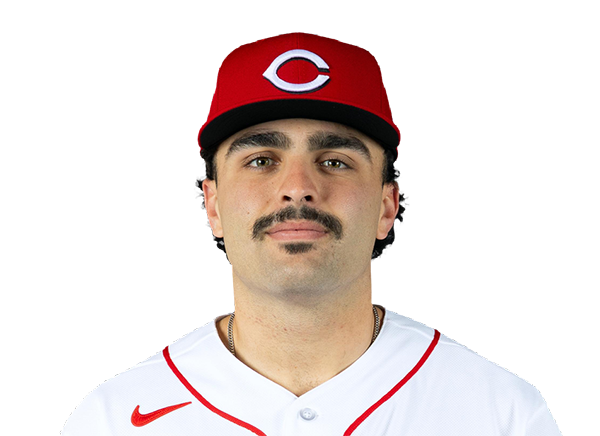 Sal Stewart | 0-1 | 1 | 0 | 0 | 0 | 0 | 0 | 0 | 4 | .258 | .333 | .475 |
 JJ Bleday | 0-1 | 1 | 0 | 0 | 0 | 0 | 0 | 0 | 2 | .218 | .329 | .433 |
 Tyler Stephenson | 0-1 | 1 | 0 | 0 | 0 | 0 | 0 | 0 | 2 | .241 | .324 | .408 |
 Matt McLain | 0-1 | 1 | 0 | 0 | 0 | 0 | 0 | 0 | 5 | .199 | .296 | .349 |
 Michael Toglia | 0-1 | 1 | 0 | 0 | 0 | 0 | 0 | 0 | 4 | .130 | .200 | .217 |
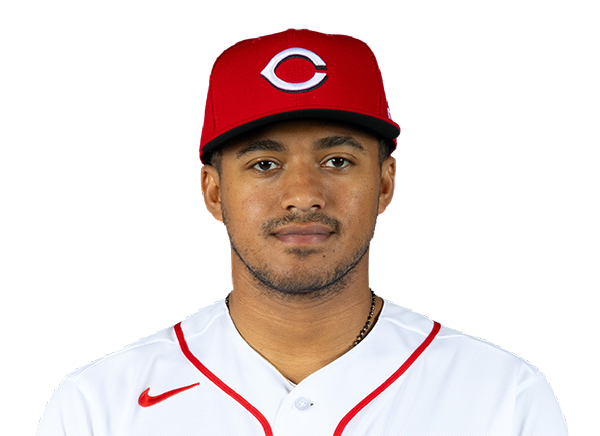 Dane Myers | 0-0 | 0 | 0 | 0 | 0 | 0 | 0 | 0 | 0 | .260 | .352 | .373 |
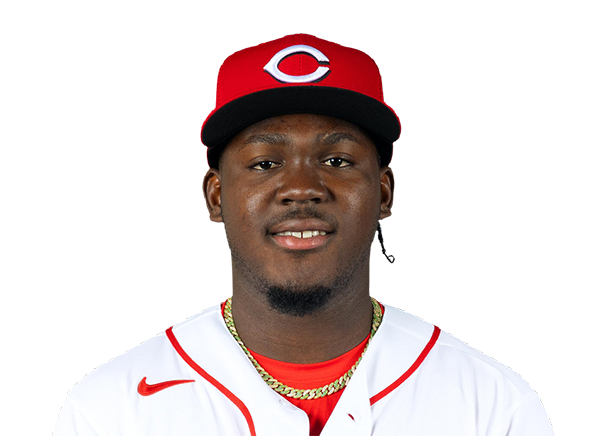 Hector Rodriguez | 0-0 | 0 | 0 | 0 | 0 | 0 | 0 | 0 | 0 | .097 | .176 | .129 |
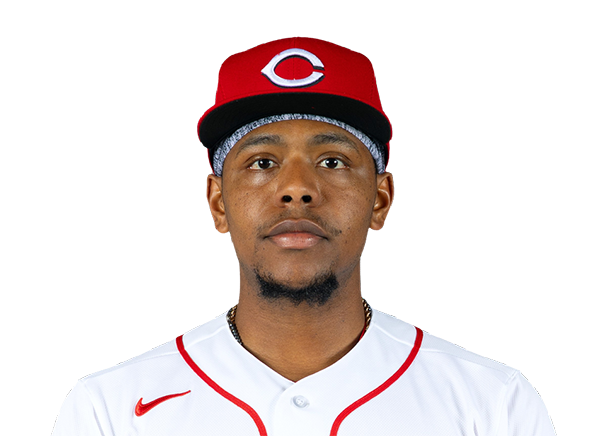 Ke'Bryan Hayes | 0-0 | 0 | 0 | 0 | 0 | 0 | 0 | 0 | 0 | .149 | .202 | .254 |
St. Louis Cardinals
| Player | IP | H | R | ER | BB | K | HR | PC-ST | ERA | PC |
|---|---|---|---|---|---|---|---|---|---|---|
 Michael McGreevy | 2.0 | 1 | 0 | 0 | 0 | 0 | 0 | 22-13 | 3.43 | 22 |
Cincinnati Reds
| Player | IP | H | R | ER | BB | K | HR | PC-ST | ERA | PC |
|---|---|---|---|---|---|---|---|---|---|---|
 Brady Singer | 2.1 | 2 | 1 | 1 | 0 | 1 | 0 | 47-30 | 4.64 | 47 |
H2H / Season Series
CIN0–1
STL
CIN5–4
STL
CIN0–3
STL
CIN6–5
STL
CIN1–2
STL
STL3–5
CIN
STL7–0
CIN
STL2–4
CIN
STL5–3
CIN
STL6–5
CIN
Last 5 Games
| Date | Opponent | Result |
|---|---|---|
| Aug 19 | @ CIN | L4–5 |
| Aug 18 | @ CIN | W3–0 |
| Aug 17 | @ CIN | L5–6 |
| Aug 17 | @ CIN | W2–1 |
| Aug 16 |  @ CHC | W11–4 |
| Date | Opponent | Result |
|---|---|---|
| Aug 19 | vs STL | W5–4 |
| Aug 18 | vs STL | L0–3 |
| Aug 17 | vs STL | W6–5 |
| Aug 17 | vs STL | L1–2 |
| Aug 16 |  vs MIA | L1–7 |
Standings
American League
| Team | W | L | PCT | GB | DIFF | STRK |
|---|---|---|---|---|---|---|
1 Rays | 76 | 53 | .589 | - | +42 | L3 |
2 White Sox | 67 | 62 | .519 | 9 | +42 | L1 |
3 Astros | 65 | 65 | .500 | 11.5 | -43 | L1 |
4 Yankees | 73 | 56 | .566 | 3 | +95 | L1 |
5 Red Sox | 70 | 59 | .543 | 6 | +98 | W2 |
6 Rangers | 64 | 66 | .492 | 12.5 | -48 | L1 |
7 Guardians | 64 | 66 | .492 | 12.5 | -14 | W3 |
8 Blue Jays | 64 | 67 | .489 | 13 | -50 | W1 |
9 Twins | 63 | 67 | .485 | 13.5 | -47 | L2 |
10 Orioles | 63 | 67 | .485 | 13.5 | -33 | W2 |
11 Mariners | 62 | 68 | .477 | 14.5 | -44 | W2 |
12 Tigers | 61 | 68 | .473 | 15 | +77 | L4 |
13 Royals | 57 | 74 | .435 | 20 | -95 | W7 |
14 Angels | 52 | 78 | .400 | 24.5 | -68 | W1 |
15 Athletics | 50 | 80 | .385 | 26.5 | -188 | W1 |
National League
| Team | W | L | PCT | GB | DIFF | STRK |
|---|---|---|---|---|---|---|
1 Brewers | 81 | 49 | .623 | - | +163 | W3 |
2 Dodgers | 79 | 51 | .608 | 2 | +147 | W5 |
3 Braves | 75 | 55 | .577 | 6 | +108 | L2 |
| 4Cubs | 74 | 56 | .569 | 7 | +98 | L3 |
5 Phillies | 72 | 58 | .554 | 9 | +25 | W8 |
6 Padres | 70 | 60 | .538 | 11 | +9 | W2 |
7 Diamondbacks | 68 | 62 | .523 | 13 | +7 | L1 |
| 8Marlins | 66 | 64 | .508 | 15 | +17 | W2 |
| 9Cardinals | 66 | 65 | .504 | 15.5 | 0 | L2 |
10 Pirates | 63 | 68 | .481 | 18.5 | +29 | L2 |
| 11Reds | 62 | 68 | .477 | 19 | -92 | W1 |
12 Nationals | 61 | 70 | .466 | 20.5 | +14 | L3 |
13 Mets | 59 | 71 | .454 | 22 | -39 | W1 |
14 Giants | 52 | 77 | .403 | 28.5 | -79 | L3 |
15 Rockies | 50 | 79 | .388 | 30.5 | -131 | L5 |
STL
VS
CIN
Pitchers
Michael McGreevy
Catchers
Jimmy Crooks
Infielders
JJ Wetherholt
Alec Burleson
Bryan Torres
Blaze Jordan
Outfielders
Jordan Walker
Joshua Baez
Nathan Church
Designated Hitters
Ivan Herrera
Pitchers
Brady Singer
Catchers
Tyler Stephenson
Infielders
Sal Stewart
Matt McLain
Michael Toglia
Ke'Bryan Hayes
Outfielders
JJ Bleday
Dane Myers
Hector Rodriguez
Designated Hitters
Elly De La Cruz
Cardinals
VS
Reds
Batting
128
Team Games Played
127
4290
At Bats
4211
1032
Hits
951
549
Runs Batted In
490
132
Home Runs
164
79
Stolen Bases
88
.241
Batting Average
.226
562
Runs
514
185
Doubles
182
13
Triples
11
1639
Total Bases
1647
419
Walks
450
993
Strikeouts
1211
.317
On Base Percentage
.305
.382
Slugging Percentage
.391
.699
OBP Pct + SLG Pct
.696
128
Games Played
127
128
Games Started
127
79
Hit By Pitch
40
0.0
Wins Above Replacement
0.0
0.0
Offensive Wins Above Replacement
0.0
21
Caught Stealing
30
1
Is Qualified
1
531.2
Runs Created
514.6
4.2
Runs Created Per 27 Outs
4.1
.086
Walks Per Plate Appearance
.095
0.42
Walk To Strikeout Ratio
0.37
.141
Isolated Power
.165
.253
Secondary Average
.286
3.86
Pitches Per Plate Appearance
3.94
330
Extra Base Hits
357
4850
Plate Appearances
4746
32.5
At Bats Per Home Run
25.7
18
Sacrifice Hit
14
42
Sacrifice Flies
28
Pitching
128
Team Games Played
127
47
Quality Starts
43
65
Wins
61
63
Losses
66
37
Saves
33
84
Holds
71
1082
Hits
1060
508
Earned runs
562
125
Home Runs
158
429
Walks
525
991
Strikeouts
1033
7.8
Strikeouts Per 9 Innings
8.2
148.5
Pitches Per Start
153.4
1.32
Walks Plus Hits Per Inning Pitched
1.40
4.01
Earned Run Average
4.48
63
Losses
66
1141.1
Innings pitched
1130.0
.508
Win Percentage
.480
59
Save Opportunities
52
.250
Opponent Batting Average
.246
.324
Opponent's On-base pct.
.334
.392
Opponent's Slugging pct.
.410
.716
Opponent's OPB Pct + SLG Pct
.743
4322
At Bats
4305
218
Doubles
187
10
Triples
21
58
Batters Hit
62
88
Stolen Bases
120
128
Games Played
127
1
Complete Games
0
9
Shutouts
8
52
Wild Pitches
36
525
Runs Batted In
583
3
Balks
2
1141.1
Innings pitched
1130.0
7.8
Strikeouts Per 9 Innings
8.2
21
Caught Stealing
25
128
Games Started
127
0.0
Wins Above Replacement
0.0
1
Is Qualified
1
553
Runs
602
508
Earned Runs
562
1695
Total Bases
1763
Fielding
128
Team Games Played
127
1141
Full Innings
1130
4677
Total Chances
4481
3424
Putouts
3390
1198
Assists
1022
55
Errors
69
185
Double Plays
182
0.988
Fielding Percentage
0.985
36.4
Range Factor
35.1
0.0
Zone Rating
0.0
128
Games Played
127
0
Games Started
0
0.0
Defensive Wins Above Replacement
0.0
1
Qualified
1