

Cardinals vs Reds Live Score (17 Aug, 2026)
Game Information
Stage
Standard
Season
2026
First Pitch
Mon, Aug 17, 1:40 pm
Venue
Great American Ball Park
Location
Cincinnati, Ohio
Attendance
20,434
Injury Report

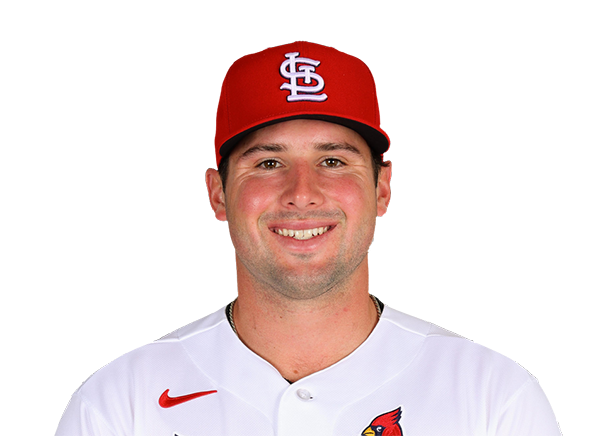
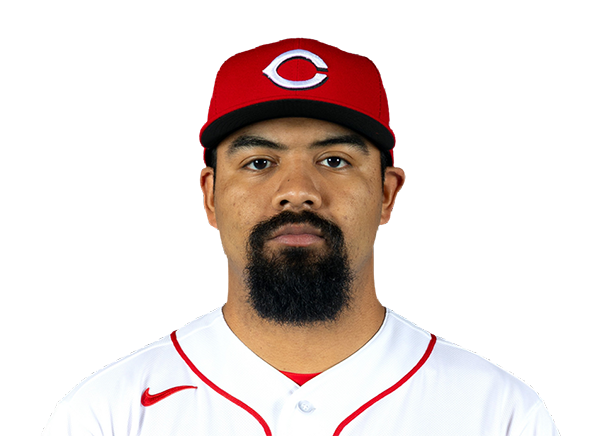


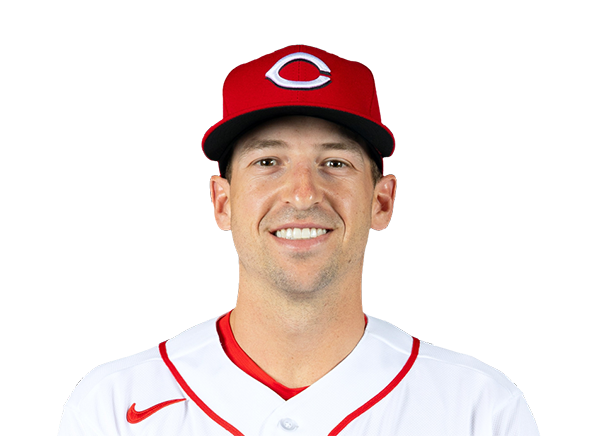

Team Stats
 STL
CIN


Array
Runs
Array
7
Hits
3
0
Errors
0
—
Home Runs
—
—
Walks
—
—
Strikeouts
—
Standings
American League
| Team | W | L | PCT | GB | DIFF | STRK |
|---|---|---|---|---|---|---|
1 Rays | 76 | 53 | .589 | - | +42 | L3 |
2 White Sox | 67 | 62 | .519 | 9 | +42 | L1 |
3 Astros | 65 | 65 | .500 | 11.5 | -43 | L1 |
4 Yankees | 73 | 56 | .566 | 3 | +95 | L1 |
5 Red Sox | 70 | 59 | .543 | 6 | +98 | W2 |
6 Rangers | 64 | 66 | .492 | 12.5 | -48 | L1 |
7 Guardians | 64 | 66 | .492 | 12.5 | -14 | W3 |
8 Blue Jays | 64 | 67 | .489 | 13 | -50 | W1 |
9 Twins | 63 | 67 | .485 | 13.5 | -47 | L2 |
10 Orioles | 63 | 67 | .485 | 13.5 | -33 | W2 |
11 Mariners | 62 | 68 | .477 | 14.5 | -44 | W2 |
12 Tigers | 61 | 68 | .473 | 15 | +77 | L4 |
13 Royals | 57 | 74 | .435 | 20 | -95 | W7 |
14 Angels | 52 | 78 | .400 | 24.5 | -68 | W1 |
15 Athletics | 50 | 80 | .385 | 26.5 | -188 | W1 |
National League
| Team | W | L | PCT | GB | DIFF | STRK |
|---|---|---|---|---|---|---|
1 Brewers | 81 | 49 | .623 | - | +163 | W3 |
2 Dodgers | 79 | 51 | .608 | 2 | +147 | W5 |
3 Braves | 75 | 55 | .577 | 6 | +108 | L2 |
4 Cubs | 74 | 56 | .569 | 7 | +98 | L3 |
5 Phillies | 72 | 58 | .554 | 9 | +25 | W8 |
6 Padres | 70 | 60 | .538 | 11 | +9 | W2 |
7 Diamondbacks | 68 | 62 | .523 | 13 | +7 | L1 |
8 Marlins | 66 | 64 | .508 | 15 | +17 | W2 |
| 9Cardinals | 66 | 65 | .504 | 15.5 | 0 | L2 |
10 Pirates | 63 | 68 | .481 | 18.5 | +29 | L2 |
| 11Reds | 62 | 68 | .477 | 19 | -92 | W1 |
12 Nationals | 61 | 70 | .466 | 20.5 | +14 | L3 |
13 Mets | 59 | 71 | .454 | 22 | -39 | W1 |
14 Giants | 52 | 77 | .403 | 28.5 | -79 | L3 |
15 Rockies | 50 | 79 | .388 | 30.5 | -131 | L5 |
STL
VS
CIN
Pitchers

Quinn Mathews

Luis Gastelum
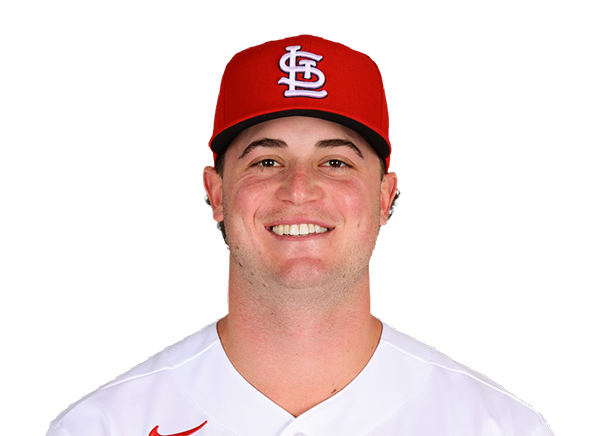
Gordon Graceffo
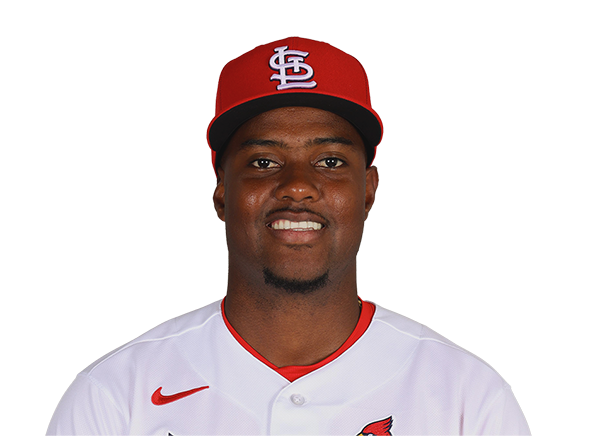
George Soriano
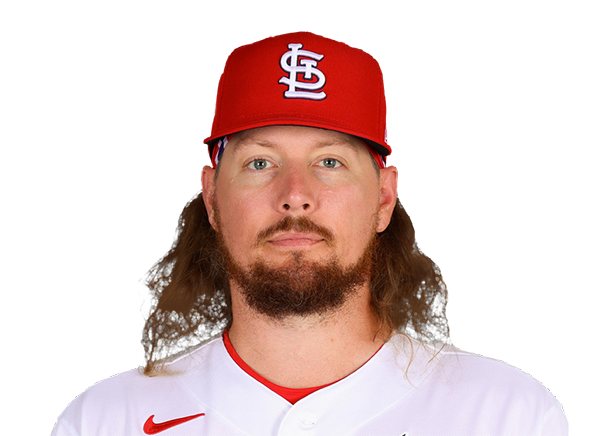
Ryne Stanek

Riley O'Brien
Catchers
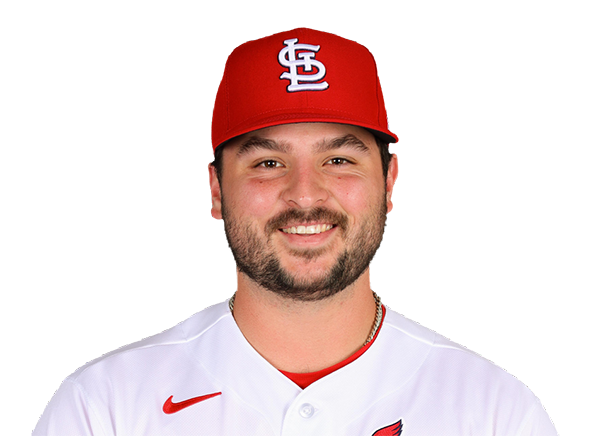
Jimmy Crooks
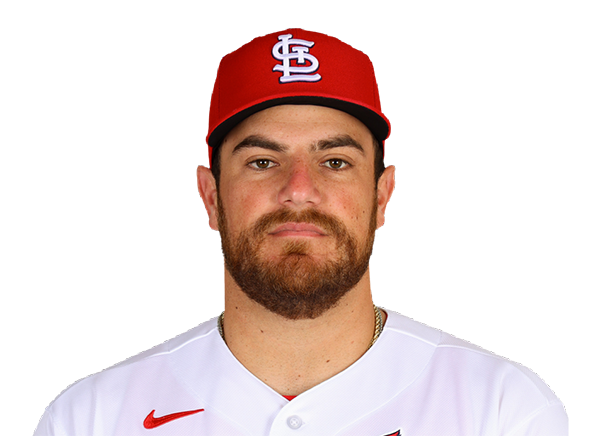
Pedro Pages
Infielders
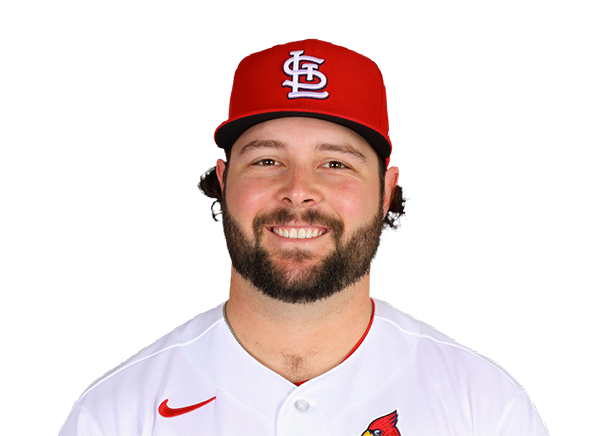
Alec Burleson

Jose Fermin

Masyn Winn

Blaze Jordan
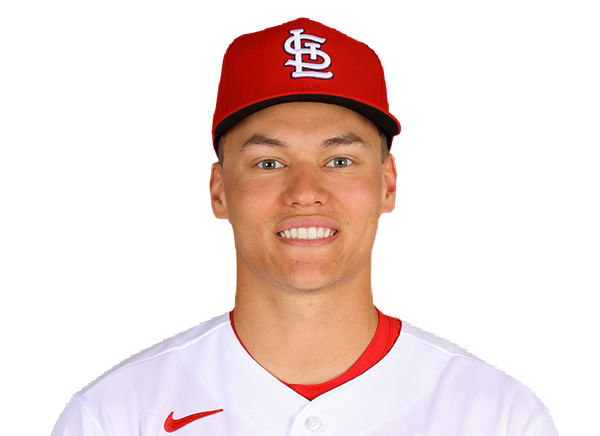
JJ Wetherholt
Outfielders
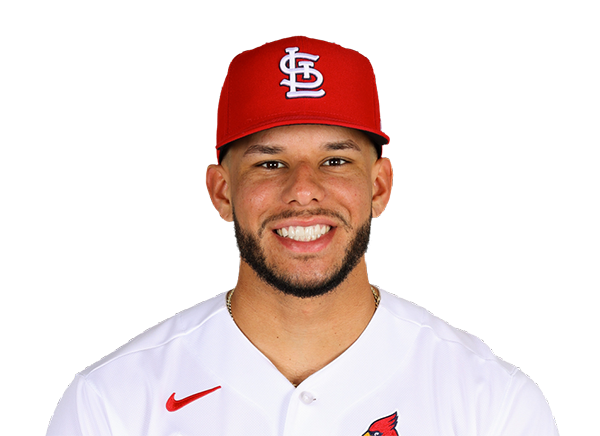
Joshua Baez

Nathan Church
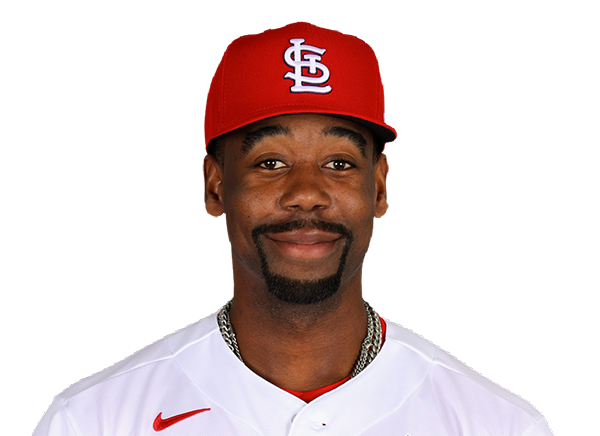
Jordan Walker

Everson Pereira
Designated Hitters
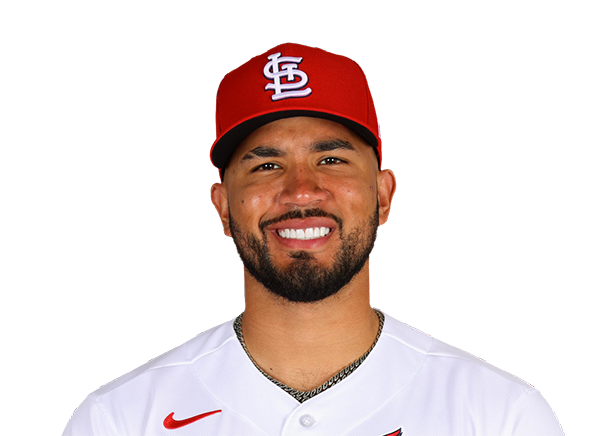
Ivan Herrera
Pitchers

Kent Emanuel

Luis Mey

Pierce Johnson

Sam Moll
Catchers

Tyler Stephenson
Infielders
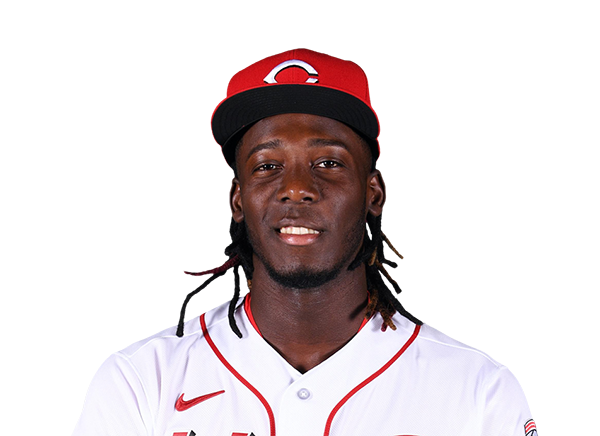
Elly De La Cruz
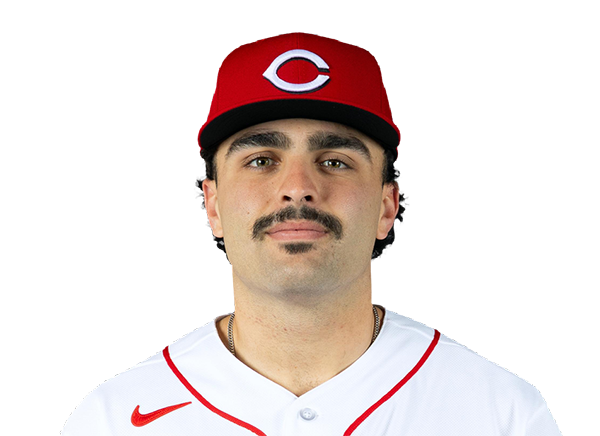
Sal Stewart

Michael Toglia

Matt McLain

Ke'Bryan Hayes
Outfielders
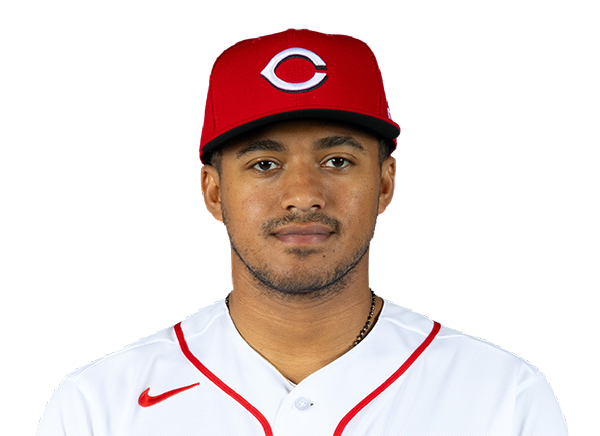
Dane Myers
Noelvi Marte

JJ Bleday
Designated Hitters

Eugenio Suarez
Cardinals
VS
Reds
Batting
126
Team Games Played
125
4221
At Bats
4150
1016
Hits
941
542
Runs Batted In
486
130
Home Runs
163
77
Stolen Bases
87
.241
Batting Average
.227
555
Runs
509
179
Doubles
181
13
Triples
11
1611
Total Bases
1633
411
Walks
447
973
Strikeouts
1190
.317
On Base Percentage
.306
.382
Slugging Percentage
.393
.698
OBP Pct + SLG Pct
.700
126
Games Played
125
126
Games Started
125
78
Hit By Pitch
40
0.0
Wins Above Replacement
0.0
0.0
Offensive Wins Above Replacement
0.0
21
Caught Stealing
30
1
Is Qualified
1
521.2
Runs Created
512.5
4.2
Runs Created Per 27 Outs
4.1
.086
Walks Per Plate Appearance
.095
0.42
Walk To Strikeout Ratio
0.38
.141
Isolated Power
.167
.252
Secondary Average
.288
3.86
Pitches Per Plate Appearance
3.93
322
Extra Base Hits
355
4771
Plate Appearances
4682
32.5
At Bats Per Home Run
25.5
18
Sacrifice Hit
14
41
Sacrifice Flies
28
Pitching
126
Team Games Played
125
46
Quality Starts
42
64
Wins
60
62
Losses
65
36
Saves
32
81
Holds
69
1072
Hits
1044
503
Earned runs
555
124
Home Runs
156
426
Walks
517
970
Strikeouts
1013
7.8
Strikeouts Per 9 Innings
8.2
148.6
Pitches Per Start
153.2
1.33
Walks Plus Hits Per Inning Pitched
1.40
4.03
Earned Run Average
4.49
62
Losses
65
1124.1
Innings pitched
1112.0
.508
Win Percentage
.480
58
Save Opportunities
51
.252
Opponent Batting Average
.246
.325
Opponent's On-base pct.
.334
.395
Opponent's Slugging pct.
.410
.720
Opponent's OPB Pct + SLG Pct
.744
4261
At Bats
4236
217
Doubles
181
10
Triples
21
58
Batters Hit
61
87
Stolen Bases
118
126
Games Played
125
1
Complete Games
0
8
Shutouts
8
51
Wild Pitches
33
521
Runs Batted In
576
3
Balks
2
1124.1
Innings pitched
1112.0
7.8
Strikeouts Per 9 Innings
8.2
21
Caught Stealing
25
126
Games Started
125
0.0
Wins Above Replacement
0.0
1
Is Qualified
1
548
Runs
595
503
Earned Runs
555
1681
Total Bases
1735
Fielding
126
Team Games Played
125
1124
Full Innings
1112
4616
Total Chances
4414
3373
Putouts
3336
1189
Assists
1010
54
Errors
68
179
Double Plays
181
0.988
Fielding Percentage
0.985
36.5
Range Factor
35.2
0.0
Zone Rating
0.0
126
Games Played
125
0
Games Started
0
0.0
Defensive Wins Above Replacement
0.0
1
Qualified
1