

Cardinals vs Rockies Live Score (6 Sep, 2026)
Game Information
Stage
STD
Season
2026
First Pitch
Sat, Sep 5, 8:10 pm
Venue
Coors Field
Location
Denver, Colorado
Venue Type
Outdoor
Broadcast
MLB.TV
Attendance
39,768
Live Situation
0Balls
0Strikes
0Outs
—Pitcher
—At Bat
Pitch Sequence
1
BALL IN PLAY
Four-seam FB
92 MPH
Injury Report









Team Stats
 STL
COL


7
Runs
10
13
Hits
11
2
Errors
0
2
Home Runs
0
2
Walks
4
12
Strikeouts
6
Player Box Score
St. Louis Cardinals
| Player | H-AB | AB | R | H | RBI | HR | BB | K | #P | AVG | OBP | SLG |
|---|---|---|---|---|---|---|---|---|---|---|---|---|
 Bryan Torres | 1-2 | 2 | 0 | 1 | 0 | 0 | 1 | 1 | 11 | .258 | .324 | .386 |
 Ramon Urias | 0-1 | 1 | 0 | 0 | 0 | 0 | 0 | 0 | 2 | .159 | .271 | .341 |
 Cesar Prieto | 0-1 | 1 | 0 | 0 | 0 | 0 | 0 | 0 | 1 | .063 | .063 | .063 |
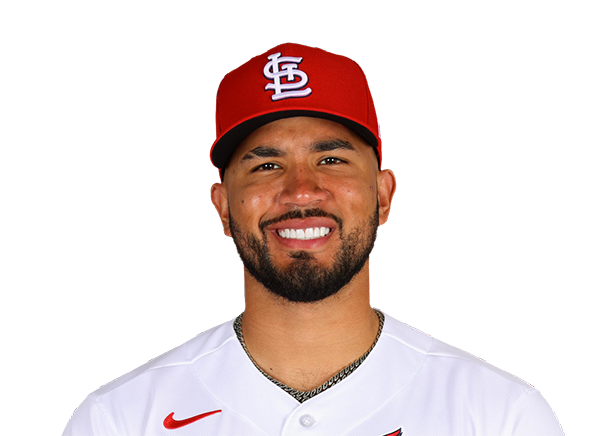 Ivan Herrera | 2-5 | 5 | 1 | 2 | 3 | 1 | 0 | 2 | 17 | .248 | .359 | .385 |
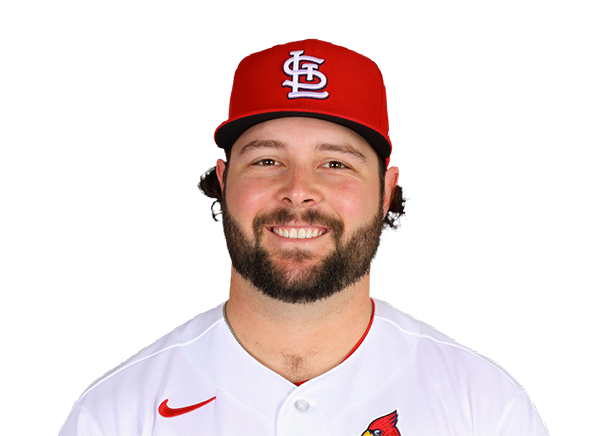 Alec Burleson | 1-5 | 5 | 0 | 1 | 0 | 0 | 0 | 1 | 23 | .280 | .343 | .461 |
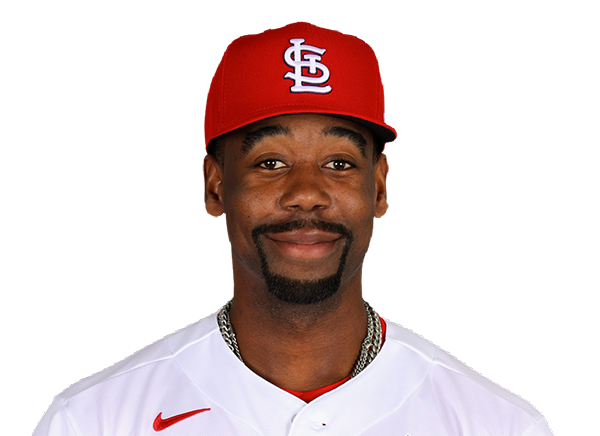 Jordan Walker | 0-5 | 5 | 0 | 0 | 0 | 0 | 0 | 3 | 17 | .286 | .341 | .499 |
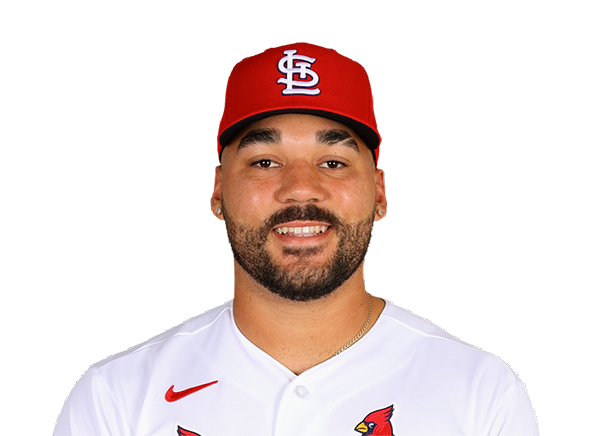 Leo Bernal | 2-5 | 5 | 1 | 2 | 0 | 0 | 0 | 1 | 9 | .350 | .409 | .550 |
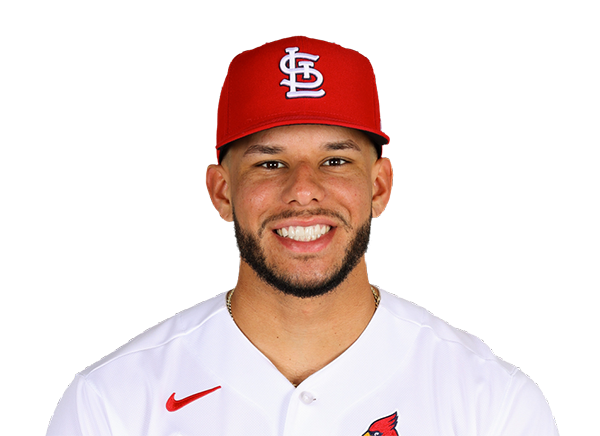 Joshua Baez | 2-4 | 4 | 2 | 2 | 1 | 1 | 0 | 2 | 20 | .229 | .286 | .586 |
 Nolan Gorman | 1-4 | 4 | 0 | 1 | 1 | 0 | 0 | 2 | 13 | .186 | .265 | .316 |
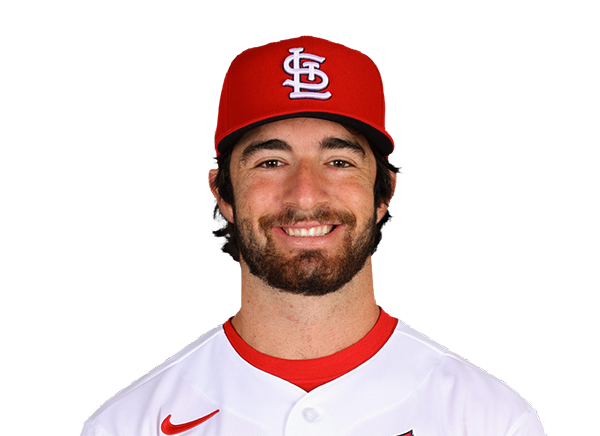 Thomas Saggese | 2-2 | 2 | 1 | 2 | 1 | 0 | 1 | 0 | 20 | .260 | .324 | .448 |
 Nathan Church | 1-2 | 2 | 1 | 1 | 0 | 0 | 0 | 0 | 4 | .243 | .285 | .365 |
 Jose Fermin | 1-2 | 2 | 1 | 1 | 1 | 0 | 0 | 0 | 11 | .241 | .304 | .354 |
Colorado Rockies
| Player | H-AB | AB | R | H | RBI | HR | BB | K | #P | AVG | OBP | SLG |
|---|---|---|---|---|---|---|---|---|---|---|---|---|
 Jake McCarthy | 1-3 | 3 | 2 | 1 | 0 | 0 | 2 | 0 | 17 | .290 | .335 | .476 |
 Connor Norby | 1-2 | 2 | 2 | 1 | 1 | 0 | 2 | 0 | 25 | .225 | .330 | .351 |
 Hunter Goodman | 1-5 | 5 | 1 | 1 | 2 | 0 | 0 | 2 | 15 | .249 | .316 | .530 |
 TJ Rumfield | 1-4 | 4 | 0 | 1 | 1 | 0 | 0 | 0 | 14 | .295 | .387 | .456 |
 Cole Carrigg | 2-4 | 4 | 1 | 2 | 1 | 0 | 0 | 1 | 18 | .269 | .344 | .458 |
 Mickey Moniak | 0-0 | 0 | 0 | 0 | 0 | 0 | 0 | 0 | 0 | .248 | .288 | .493 |
 Jordan Beck | 0-2 | 2 | 0 | 0 | 0 | 0 | 0 | 1 | 10 | .197 | .250 | .299 |
 Zac Veen | 0-1 | 1 | 0 | 0 | 1 | 0 | 0 | 1 | 7 | .243 | .333 | .514 |
 Troy Johnston | 1-4 | 4 | 1 | 1 | 1 | 0 | 0 | 0 | 18 | .287 | .358 | .405 |
 Adael Amador | 2-4 | 4 | 1 | 2 | 1 | 0 | 0 | 0 | 14 | .400 | .483 | .720 |
 Ezequiel Tovar | 2-4 | 4 | 2 | 2 | 0 | 0 | 0 | 1 | 14 | .213 | .260 | .336 |
St. Louis Cardinals
| Player | IP | H | R | ER | BB | K | HR | PC-ST | ERA | PC |
|---|---|---|---|---|---|---|---|---|---|---|
 Matthew Liberatore | 4.1 | 4 | 5 | 5 | 2 | 3 | 0 | 69-46 | 5.57 | 69 |
 Luis Gastelum | 0.2 | 2 | 1 | 1 | 0 | 1 | 0 | 18-11 | 4.88 | 18 |
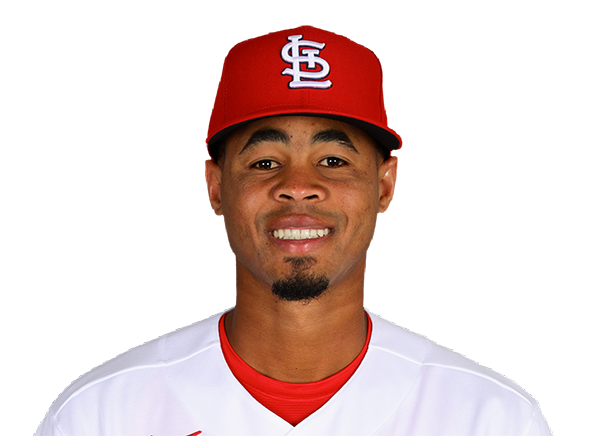 Hancel Rincon | 1.0 | 2 | 4 | 4 | 1 | 1 | 0 | 30-18 | 47.25 | 30 |
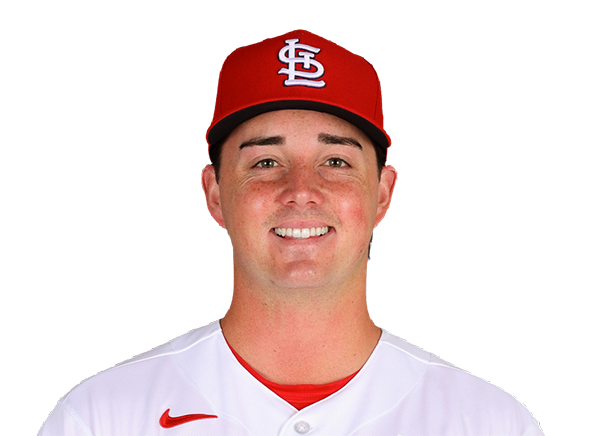 Brycen Mautz | 2.0 | 3 | 0 | 0 | 1 | 1 | 0 | 35-26 | 9.00 | 35 |
Colorado Rockies
| Player | IP | H | R | ER | BB | K | HR | PC-ST | ERA | PC |
|---|---|---|---|---|---|---|---|---|---|---|
 Mason Adams | 4.2 | 8 | 3 | 3 | 1 | 7 | 2 | 78-56 | 3.95 | 78 |
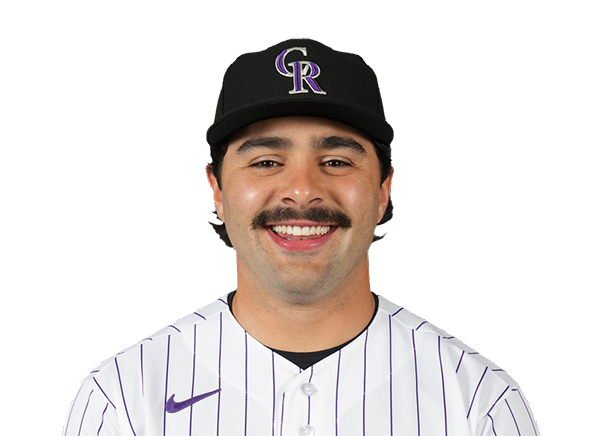 Zach Agnos | 0.2 | 3 | 2 | 2 | 0 | 0 | 0 | 12-8 | 5.60 | 12 |
 Brennan Bernardino | 0.2 | 0 | 0 | 0 | 0 | 0 | 0 | 9-5 | 2.51 | 9 |
 Jaden Hill | 1.0 | 0 | 0 | 0 | 0 | 2 | 0 | 15-10 | 4.81 | 15 |
 Nick Frasso | 1.0 | 0 | 0 | 0 | 0 | 2 | 0 | 12-7 | 3.46 | 12 |
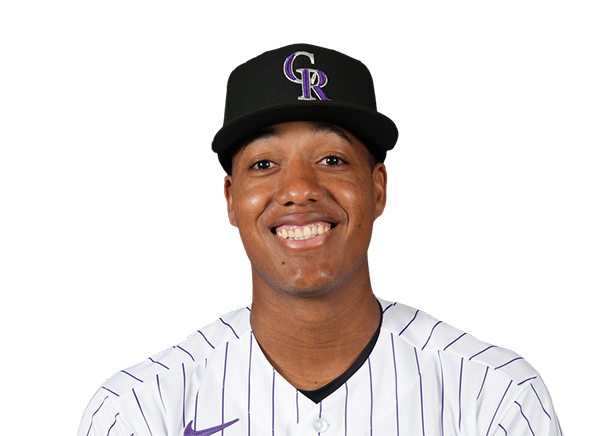 Juan Mejia | 0.1 | 2 | 2 | 2 | 1 | 0 | 0 | 12-7 | 5.68 | 12 |
 Jordan Romano | 0.2 | 0 | 0 | 0 | 0 | 1 | 0 | 10-7 | 4.88 | 10 |
H2H / Season Series
COL10–7
STL
COL6–7
STL
STL7–4
COL
STL6–8
COL
STL3–2
COL
Last 5 Games
| Date | Opponent | Result |
|---|---|---|
| Sep 5 | @ COL | L7–10 |
| Sep 4 | @ COL | W7–6 |
| Sep 3 |  @ LAD | L2–3 |
| Sep 2 | @ LAD | W8–6 |
| Sep 1 | @ LAD | W13–8 |
| Date | Opponent | Result |
|---|---|---|
| Sep 5 | vs STL | W10–7 |
| Sep 4 | vs STL | L6–7 |
| Sep 2 |  vs BAL | W6–5 |
| Sep 1 | vs BAL | W4–2 |
| Aug 31 | vs BAL | L1–2 |
Standings
American League
| Team | W | L | PCT | GB | DIFF | STRK |
|---|---|---|---|---|---|---|
1 Rays | 84 | 57 | .596 | - | +46 | W1 |
2 White Sox | 74 | 67 | .525 | 10 | +42 | W1 |
3 Astros | 73 | 69 | .514 | 11.5 | -36 | W3 |
4 Yankees | 80 | 61 | .567 | 4 | +114 | L1 |
5 Red Sox | 77 | 65 | .542 | 7.5 | +79 | W2 |
6 Guardians | 72 | 71 | .503 | 13 | -15 | L1 |
7 Blue Jays | 71 | 71 | .500 | 13.5 | -34 | W3 |
8 Rangers | 70 | 72 | .493 | 14.5 | -43 | L1 |
| 9Orioles | 69 | 73 | .486 | 15.5 | -22 | L4 |
10 Twins | 67 | 74 | .475 | 17 | -41 | L2 |
11 Mariners | 66 | 76 | .465 | 18.5 | -69 | L2 |
12 Tigers | 65 | 77 | .458 | 19.5 | +51 | W1 |
13 Royals | 63 | 79 | .444 | 21.5 | -92 | L1 |
14 Athletics | 56 | 86 | .394 | 28.5 | -190 | W3 |
15 Angels | 54 | 88 | .380 | 30.5 | -76 | W1 |
National League
| Team | W | L | PCT | GB | DIFF | STRK |
|---|---|---|---|---|---|---|
1 Brewers | 88 | 54 | .620 | - | +174 | W1 |
| 2Dodgers | 84 | 57 | .596 | 3.5 | +149 | W2 |
3 Braves | 84 | 58 | .592 | 4 | +119 | L1 |
4 Cubs | 81 | 62 | .566 | 7.5 | +139 | W3 |
5 Phillies | 80 | 62 | .563 | 8 | +35 | W1 |
6 Padres | 74 | 67 | .525 | 13.5 | +11 | W1 |
7 Diamondbacks | 74 | 68 | .521 | 14 | -3 | L1 |
| 8Cardinals | 71 | 71 | .500 | 17 | -8 | W1 |
9 Marlins | 71 | 72 | .497 | 17.5 | +8 | L3 |
10 Pirates | 70 | 73 | .490 | 18.5 | +25 | L1 |
11 Reds | 67 | 74 | .475 | 20.5 | -111 | L1 |
12 Nationals | 67 | 76 | .469 | 21.5 | +12 | L2 |
13 Mets | 64 | 78 | .451 | 24 | -50 | L1 |
14 Giants | 59 | 84 | .413 | 29.5 | -73 | W1 |
| 15Rockies | 54 | 87 | .383 | 33.5 | -141 | L1 |
STL
VS
COL
Pitchers
Matthew Liberatore
Catchers
Leo Bernal
Infielders
Bryan Torres
Alec Burleson
Nolan Gorman
Thomas Saggese
Outfielders
Jordan Walker
Joshua Baez
Nathan Church
Designated Hitters
Ivan Herrera
Pitchers
Mason Adams
Catchers
Hunter Goodman
Infielders
Connor Norby
TJ Rumfield
Adael Amador
Ezequiel Tovar
Outfielders
Jake McCarthy
Cole Carrigg
Jordan Beck
Designated Hitters
Troy Johnston
Cardinals
VS
Rockies
Batting
143
Team Games Played
142
4823
At Bats
4827
1171
Hits
1225
629
Runs Batted In
643
153
Home Runs
156
92
Stolen Bases
100
.243
Batting Average
.254
647
Runs
671
204
Doubles
256
14
Triples
30
1862
Total Bases
2009
453
Walks
456
1129
Strikeouts
1230
.316
On Base Percentage
.324
.386
Slugging Percentage
.416
.702
OBP Pct + SLG Pct
.740
143
Games Played
142
143
Games Started
142
87
Hit By Pitch
70
0.0
Wins Above Replacement
0.0
0.0
Offensive Wins Above Replacement
0.0
23
Caught Stealing
37
1
Is Qualified
1
602.4
Runs Created
664.0
4.2
Runs Created Per 27 Outs
4.7
.083
Walks Per Plate Appearance
.084
0.40
Walk To Strikeout Ratio
0.37
.143
Isolated Power
.162
.252
Secondary Average
.270
3.86
Pitches Per Plate Appearance
3.75
371
Extra Base Hits
442
5433
Plate Appearances
5421
31.5
At Bats Per Home Run
30.9
19
Sacrifice Hit
19
49
Sacrifice Flies
48
Pitching
143
Team Games Played
142
47
Quality Starts
23
71
Wins
55
72
Losses
87
42
Saves
32
92
Holds
59
1233
Hits
1426
608
Earned runs
755
142
Home Runs
191
492
Walks
468
1123
Strikeouts
970
7.9
Strikeouts Per 9 Innings
7.0
149.6
Pitches Per Start
149.0
1.35
Walks Plus Hits Per Inning Pitched
1.52
4.29
Earned Run Average
5.44
72
Losses
87
1274.1
Innings pitched
1249.2
.497
Win Percentage
.387
68
Save Opportunities
55
.254
Opponent Batting Average
.287
.329
Opponent's On-base pct.
.350
.399
Opponent's Slugging pct.
.484
.728
Opponent's OPB Pct + SLG Pct
.834
4850
At Bats
4972
252
Doubles
316
13
Triples
45
66
Batters Hit
54
101
Stolen Bases
116
143
Games Played
142
1
Complete Games
1
9
Shutouts
1
59
Wild Pitches
40
625
Runs Batted In
775
3
Balks
5
1274.1
Innings pitched
1249.2
7.9
Strikeouts Per 9 Innings
7.0
22
Caught Stealing
23
143
Games Started
142
0.0
Wins Above Replacement
0.0
1
Is Qualified
1
658
Runs
809
608
Earned Runs
755
1937
Total Bases
2405
Fielding
143
Team Games Played
142
1274
Full Innings
1250
5213
Total Chances
5036
3823
Putouts
3749
1329
Assists
1197
61
Errors
90
204
Double Plays
256
0.988
Fielding Percentage
0.982
36.4
Range Factor
35.6
0.0
Zone Rating
0.0
143
Games Played
142
0
Games Started
0
0.0
Defensive Wins Above Replacement
0.0
1
Qualified
1