

Cubs vs Braves Live Score (14 May, 2026)
Game Information
Stage
Standard
Season
2026
First Pitch
Thu, May 14, 7:15 pm
Venue
Truist Park
Location
Atlanta, Georgia
Attendance
36,367
Live Situation
1Balls
2Strikes
0Outs
—Pitcher
—At Bat
Pitch Sequence
1
STRIKE FOUL
Four-seam FB
100 MPH
2
STRIKE FOUL
Four-seam FB
100 MPH
3
STRIKE FOUL
Four-seam FB
101 MPH
4
BALL
Four-seam FB
100 MPH
5
BALL IN PLAY
Four-seam FB
101 MPH
Injury Report
Team Stats
 CHC
ATL


2
Runs
0
6
Hits
5
0
Errors
1
1
Home Runs
0
3
Walks
1
10
Strikeouts
13
Player Box Score
Chicago Cubs
| Player | H-AB | AB | R | H | RBI | HR | BB | K | #P | AVG | OBP | SLG |
|---|---|---|---|---|---|---|---|---|---|---|---|---|
 Nico Hoerner | 0-3 | 3 | 0 | 0 | 0 | 0 | 1 | 1 | 20 | .267 | .345 | .407 |
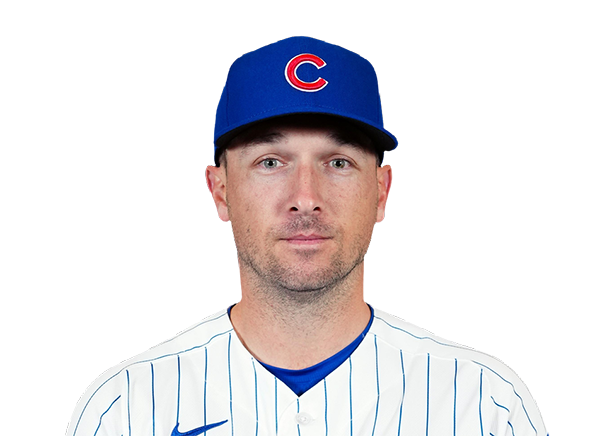 Alex Bregman | 1-4 | 4 | 0 | 1 | 0 | 0 | 0 | 1 | 12 | .246 | .333 | .357 |
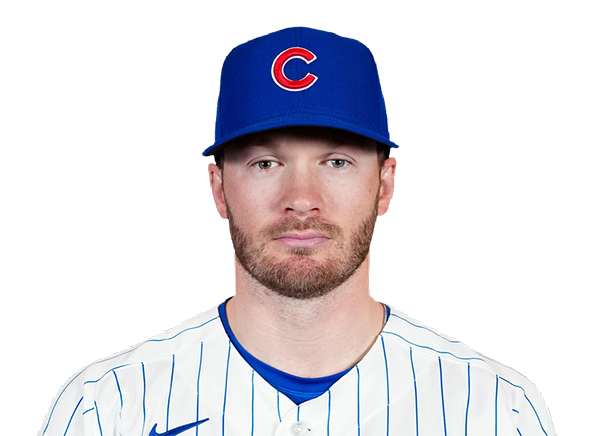 Ian Happ | 2-3 | 3 | 2 | 2 | 1 | 1 | 1 | 0 | 19 | .234 | .376 | .481 |
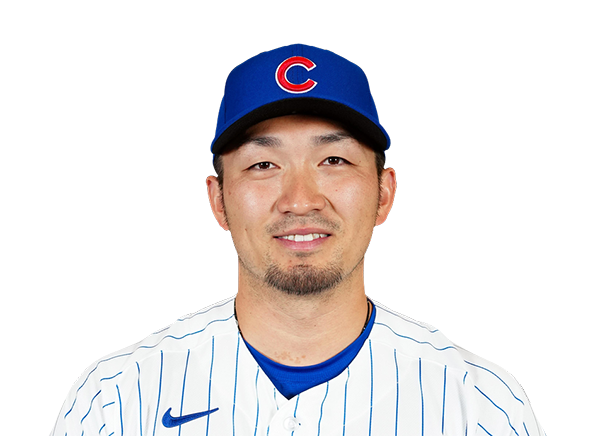 Seiya Suzuki | 0-4 | 4 | 0 | 0 | 0 | 0 | 0 | 1 | 13 | .264 | .374 | .482 |
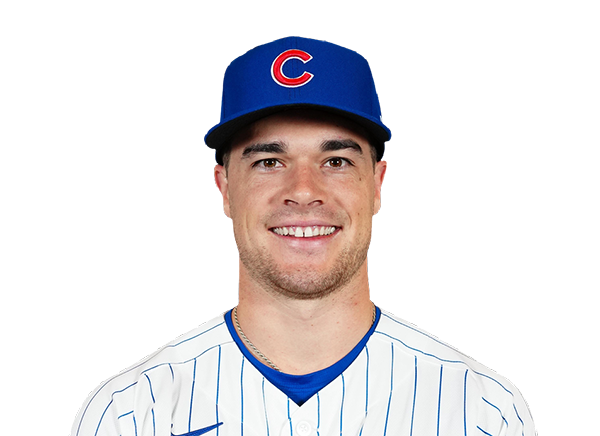 Matt Shaw | 0-4 | 4 | 0 | 0 | 1 | 0 | 0 | 1 | 18 | .256 | .292 | .422 |
 Michael Busch | 1-4 | 4 | 0 | 1 | 0 | 0 | 0 | 3 | 21 | .231 | .348 | .353 |
 Dansby Swanson | 0-4 | 4 | 0 | 0 | 0 | 0 | 0 | 2 | 15 | .189 | .300 | .350 |
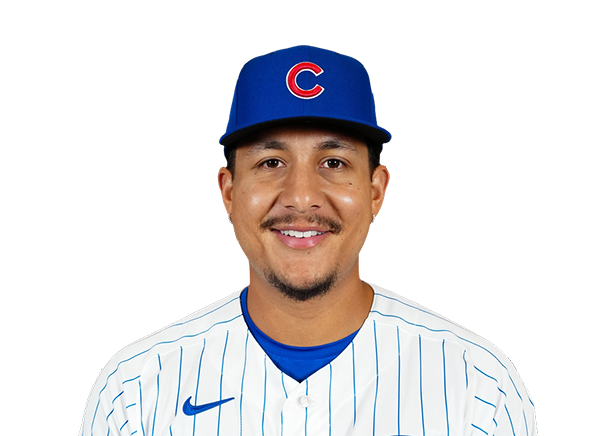 Miguel Amaya | 1-4 | 4 | 0 | 1 | 0 | 0 | 0 | 1 | 11 | .230 | .365 | .344 |
 Pete Crow-Armstrong | 1-3 | 3 | 0 | 1 | 0 | 0 | 1 | 0 | 17 | .238 | .311 | .369 |
Atlanta Braves
| Player | H-AB | AB | R | H | RBI | HR | BB | K | #P | AVG | OBP | SLG |
|---|---|---|---|---|---|---|---|---|---|---|---|---|
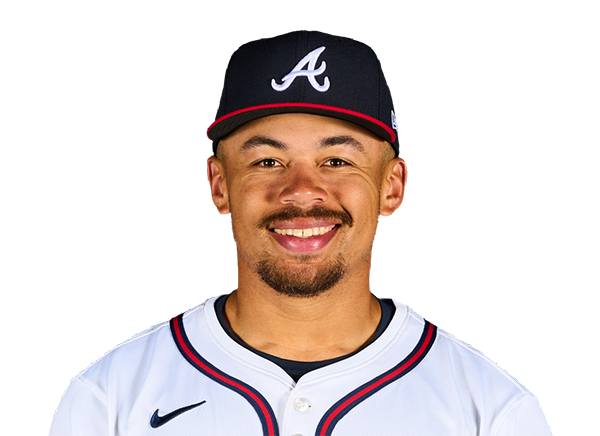 Drake Baldwin | 1-4 | 4 | 0 | 1 | 0 | 0 | 0 | 2 | 18 | .294 | .375 | .514 |
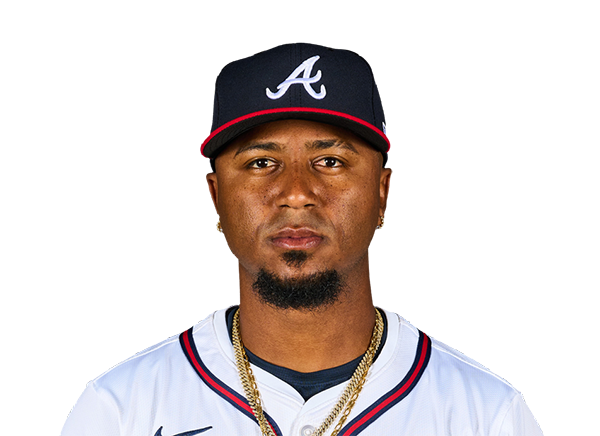 Ozzie Albies | 0-4 | 4 | 0 | 0 | 0 | 0 | 0 | 0 | 16 | .288 | .340 | .476 |
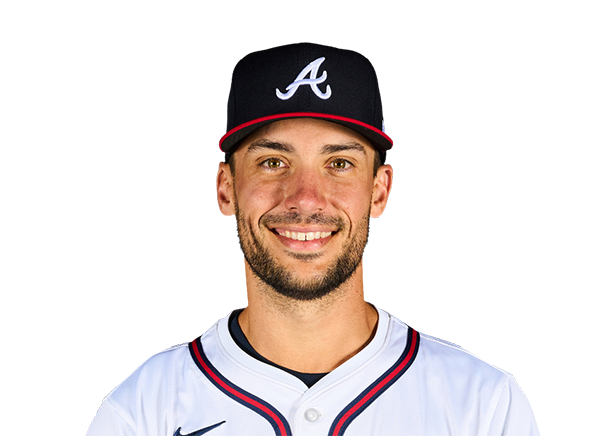 Matt Olson | 1-4 | 4 | 0 | 1 | 0 | 0 | 0 | 3 | 19 | .294 | .371 | .629 |
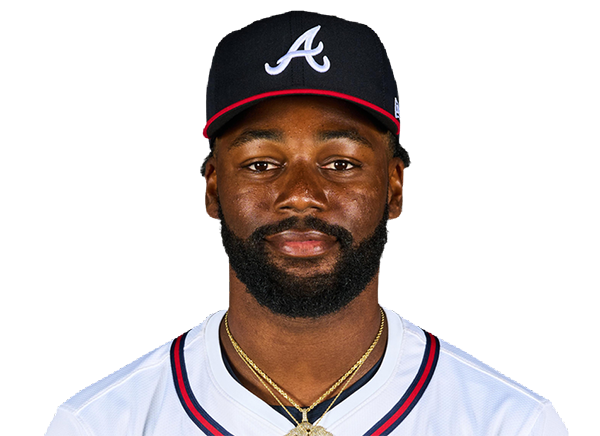 Michael Harris II | 1-4 | 4 | 0 | 1 | 0 | 0 | 0 | 2 | 16 | .309 | .336 | .496 |
 Mauricio Dubon | 0-4 | 4 | 0 | 0 | 0 | 0 | 0 | 2 | 9 | .256 | .314 | .404 |
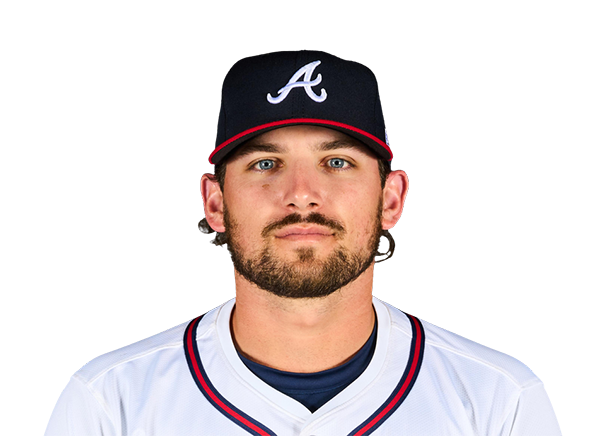 Austin Riley | 1-3 | 3 | 0 | 1 | 0 | 0 | 0 | 1 | 19 | .218 | .290 | .370 |
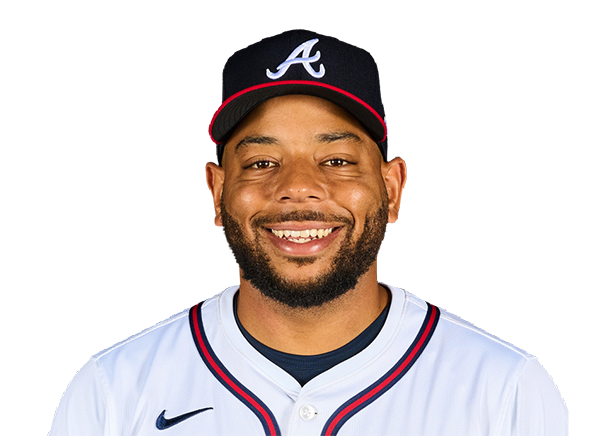 Dominic Smith | 1-4 | 4 | 0 | 1 | 0 | 0 | 0 | 1 | 15 | .353 | .380 | .529 |
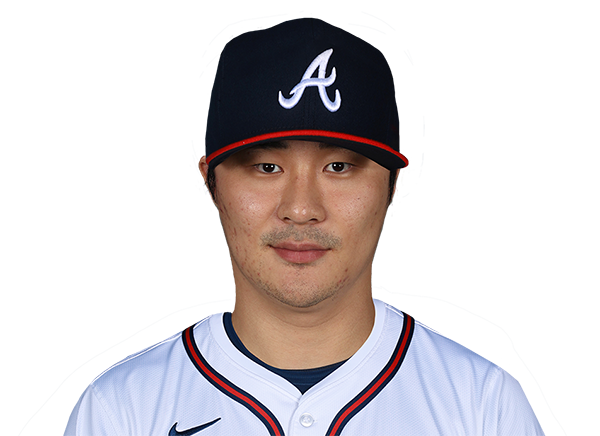 Ha-Seong Kim | 0-3 | 3 | 0 | 0 | 0 | 0 | 0 | 1 | 8 | .111 | .200 | .111 |
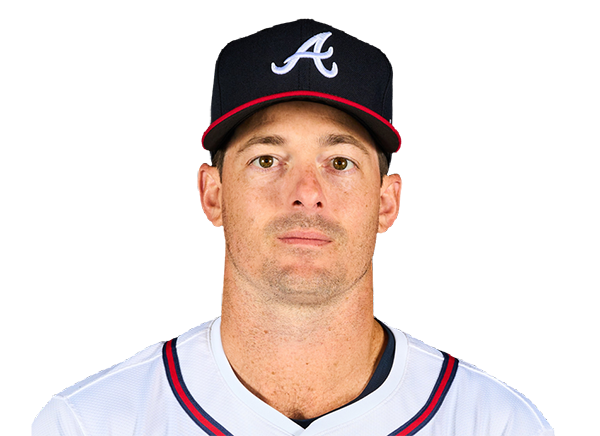 Mike Yastrzemski | 0-2 | 2 | 0 | 0 | 0 | 0 | 1 | 1 | 16 | .217 | .282 | .300 |
Chicago Cubs
| Player | IP | H | R | ER | BB | K | HR | PC-ST | ERA | PC |
|---|---|---|---|---|---|---|---|---|---|---|
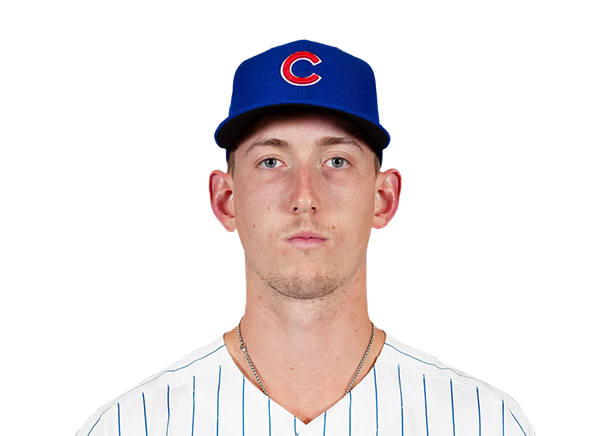 Ben Brown | 4.0 | 1 | 0 | 0 | 1 | 7 | 0 | 65-40 | 1.60 | 65 |
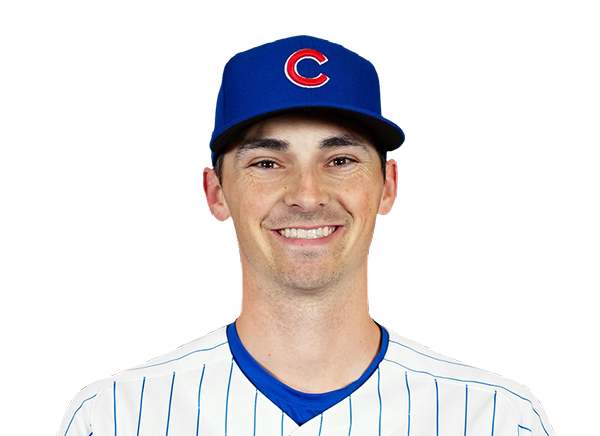 Hoby Milner | 2.0 | 1 | 0 | 0 | 0 | 1 | 0 | 25-18 | 2.21 | 25 |
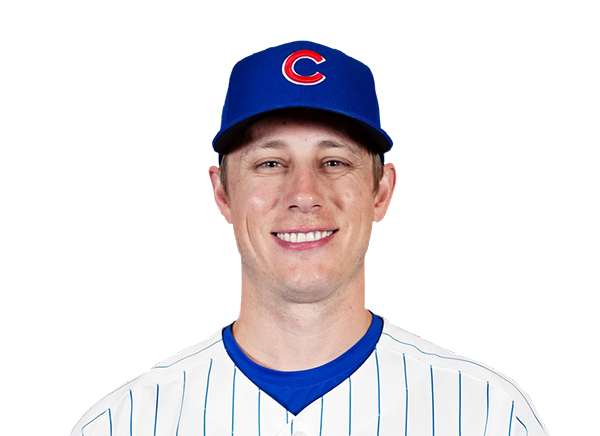 Phil Maton | 1.0 | 1 | 0 | 0 | 0 | 2 | 0 | 14-11 | 7.71 | 14 |
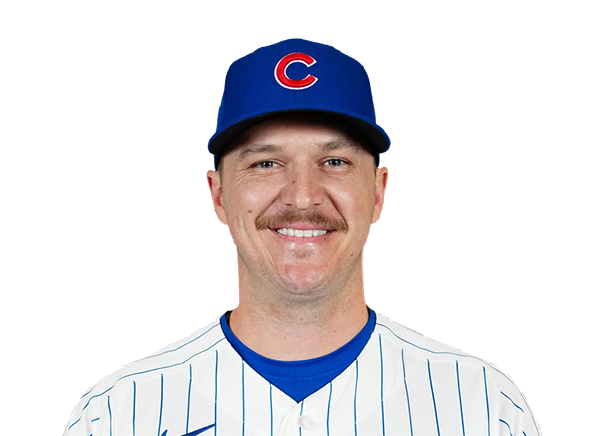 Jacob Webb | 1.0 | 1 | 0 | 0 | 0 | 1 | 0 | 16-12 | 3.44 | 16 |
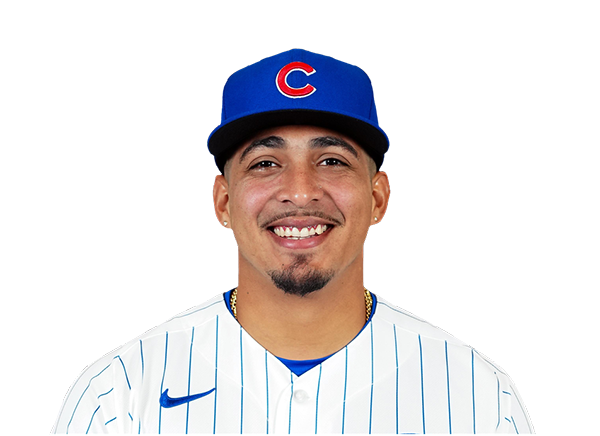 Daniel Palencia | 1.0 | 1 | 0 | 0 | 0 | 2 | 0 | 16-12 | 2.25 | 16 |
Atlanta Braves
| Player | IP | H | R | ER | BB | K | HR | PC-ST | ERA | PC |
|---|---|---|---|---|---|---|---|---|---|---|
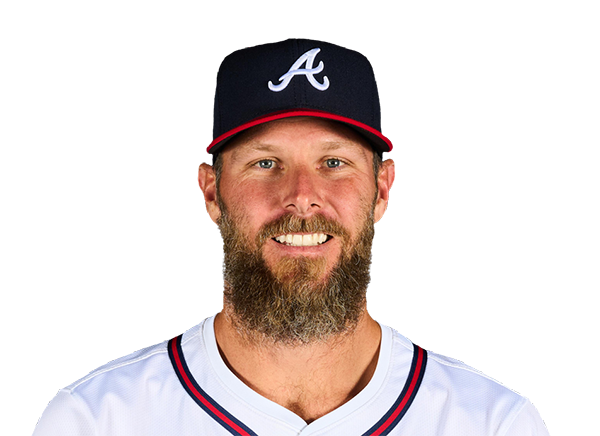 Chris Sale | 6.0 | 5 | 1 | 0 | 2 | 8 | 0 | 100-65 | 1.96 | 100 |
 Reynaldo Lopez | 1.2 | 1 | 1 | 1 | 1 | 1 | 1 | 32-22 | 3.81 | 32 |
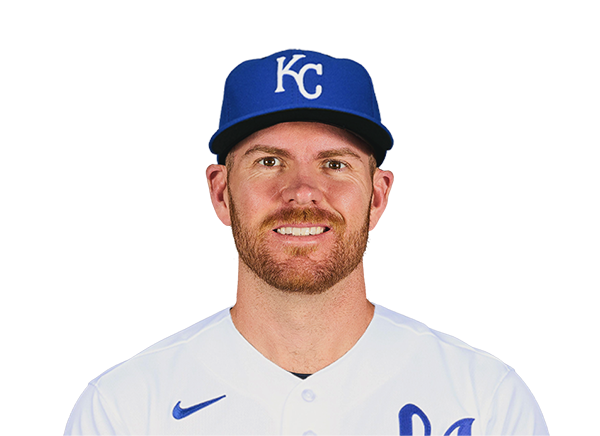 Aaron Bummer | 1.1 | 0 | 0 | 0 | 0 | 1 | 0 | 14-9 | 4.40 | 14 |
H2H / Season Series
ATL0–2
CHC
ATL4–1
CHC
ATL5–2
CHC
Last 5 Games
| Date | Opponent | Result |
|---|---|---|
| Aug 22 |  @ SEA | L4–5 |
| Aug 21 | @ SEA | L5–6 |
| Aug 19 |  vs CHW | L0–3 |
| Aug 18 | vs CHW | W4–3 |
| Aug 17 | vs CHW | W7–5 |
| Date | Opponent | Result |
|---|---|---|
| Aug 22 |  @ MIL | L1–4 |
| Aug 21 | @ MIL | L1–2 |
| Aug 20 | @ CHW | W2–0 |
| Aug 19 |  @ MIN | L4–6 |
| Aug 18 | @ MIN | L1–4 |
Standings
American League
| Team | W | L | PCT | GB | DIFF | STRK |
|---|---|---|---|---|---|---|
1 Rays | 76 | 53 | .589 | - | +42 | L3 |
| 2White Sox | 67 | 62 | .519 | 9 | +42 | L1 |
3 Astros | 65 | 65 | .500 | 11.5 | -43 | L1 |
4 Yankees | 73 | 56 | .566 | 3 | +95 | L1 |
5 Red Sox | 70 | 59 | .543 | 6 | +98 | W2 |
6 Rangers | 64 | 66 | .492 | 12.5 | -48 | L1 |
7 Guardians | 64 | 66 | .492 | 12.5 | -14 | W3 |
8 Blue Jays | 64 | 67 | .489 | 13 | -50 | W1 |
| 9Twins | 63 | 67 | .485 | 13.5 | -47 | L2 |
10 Orioles | 63 | 67 | .485 | 13.5 | -33 | W2 |
| 11Mariners | 62 | 68 | .477 | 14.5 | -44 | W2 |
12 Tigers | 61 | 68 | .473 | 15 | +77 | L4 |
13 Royals | 57 | 74 | .435 | 20 | -95 | W7 |
14 Angels | 52 | 78 | .400 | 24.5 | -68 | W1 |
15 Athletics | 50 | 80 | .385 | 26.5 | -188 | W1 |
National League
| Team | W | L | PCT | GB | DIFF | STRK |
|---|---|---|---|---|---|---|
| 1Brewers | 81 | 49 | .623 | - | +163 | W3 |
2 Dodgers | 79 | 51 | .608 | 2 | +147 | W5 |
| 3Braves | 75 | 55 | .577 | 6 | +108 | L2 |
| 4Cubs | 74 | 56 | .569 | 7 | +98 | L3 |
5 Phillies | 72 | 58 | .554 | 9 | +25 | W8 |
6 Padres | 70 | 60 | .538 | 11 | +9 | W2 |
7 Diamondbacks | 68 | 62 | .523 | 13 | +7 | L1 |
8 Marlins | 66 | 64 | .508 | 15 | +17 | W2 |
9 Cardinals | 66 | 65 | .504 | 15.5 | 0 | L2 |
10 Pirates | 63 | 68 | .481 | 18.5 | +29 | L2 |
11 Reds | 62 | 68 | .477 | 19 | -92 | W1 |
12 Nationals | 61 | 70 | .466 | 20.5 | +14 | L3 |
13 Mets | 59 | 71 | .454 | 22 | -39 | W1 |
14 Giants | 52 | 77 | .403 | 28.5 | -79 | L3 |
15 Rockies | 50 | 79 | .388 | 30.5 | -131 | L5 |
CHC
VS
ATL
Pitchers
Ben Brown
Hoby Milner
Phil Maton
Jacob Webb
Daniel Palencia
Catchers
Miguel Amaya
Infielders
Nico Hoerner
Alex Bregman
Michael Busch
Dansby Swanson
Outfielders
Ian Happ
Matt Shaw
Pete Crow-Armstrong
Designated Hitters
Seiya Suzuki
Pitchers
Chris Sale
Reynaldo Lopez
Aaron Bummer
Catchers
Drake Baldwin
Infielders
Ozzie Albies
Matt Olson
Austin Riley
Ha-Seong Kim
Outfielders
Michael Harris II
Mauricio Dubon
Mike Yastrzemski
Designated Hitters
Dominic Smith
Cubs
VS
Braves
Batting
130
Team Games Played
130
4465
At Bats
4395
1108
Hits
1081
626
Runs Batted In
585
170
Home Runs
167
97
Stolen Bases
63
.248
Batting Average
.246
665
Runs
610
219
Doubles
207
20
Triples
9
1877
Total Bases
1807
549
Walks
378
1122
Strikeouts
1052
.337
On Base Percentage
.310
.420
Slugging Percentage
.411
.757
OBP Pct + SLG Pct
.721
130
Games Played
130
130
Games Started
130
66
Hit By Pitch
48
0.0
Wins Above Replacement
0.0
0.0
Offensive Wins Above Replacement
0.0
17
Caught Stealing
21
1
Is Qualified
1
657.8
Runs Created
571.9
5.1
Runs Created Per 27 Outs
4.5
.107
Walks Per Plate Appearance
.078
0.49
Walk To Strikeout Ratio
0.36
.172
Isolated Power
.165
.313
Secondary Average
.261
3.97
Pitches Per Plate Appearance
3.89
409
Extra Base Hits
383
5122
Plate Appearances
4868
26.3
At Bats Per Home Run
26.3
6
Sacrifice Hit
7
35
Sacrifice Flies
37
Pitching
130
Team Games Played
130
40
Quality Starts
49
74
Wins
75
56
Losses
55
29
Saves
39
49
Holds
92
1073
Hits
991
536
Earned runs
463
195
Home Runs
146
391
Walks
442
999
Strikeouts
1106
7.7
Strikeouts Per 9 Innings
8.6
144.7
Pitches Per Start
144.5
1.26
Walks Plus Hits Per Inning Pitched
1.24
4.15
Earned Run Average
3.61
56
Losses
55
1163.0
Innings pitched
1153.0
.569
Win Percentage
.577
50
Save Opportunities
56
.244
Opponent Batting Average
.230
.312
Opponent's On-base pct.
.307
.417
Opponent's Slugging pct.
.378
.729
Opponent's OPB Pct + SLG Pct
.685
4391
At Bats
4301
154
Doubles
164
10
Triples
17
51
Batters Hit
45
69
Stolen Bases
95
130
Games Played
130
0
Complete Games
0
5
Shutouts
8
28
Wild Pitches
26
548
Runs Batted In
482
2
Balks
4
1163.0
Innings pitched
1153.0
7.7
Strikeouts Per 9 Innings
8.6
25
Caught Stealing
17
130
Games Started
130
0.0
Wins Above Replacement
0.0
1
Is Qualified
1
567
Runs
502
536
Earned Runs
463
1832
Total Bases
1627
Fielding
130
Team Games Played
130
1163
Full Innings
1153
4762
Total Chances
4571
3489
Putouts
3459
1225
Assists
1053
48
Errors
59
219
Double Plays
207
0.990
Fielding Percentage
0.987
36.5
Range Factor
35.2
0.0
Zone Rating
0.0
130
Games Played
130
0
Games Started
0
0.0
Defensive Wins Above Replacement
0.0
1
Qualified
1