

Cubs vs Brewers Live Score (7 Sep, 2026)
Game Information
Stage
STD
Season
2026
First Pitch
Mon, Sep 7, 2:10 pm
Venue
American Family Field
Location
Milwaukee, Wisconsin
Venue Type
Indoor
Broadcast
ESPN Unlmtd
Attendance
42,368
Live Situation
1Balls
1Strikes
0Outs
—Pitcher
—At Bat
Pitch Sequence
1
STRIKE LOOKING
Four-seam FB
99 MPH
2
BALL
Knuckle Curve
91 MPH
3
BALL IN PLAY
Knuckle Curve
89 MPH
Injury Report

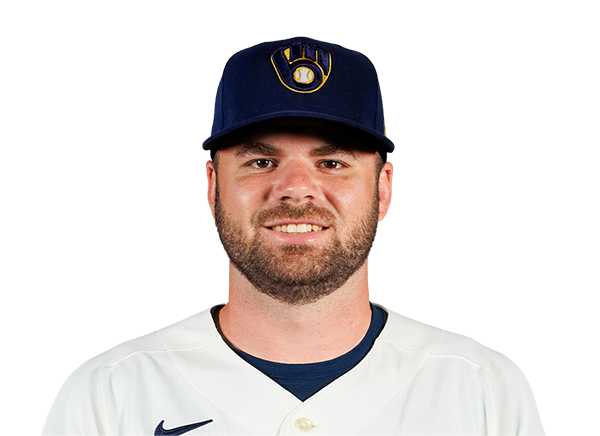
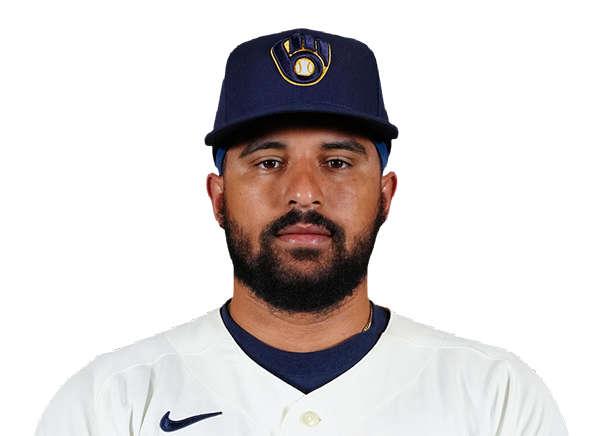
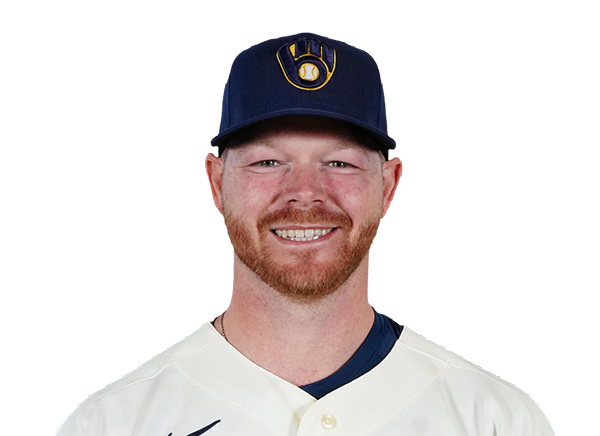

Team Stats
 CHC
MIL


3
Runs
4
6
Hits
6
0
Errors
0
2
Home Runs
0
4
Walks
4
6
Strikeouts
9
Player Box Score
Chicago Cubs
| Player | H-AB | AB | R | H | RBI | HR | BB | K | #P | AVG | OBP | SLG |
|---|---|---|---|---|---|---|---|---|---|---|---|---|
 Pete Crow-Armstrong | 2-4 | 4 | 2 | 2 | 1 | 1 | 0 | 0 | 16 | .281 | .376 | .577 |
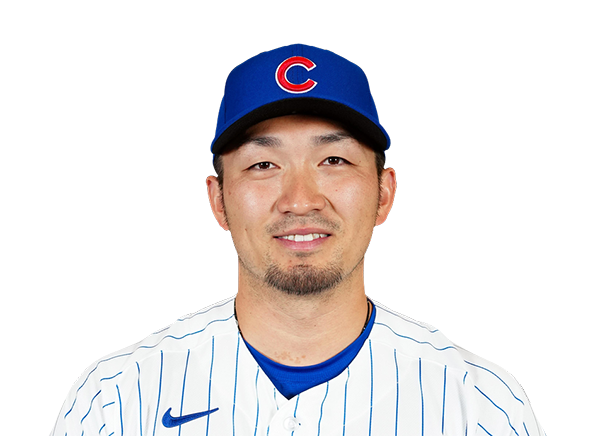 Seiya Suzuki | 0-3 | 3 | 0 | 0 | 0 | 0 | 2 | 1 | 29 | .269 | .369 | .478 |
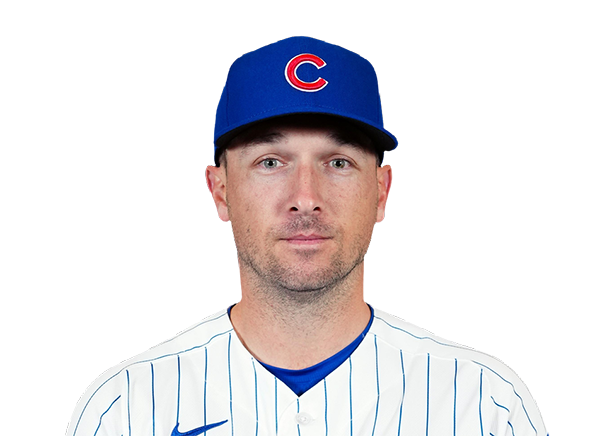 Alex Bregman | 2-3 | 3 | 0 | 2 | 1 | 0 | 1 | 0 | 14 | .262 | .350 | .443 |
 Tyrone Taylor | 1-2 | 2 | 0 | 1 | 0 | 0 | 0 | 1 | 6 | .286 | .335 | .523 |
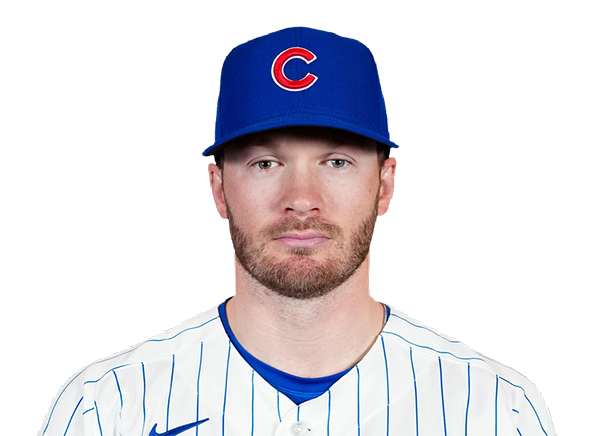 Ian Happ | 0-1 | 1 | 0 | 0 | 0 | 0 | 1 | 0 | 7 | .221 | .327 | .416 |
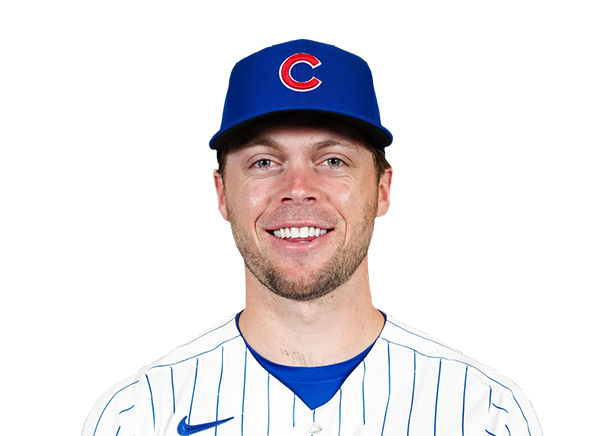 Nico Hoerner | 0-4 | 4 | 0 | 0 | 0 | 0 | 0 | 2 | 15 | .265 | .318 | .359 |
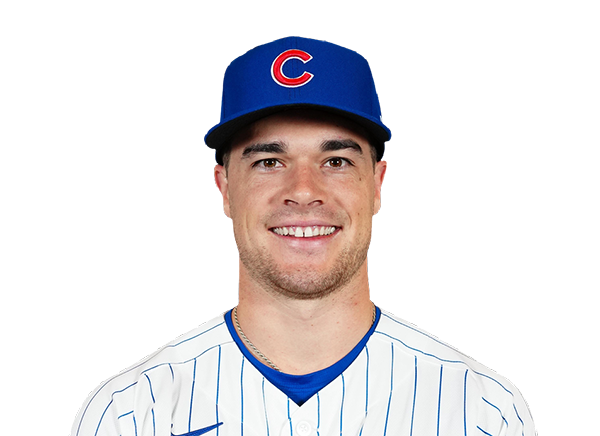 Matt Shaw | 0-3 | 3 | 0 | 0 | 0 | 0 | 0 | 1 | 13 | .242 | .325 | .436 |
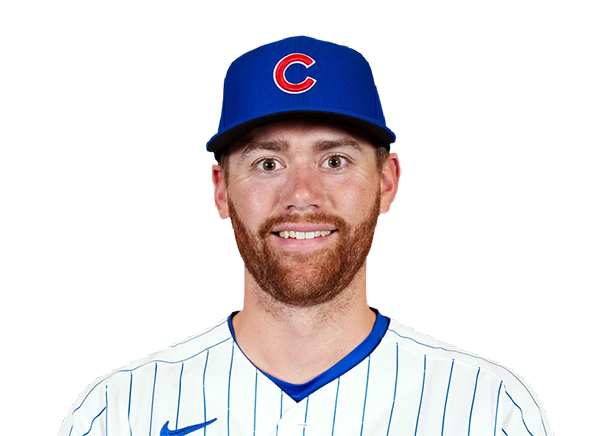 Carson Kelly | 0-4 | 4 | 0 | 0 | 0 | 0 | 0 | 1 | 19 | .257 | .336 | .382 |
 B.J. Murray Jr. | 0-3 | 3 | 0 | 0 | 0 | 0 | 0 | 0 | 12 | .111 | .111 | .111 |
 Michael Busch | 0-1 | 1 | 0 | 0 | 0 | 0 | 0 | 0 | 4 | .236 | .343 | .390 |
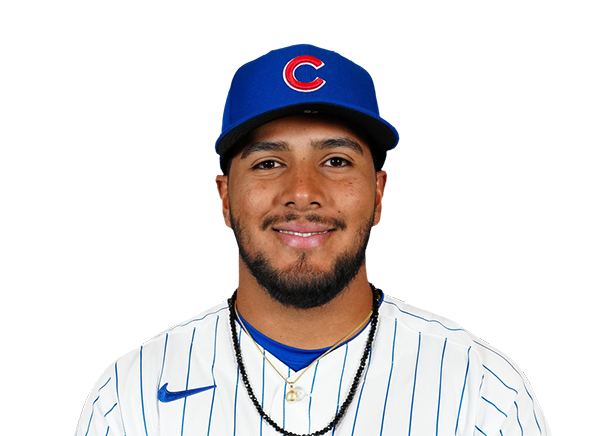 Pedro Ramirez | 1-4 | 4 | 1 | 1 | 1 | 1 | 0 | 0 | 10 | .263 | .324 | .416 |
Milwaukee Brewers
| Player | H-AB | AB | R | H | RBI | HR | BB | K | #P | AVG | OBP | SLG |
|---|---|---|---|---|---|---|---|---|---|---|---|---|
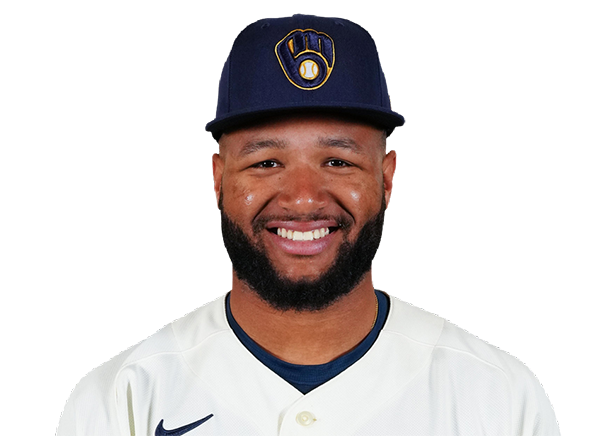 Jackson Chourio | 1-4 | 4 | 1 | 1 | 2 | 0 | 0 | 0 | 12 | .281 | .339 | .471 |
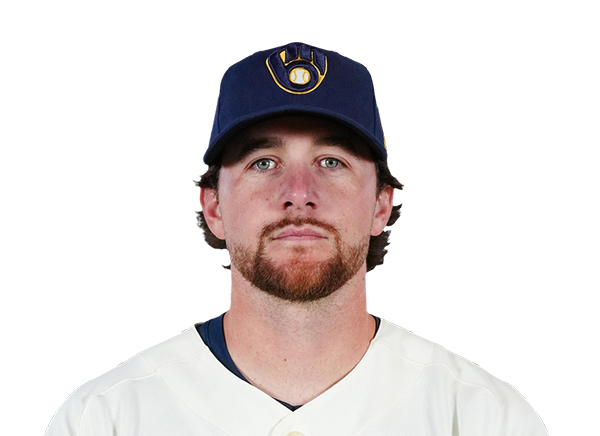 Brice Turang | 0-2 | 2 | 0 | 0 | 0 | 0 | 2 | 1 | 20 | .255 | .352 | .423 |
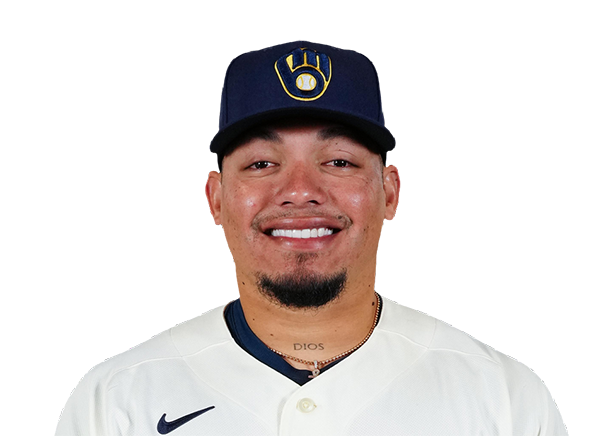 William Contreras | 0-4 | 4 | 0 | 0 | 0 | 0 | 0 | 2 | 14 | .269 | .338 | .404 |
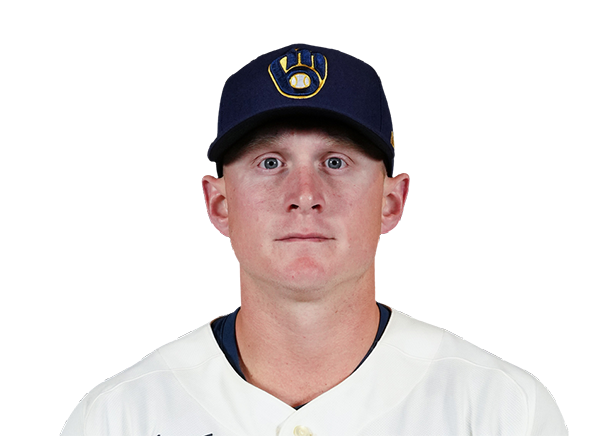 Andrew Vaughn | 1-3 | 3 | 0 | 1 | 0 | 0 | 0 | 2 | 11 | .312 | .399 | .457 |
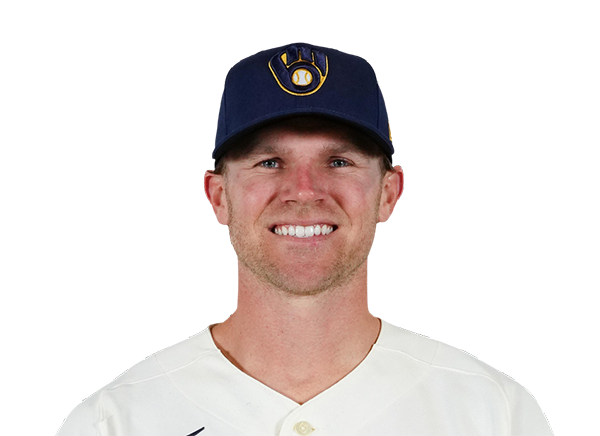 Jake Bauers | 0-0 | 0 | 0 | 0 | 0 | 0 | 1 | 0 | 6 | .270 | .397 | .493 |
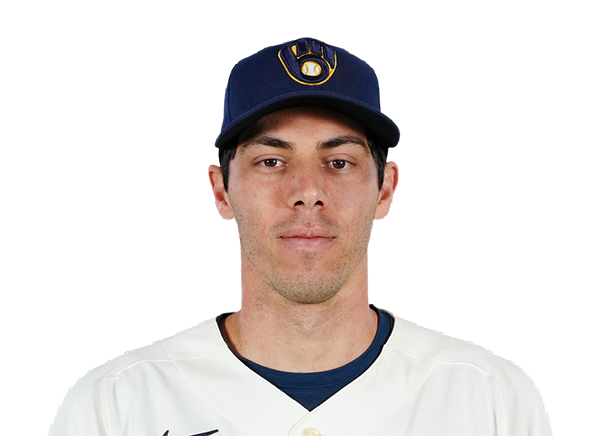 Christian Yelich | 0-3 | 3 | 0 | 0 | 1 | 0 | 0 | 2 | 17 | .239 | .319 | .384 |
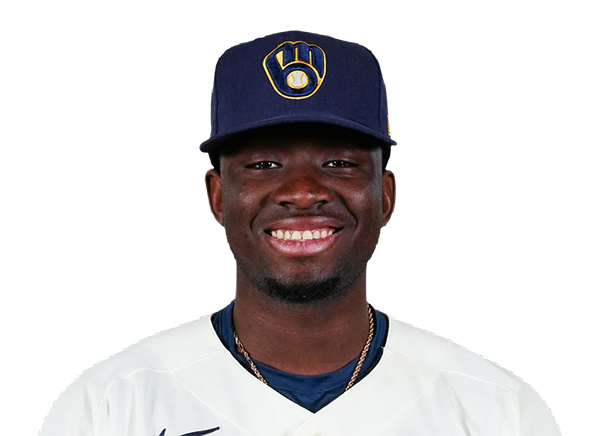 Luis Lara | 1-4 | 4 | 1 | 1 | 0 | 0 | 0 | 1 | 21 | .262 | .337 | .359 |
 Cooper Pratt | 1-2 | 2 | 0 | 1 | 0 | 0 | 0 | 0 | 9 | .274 | .344 | .374 |
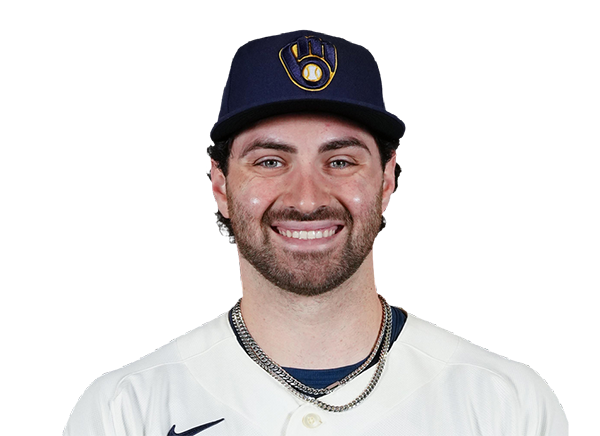 Garrett Mitchell | 1-2 | 2 | 1 | 1 | 1 | 0 | 1 | 0 | 10 | .264 | .356 | .416 |
 Joey Ortiz | 1-3 | 3 | 1 | 1 | 0 | 0 | 0 | 1 | 12 | .255 | .318 | .389 |
Chicago Cubs
| Player | IP | H | R | ER | BB | K | HR | PC-ST | ERA | PC |
|---|---|---|---|---|---|---|---|---|---|---|
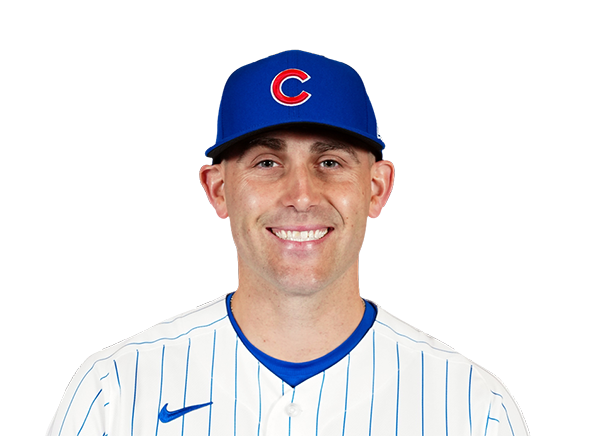 Matthew Boyd | 7.0 | 5 | 3 | 3 | 2 | 7 | 0 | 100-66 | 4.03 | 100 |
 Ryan Zeferjahn | 0.1 | 1 | 1 | 1 | 1 | 1 | 0 | 14-8 | 4.18 | 14 |
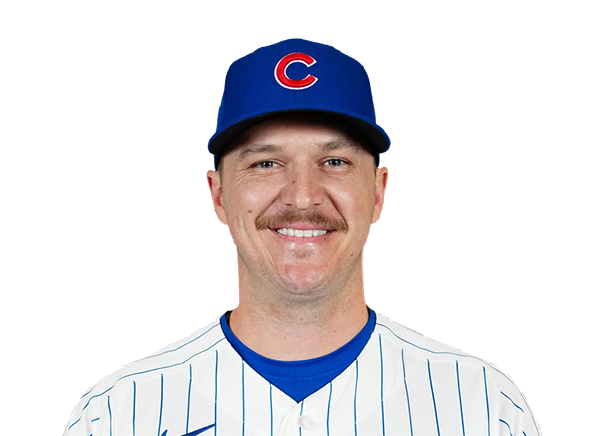 Jacob Webb | 0.2 | 0 | 0 | 0 | 1 | 1 | 0 | 18-8 | 3.12 | 18 |
Milwaukee Brewers
| Player | IP | H | R | ER | BB | K | HR | PC-ST | ERA | PC |
|---|---|---|---|---|---|---|---|---|---|---|
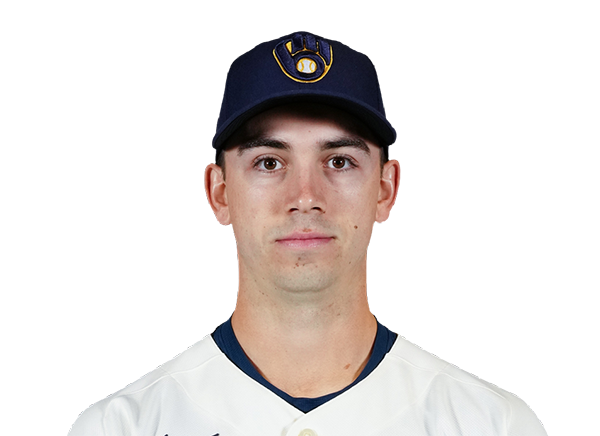 Robert Gasser | 4.2 | 3 | 1 | 1 | 2 | 5 | 1 | 83-56 | 4.43 | 83 |
 Chad Patrick | 1.1 | 0 | 0 | 0 | 1 | 1 | 0 | 18-11 | 3.25 | 18 |
 Aaron Ashby | 1.0 | 2 | 1 | 1 | 1 | 0 | 0 | 20-9 | 3.26 | 20 |
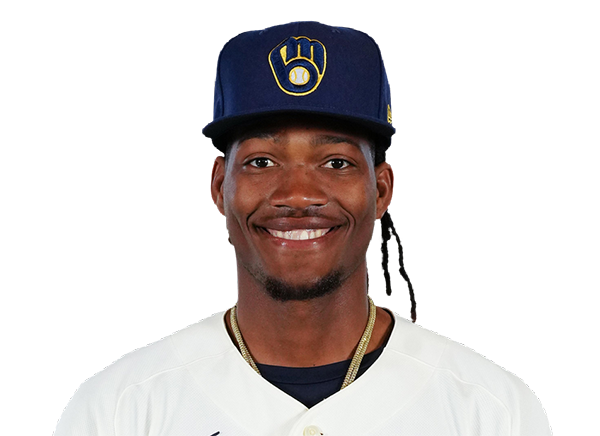 Abner Uribe | 1.0 | 0 | 0 | 0 | 0 | 0 | 0 | 13-8 | 1.92 | 13 |
 Trevor Megill | 1.0 | 1 | 1 | 1 | 0 | 0 | 1 | 11-8 | 2.28 | 11 |
H2H / Season Series
MIL4–3
CHC
CHC2–1
MIL
CHC5–9
MIL
CHC4–9
MIL
CHC17–3
MIL
MIL3–4
CHC
MIL2–8
CHC
MIL6–2
CHC
CHC0–5
MIL
CHC2–5
MIL
Last 5 Games
| Date | Opponent | Result |
|---|---|---|
| Sep 7 | @ MIL | L3–4 |
| Sep 6 |  @ MIA | L3–10 |
| Sep 5 | @ MIA | W6–5 |
| Sep 4 | @ MIA | W6–1 |
| Sep 3 | vs MIL | W2–1 |
| Date | Opponent | Result |
|---|---|---|
| Sep 7 | vs CHC | W4–3 |
| Sep 6 |  @ CIN | L8–12 |
| Sep 5 | @ CIN | L3–5 |
| Sep 4 | @ CIN | W10–7 |
| Sep 3 | @ CHC | L1–2 |
Standings
American League
| Team | W | L | PCT | GB | DIFF | STRK |
|---|---|---|---|---|---|---|
1 Rays | 85 | 58 | .594 | - | +47 | L1 |
2 White Sox | 75 | 68 | .524 | 10 | +49 | W1 |
3 Astros | 73 | 71 | .507 | 12.5 | -38 | L2 |
4 Yankees | 81 | 62 | .566 | 4 | +117 | L1 |
5 Red Sox | 80 | 65 | .552 | 6 | +89 | W5 |
6 Guardians | 73 | 72 | .503 | 13 | -16 | L1 |
7 Blue Jays | 72 | 73 | .497 | 14 | -39 | L2 |
8 Rangers | 71 | 73 | .493 | 14.5 | -44 | W1 |
9 Orioles | 70 | 75 | .483 | 16 | -27 | W1 |
10 Twins | 68 | 76 | .472 | 17.5 | -49 | L2 |
11 Mariners | 67 | 77 | .465 | 18.5 | -71 | W1 |
12 Tigers | 66 | 78 | .458 | 19.5 | +51 | W1 |
13 Royals | 64 | 81 | .441 | 22 | -89 | L1 |
14 Athletics | 58 | 87 | .400 | 28 | -187 | W1 |
15 Angels | 54 | 90 | .375 | 31.5 | -80 | L2 |
National League
| Team | W | L | PCT | GB | DIFF | STRK |
|---|---|---|---|---|---|---|
| 1Brewers | 89 | 56 | .614 | - | +169 | W1 |
2 Dodgers | 87 | 57 | .604 | 1.5 | +155 | W5 |
3 Braves | 85 | 59 | .590 | 3.5 | +119 | L1 |
4 Phillies | 81 | 63 | .563 | 7.5 | +35 | W1 |
| 5Cubs | 81 | 64 | .559 | 8 | +131 | L2 |
6 Diamondbacks | 77 | 68 | .531 | 12 | 0 | W3 |
7 Padres | 76 | 68 | .528 | 12.5 | +9 | W2 |
| 8Marlins | 72 | 73 | .497 | 17 | +10 | L1 |
9 Cardinals | 72 | 73 | .497 | 17 | -10 | L1 |
10 Pirates | 71 | 73 | .493 | 17.5 | +26 | W1 |
| 11Reds | 69 | 75 | .479 | 19.5 | -108 | L1 |
12 Nationals | 67 | 79 | .459 | 22.5 | +8 | L5 |
13 Mets | 66 | 78 | .458 | 22.5 | -43 | W2 |
14 Giants | 60 | 85 | .414 | 29 | -74 | W1 |
15 Rockies | 55 | 88 | .385 | 33 | -140 | L1 |
CHC
VS
MIL
Pitchers
Matthew Boyd
Catchers
Carson Kelly
Infielders
Alex Bregman
Nico Hoerner
B.J. Murray Jr.
Pedro Ramirez
Outfielders
Pete Crow-Armstrong
Tyrone Taylor
Matt Shaw
Designated Hitters
Seiya Suzuki
Pitchers
Robert Gasser
Catchers
William Contreras
Infielders
Brice Turang
Andrew Vaughn
Cooper Pratt
Joey Ortiz
Outfielders
Jackson Chourio
Luis Lara
Garrett Mitchell
Designated Hitters
Christian Yelich
Cubs
VS
Brewers
Batting
145
Team Games Played
145
4991
At Bats
4918
1255
Hits
1259
727
Runs Batted In
689
203
Home Runs
133
104
Stolen Bases
141
.251
Batting Average
.256
771
Runs
730
244
Doubles
253
22
Triples
25
2152
Total Bases
1961
611
Walks
602
1222
Strikeouts
1216
.339
On Base Percentage
.339
.431
Slugging Percentage
.399
.770
OBP Pct + SLG Pct
.738
145
Games Played
145
145
Games Started
145
73
Hit By Pitch
38
0.0
Wins Above Replacement
0.0
0.0
Offensive Wins Above Replacement
0.0
19
Caught Stealing
45
1
Is Qualified
1
757.0
Runs Created
694.9
5.2
Runs Created Per 27 Outs
4.9
.107
Walks Per Plate Appearance
.107
0.50
Walk To Strikeout Ratio
0.50
.180
Isolated Power
.143
.319
Secondary Average
.285
3.97
Pitches Per Plate Appearance
4.00
469
Extra Base Hits
411
5725
Plate Appearances
5638
24.6
At Bats Per Home Run
37.0
9
Sacrifice Hit
33
40
Sacrifice Flies
40
Pitching
145
Team Games Played
145
47
Quality Starts
49
81
Wins
89
64
Losses
56
32
Saves
46
51
Holds
77
1195
Hits
1069
606
Earned runs
509
217
Home Runs
156
442
Walks
466
1120
Strikeouts
1385
7.8
Strikeouts Per 9 Innings
9.6
145.1
Pitches Per Start
146.0
1.26
Walks Plus Hits Per Inning Pitched
1.19
4.21
Earned Run Average
3.54
64
Losses
56
1294.2
Innings pitched
1293.2
.559
Win Percentage
.614
57
Save Opportunities
64
.244
Opponent Batting Average
.223
.313
Opponent's On-base pct.
.298
.417
Opponent's Slugging pct.
.366
.730
Opponent's OPB Pct + SLG Pct
.664
4889
At Bats
4801
171
Doubles
192
10
Triples
14
58
Batters Hit
57
81
Stolen Bases
68
145
Games Played
145
0
Complete Games
1
6
Shutouts
9
31
Wild Pitches
46
619
Runs Batted In
535
3
Balks
6
1294.2
Innings pitched
1293.2
7.8
Strikeouts Per 9 Innings
9.6
28
Caught Stealing
29
145
Games Started
145
0.0
Wins Above Replacement
0.0
1
Is Qualified
1
640
Runs
561
606
Earned Runs
509
2037
Total Bases
1757
Fielding
145
Team Games Played
145
1295
Full Innings
1294
5308
Total Chances
5081
3884
Putouts
3881
1372
Assists
1134
52
Errors
66
244
Double Plays
253
0.990
Fielding Percentage
0.987
36.5
Range Factor
34.9
0.0
Zone Rating
0.0
145
Games Played
145
0
Games Started
0
0.0
Defensive Wins Above Replacement
0.0
1
Qualified
1