

Cubs vs Dodgers Live Score (25 Apr, 2026)
Game Information
Stage
Standard
Season
2026
First Pitch
Sat, Apr 25, 7:15 pm
Venue
Dodger Stadium
Location
Los Angeles, California
Attendance
53,397
Live Situation
0Balls
0Strikes
0Outs
—Pitcher
—At Bat
Pitch Sequence
1
BALL IN PLAY
Four-seam FB
95 MPH
Injury Report
Team Stats
 CHC
LAD

4
Runs
12
9
Hits
14
0
Errors
1
3
Home Runs
1
2
Walks
6
11
Strikeouts
7
Player Box Score
Chicago Cubs
| Player | H-AB | AB | R | H | RBI | HR | BB | K | #P | AVG | OBP | SLG |
|---|---|---|---|---|---|---|---|---|---|---|---|---|
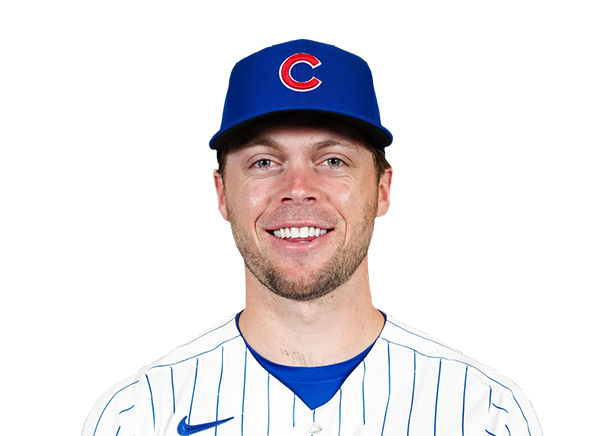 Nico Hoerner |
2-3 | 3 | 0 | 2 | 0 | 0 | 0 | 0 | 12 | .309 | .381 | .482 |
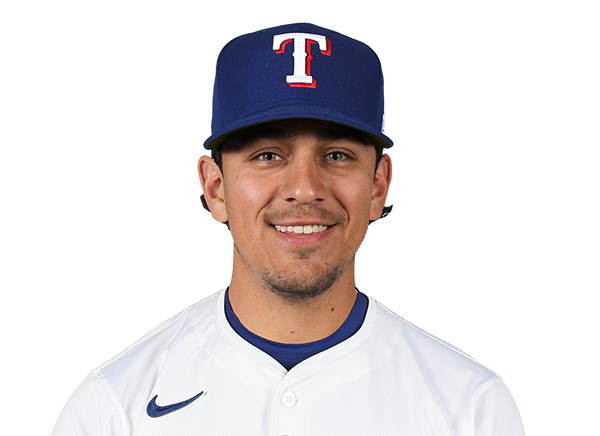 Nicky Lopez |
0-2 | 2 | 0 | 0 | 0 | 0 | 0 | 2 | 14 | .000 | .000 | .000 |
 Michael Busch |
1-5 | 5 | 0 | 1 | 1 | 0 | 0 | 1 | 18 | .208 | .283 | .297 |
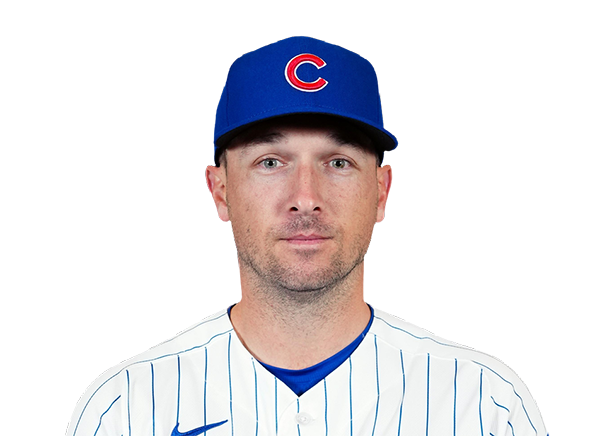 Alex Bregman |
0-3 | 3 | 0 | 0 | 0 | 0 | 0 | 1 | 14 | .259 | .333 | .384 |
 Michael Conforto |
1-1 | 1 | 0 | 1 | 0 | 0 | 0 | 0 | 3 | .333 | .469 | .458 |
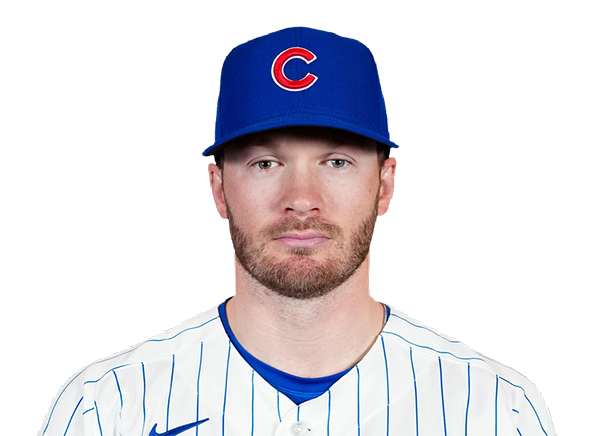 Ian Happ |
0-2 | 2 | 0 | 0 | 0 | 0 | 1 | 2 | 13 | .245 | .357 | .500 |
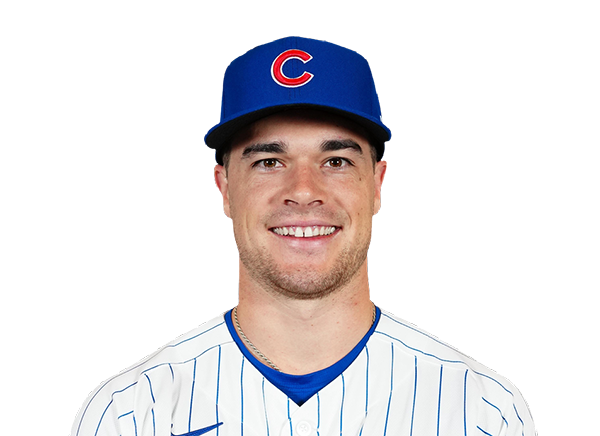 Matt Shaw |
0-1 | 1 | 0 | 0 | 0 | 0 | 0 | 0 | 4 | .300 | .338 | .483 |
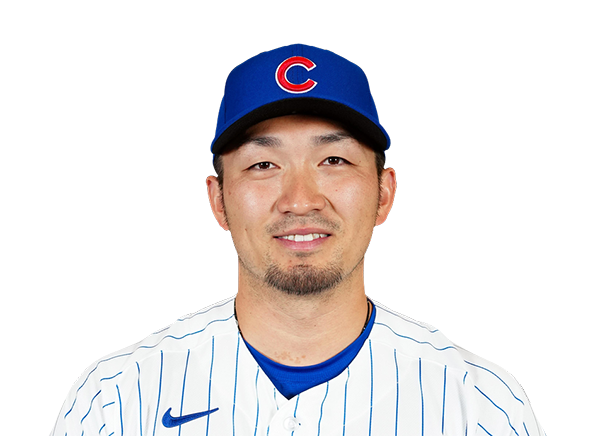 Seiya Suzuki |
3-4 | 4 | 1 | 3 | 1 | 1 | 0 | 0 | 15 | .327 | .439 | .564 |
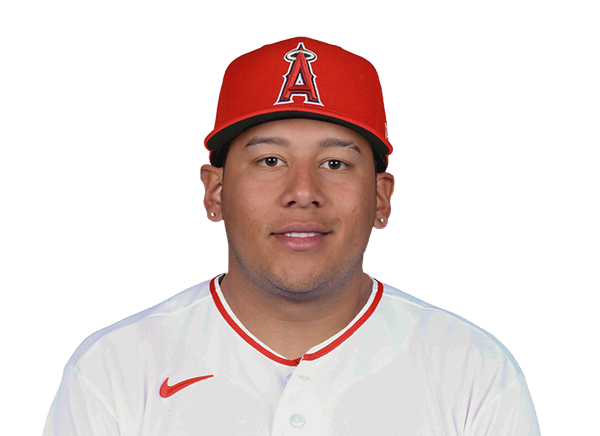 Moises Ballesteros |
1-3 | 3 | 1 | 1 | 1 | 1 | 1 | 0 | 27 | .397 | .446 | .690 |
 Dansby Swanson |
0-4 | 4 | 0 | 0 | 0 | 0 | 0 | 1 | 13 | .200 | .336 | .433 |
 Pete Crow-Armstrong |
0-4 | 4 | 0 | 0 | 0 | 0 | 0 | 4 | 13 | .235 | .291 | .314 |
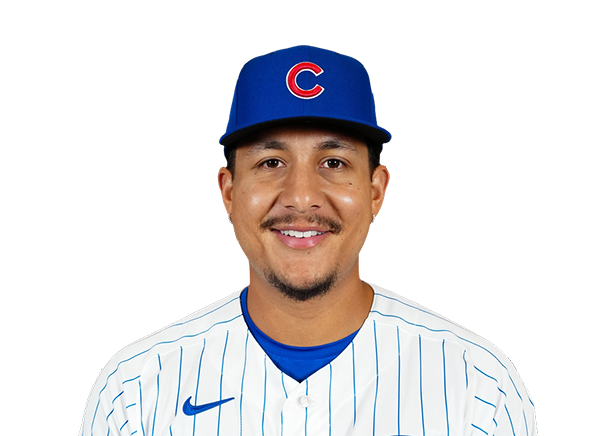 Miguel Amaya |
1-3 | 3 | 2 | 1 | 1 | 1 | 0 | 0 | 16 | .234 | .345 | .383 |
Los Angeles Dodgers
| Player | H-AB | AB | R | H | RBI | HR | BB | K | #P | AVG | OBP | SLG |
|---|---|---|---|---|---|---|---|---|---|---|---|---|
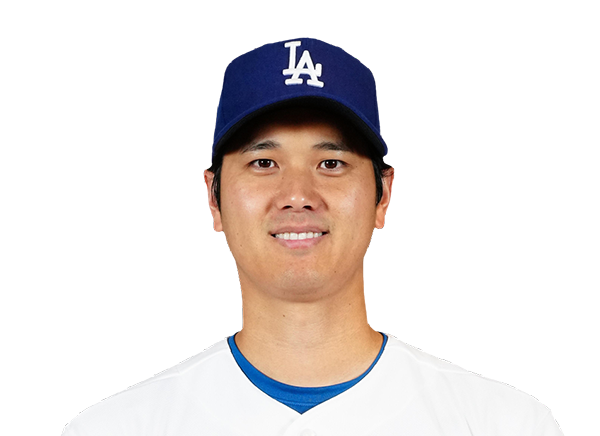 Shohei Ohtani |
1-3 | 3 | 2 | 1 | 0 | 0 | 2 | 0 | 20 | .240 | .371 | .430 |
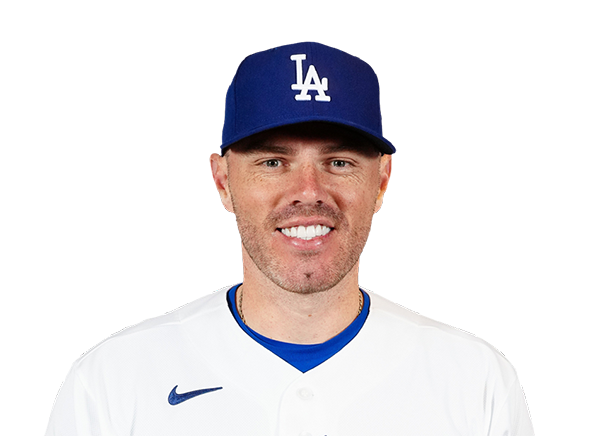 Freddie Freeman |
1-5 | 5 | 1 | 1 | 1 | 0 | 0 | 2 | 17 | .280 | .345 | .460 |
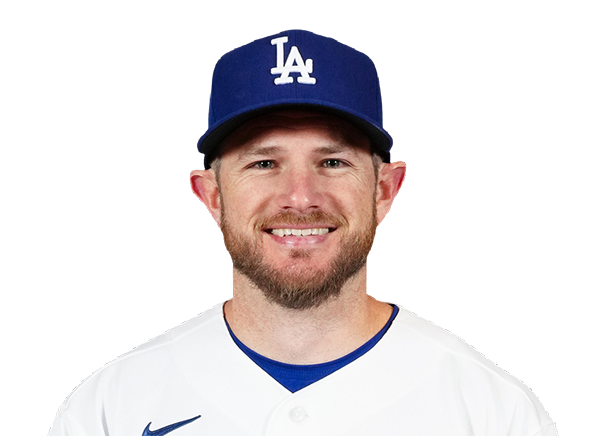 Max Muncy |
1-1 | 1 | 1 | 1 | 2 | 1 | 2 | 0 | 16 | .300 | .394 | .633 |
 Santiago Espinal |
1-2 | 2 | 1 | 1 | 0 | 0 | 0 | 0 | 10 | .250 | .250 | .350 |
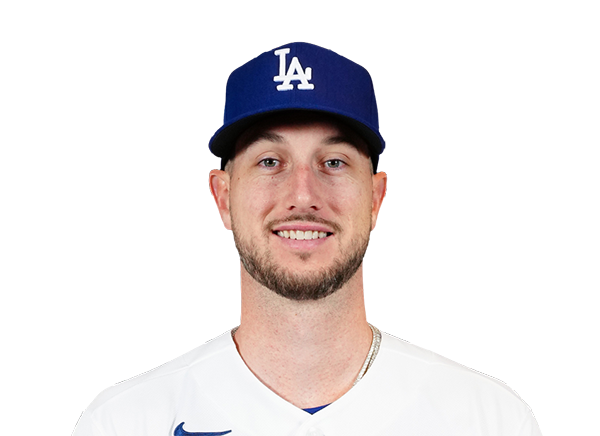 Kyle Tucker |
1-5 | 5 | 1 | 1 | 0 | 0 | 0 | 1 | 20 | .235 | .319 | .363 |
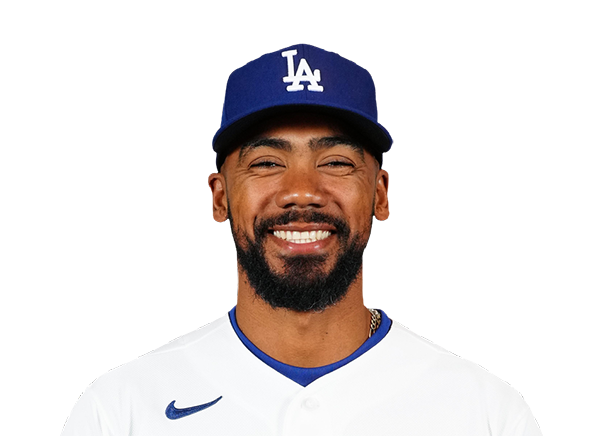 Teoscar Hernandez |
2-3 | 3 | 2 | 2 | 2 | 0 | 1 | 0 | 14 | .247 | .299 | .427 |
 Alex Call |
0-1 | 1 | 0 | 0 | 0 | 0 | 0 | 0 | 7 | .280 | .438 | .360 |
 Dalton Rushing |
1-4 | 4 | 1 | 1 | 1 | 0 | 1 | 2 | 25 | .400 | .475 | 1.057 |
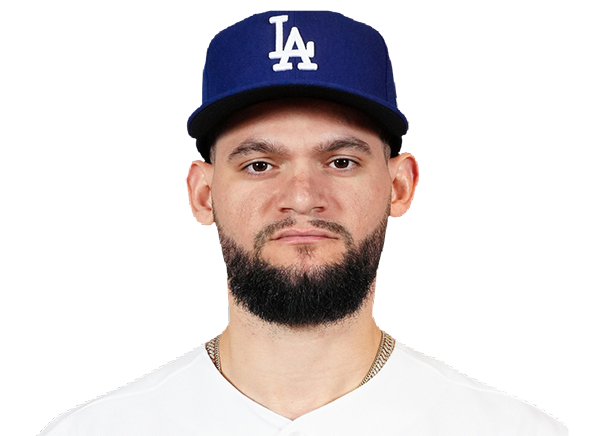 Andy Pages |
2-5 | 5 | 1 | 2 | 3 | 0 | 0 | 0 | 23 | .337 | .383 | .551 |
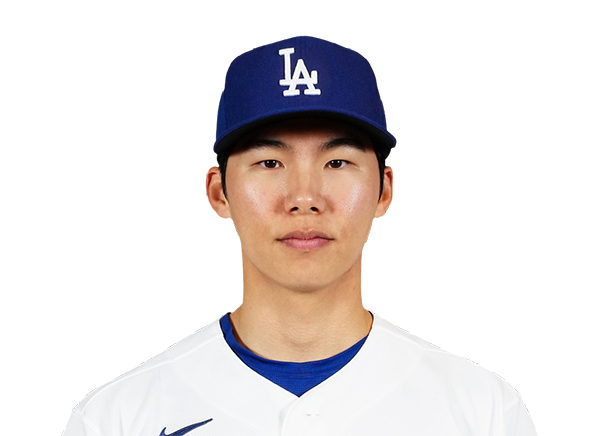 Hyeseong Kim |
2-5 | 5 | 1 | 2 | 1 | 0 | 0 | 1 | 24 | .357 | .429 | .476 |
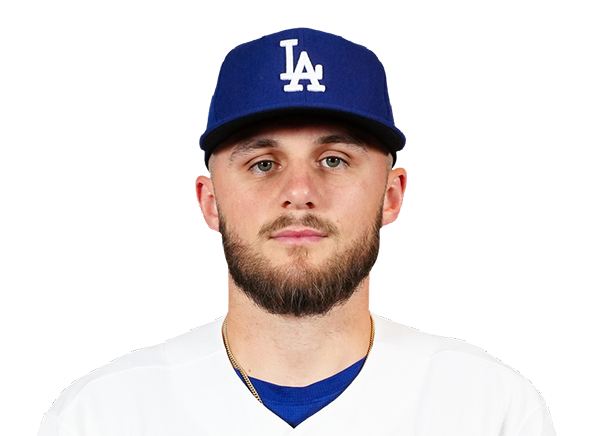 Alex Freeland |
2-4 | 4 | 1 | 2 | 1 | 0 | 0 | 1 | 17 | .239 | .307 | .343 |
Chicago Cubs
| Player | IP | H | R | ER | BB | K | HR | PC-ST | ERA | PC |
|---|---|---|---|---|---|---|---|---|---|---|
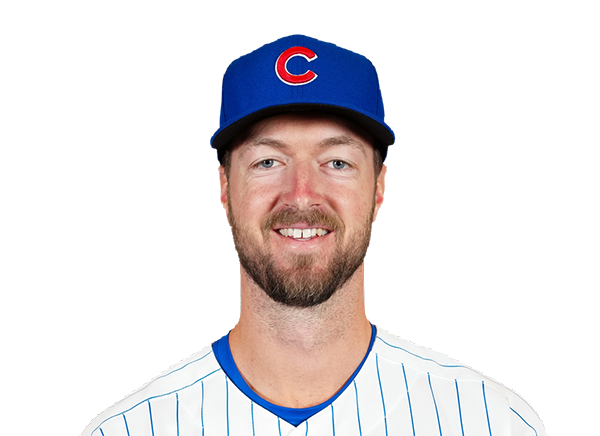 Colin Rea |
3.1 | 6 | 6 | 6 | 4 | 4 | 1 | 92-55 | 4.61 | 92 |
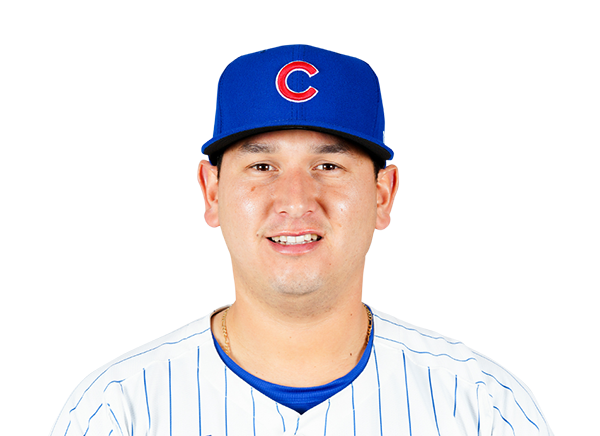 Javier Assad |
2.1 | 7 | 6 | 6 | 2 | 2 | 0 | 70-39 | 7.58 | 70 |
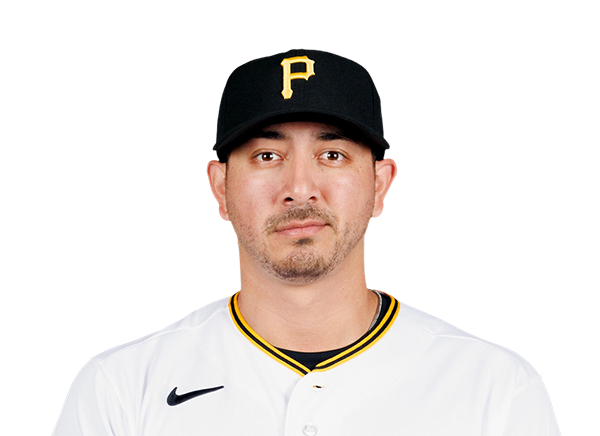 Vince Velasquez |
2.1 | 1 | 0 | 0 | 0 | 1 | 0 | 31-22 | 0.00 | 31 |
Los Angeles Dodgers
| Player | IP | H | R | ER | BB | K | HR | PC-ST | ERA | PC |
|---|---|---|---|---|---|---|---|---|---|---|
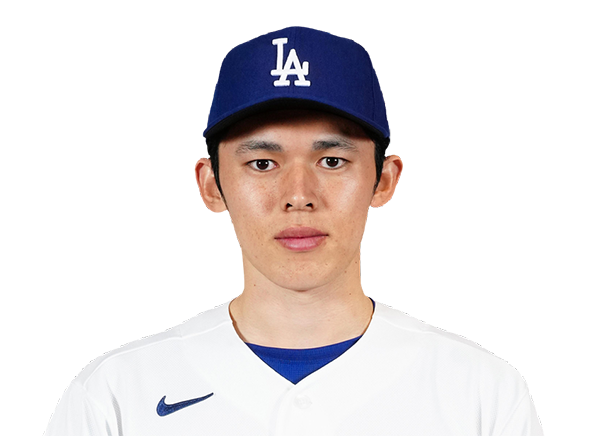 Roki Sasaki |
5.0 | 7 | 4 | 4 | 1 | 5 | 3 | 99-66 | 6.35 | 99 |
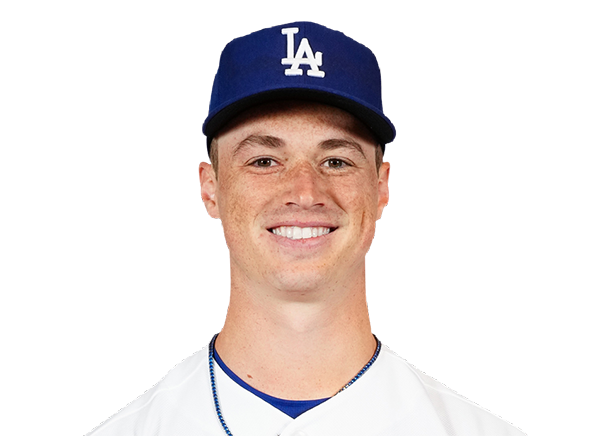 Jack Dreyer |
0.2 | 0 | 0 | 0 | 1 | 2 | 0 | 19-11 | 4.09 | 19 |
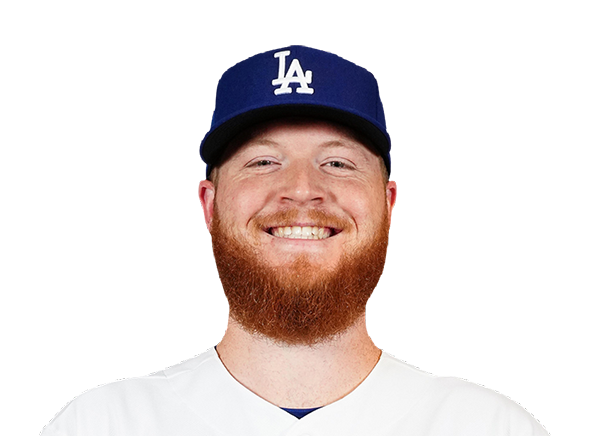 Will Klein |
1.1 | 1 | 0 | 0 | 0 | 2 | 0 | 21-15 | 2.45 | 21 |
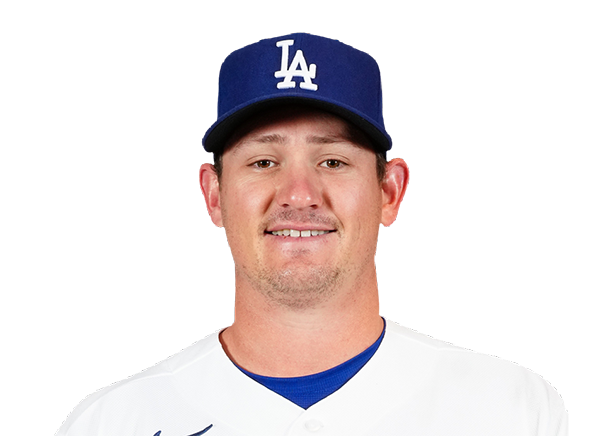 Kyle Hurt |
1.0 | 1 | 0 | 0 | 0 | 1 | 0 | 10-8 | 2.25 | 10 |
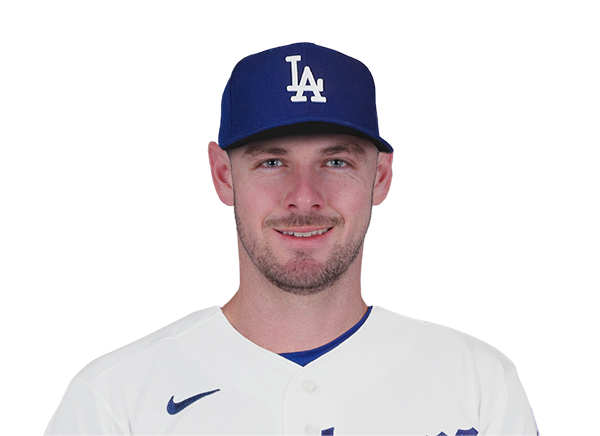 Jake Eder |
1.0 | 0 | 0 | 0 | 0 | 1 | 0 | 13-8 | 4.50 | 13 |
H2H / Season Series
CHC7–6
LAD
CHC5–1
LAD
CHC10–5
LAD
LAD6–0
CHC
LAD12–4
CHC
LAD4–6
CHC
CHC8–14
LAD
LAD2–6
CHC
Last 5 Games
| Date | Opponent | Result |
|---|---|---|
| Aug 22 |  @ SEA | L4–5 |
| Aug 21 | @ SEA | L5–6 |
| Aug 19 |  vs CHW | L0–3 |
| Aug 18 | vs CHW | W4–3 |
| Aug 17 | vs CHW | W7–5 |
| Date | Opponent | Result |
|---|---|---|
| Aug 22 |  vs PIT | W4–3 |
| Aug 21 | vs PIT | W5–4 |
| Aug 19 |  @ COL | W6–4 |
| Aug 18 | @ COL | W7–6 |
| Aug 17 | @ COL | W11–5 |
Standings
American League
| Team | W | L | PCT | GB | DIFF | STRK |
|---|---|---|---|---|---|---|
1 Rays | 76 | 52 | .594 | - | +43 | L2 |
| 2White Sox | 67 | 61 | .523 | 9 | +47 | W1 |
3 Astros | 65 | 64 | .504 | 11.5 | -42 | W1 |
4 Yankees | 73 | 56 | .566 | 3.5 | +95 | L1 |
5 Red Sox | 69 | 59 | .539 | 7 | +97 | W1 |
6 Rangers | 64 | 65 | .496 | 12.5 | -45 | W2 |
7 Blue Jays | 64 | 67 | .489 | 13.5 | -50 | W1 |
8 Twins | 63 | 66 | .488 | 13.5 | -45 | L1 |
9 Guardians | 63 | 66 | .488 | 13.5 | -15 | W2 |
10 Orioles | 62 | 67 | .481 | 14.5 | -34 | W1 |
11 Tigers | 61 | 67 | .477 | 15 | +79 | L3 |
| 12Mariners | 61 | 68 | .473 | 15.5 | -45 | W1 |
13 Royals | 56 | 74 | .431 | 21 | -97 | W6 |
14 Angels | 51 | 78 | .395 | 25.5 | -71 | L1 |
15 Athletics | 49 | 80 | .380 | 27.5 | -189 | L5 |
National League
| Team | W | L | PCT | GB | DIFF | STRK |
|---|---|---|---|---|---|---|
1 Brewers | 81 | 49 | .623 | - | +163 | W3 |
| 2Dodgers | 78 | 51 | .605 | 2.5 | +146 | W4 |
3 Braves | 75 | 55 | .577 | 6 | +108 | L2 |
| 4Cubs | 74 | 55 | .574 | 6.5 | +99 | L2 |
5 Phillies | 72 | 58 | .554 | 9 | +25 | W8 |
6 Padres | 69 | 60 | .535 | 11.5 | +7 | W1 |
7 Diamondbacks | 68 | 61 | .527 | 12.5 | +13 | W2 |
8 Marlins | 66 | 64 | .508 | 15 | +17 | W2 |
9 Cardinals | 66 | 65 | .504 | 15.5 | 0 | L2 |
| 10Pirates | 63 | 67 | .485 | 18 | +30 | L1 |
11 Reds | 61 | 68 | .473 | 19.5 | -98 | L2 |
12 Nationals | 61 | 70 | .466 | 20.5 | +14 | L3 |
13 Mets | 58 | 71 | .450 | 22.5 | -44 | L1 |
14 Giants | 52 | 76 | .406 | 28 | -78 | L2 |
| 15Rockies | 50 | 78 | .391 | 30 | -130 | L4 |
CHC
VS
LAD
Pitchers
Colin Rea
Javier Assad
Vince Velasquez
Catchers
Miguel Amaya
Infielders
Nico Hoerner
Nicky Lopez
Michael Busch
Alex Bregman
Matt Shaw
Dansby Swanson
Outfielders
Michael Conforto
Ian Happ
Seiya Suzuki
Pete Crow-Armstrong
Designated Hitters
Moises Ballesteros
Pitchers
Roki Sasaki
Jack Dreyer
Will Klein
Kyle Hurt
Jake Eder
Catchers
Dalton Rushing
Infielders
Freddie Freeman
Max Muncy
Santiago Espinal
Hyeseong Kim
Alex Freeland
Outfielders
Kyle Tucker
Teoscar Hernandez
Alex Call
Andy Pages
Designated Hitters
Shohei Ohtani
Cubs
VS
Dodgers
Batting
129
Team Games Played
129
4434
At Bats
4354
1101
Hits
1127
622
Runs Batted In
610
168
Home Runs
167
96
Stolen Bases
50
.248
Batting Average
.259
661
Runs
645
216
Doubles
211
20
Triples
14
1861
Total Bases
1867
546
Walks
476
1111
Strikeouts
1014
.337
On Base Percentage
.335
.420
Slugging Percentage
.429
.757
OBP Pct + SLG Pct
.764
129
Games Played
129
129
Games Started
129
65
Hit By Pitch
44
0.0
Wins Above Replacement
0.0
0.0
Offensive Wins Above Replacement
0.0
17
Caught Stealing
18
1
Is Qualified
1
652.7
Runs Created
627.0
5.1
Runs Created Per 27 Outs
5.0
.107
Walks Per Plate Appearance
.097
0.49
Walk To Strikeout Ratio
0.47
.171
Isolated Power
.170
.312
Secondary Average
.287
3.97
Pitches Per Plate Appearance
3.93
404
Extra Base Hits
392
5086
Plate Appearances
4931
26.4
At Bats Per Home Run
26.1
6
Sacrifice Hit
12
34
Sacrifice Flies
42
Pitching
129
Team Games Played
129
39
Quality Starts
68
74
Wins
78
55
Losses
51
29
Saves
36
47
Holds
84
1065
Hits
928
531
Earned runs
470
193
Home Runs
148
389
Walks
403
989
Strikeouts
1168
7.7
Strikeouts Per 9 Innings
9.2
144.8
Pitches Per Start
143.8
1.26
Walks Plus Hits Per Inning Pitched
1.16
4.14
Earned Run Average
3.70
55
Losses
51
1154.1
Innings pitched
1142.2
.574
Win Percentage
.605
49
Save Opportunities
55
.244
Opponent Batting Average
.218
.312
Opponent's On-base pct.
.293
.417
Opponent's Slugging pct.
.372
.729
Opponent's OPB Pct + SLG Pct
.665
4357
At Bats
4249
152
Doubles
188
10
Triples
10
50
Batters Hit
55
69
Stolen Bases
76
129
Games Played
129
0
Complete Games
1
5
Shutouts
10
28
Wild Pitches
30
543
Runs Batted In
473
2
Balks
4
1154.1
Innings pitched
1142.2
7.7
Strikeouts Per 9 Innings
9.2
25
Caught Stealing
20
129
Games Started
129
0.0
Wins Above Replacement
0.0
1
Is Qualified
1
562
Runs
499
531
Earned Runs
470
1816
Total Bases
1580
Fielding
129
Team Games Played
129
1154
Full Innings
1143
4725
Total Chances
4523
3463
Putouts
3428
1214
Assists
1043
48
Errors
52
216
Double Plays
211
0.990
Fielding Percentage
0.989
36.5
Range Factor
35.2
0.0
Zone Rating
0.0
129
Games Played
129
0
Games Started
0
0.0
Defensive Wins Above Replacement
0.0
1
Qualified
1