

Cubs vs Marlins Live Score (4 Sep, 2026)
Game Information
Stage
STD
Season
2026
First Pitch
Fri, Sep 4, 7:10 pm
Venue
loanDepot park
Location
Miami, Florida
Venue Type
Indoor
Broadcast
MLB.TV
Attendance
17,470
Live Situation
3Balls
3Strikes
0Outs
—Pitcher
—At Bat
Pitch Sequence
1
STRIKE FOUL
Sinker
92 MPH
2
BALL
Curve
77 MPH
3
BALL
Cutter
87 MPH
4
STRIKE FOUL
Cutter
88 MPH
5
BALL
Sinker
93 MPH
6
STRIKE SWINGING
Cutter
88 MPH
Injury Report




Team Stats
 CHC
MIA


6
Runs
1
9
Hits
4
0
Errors
0
1
Home Runs
0
6
Walks
2
7
Strikeouts
7
Player Box Score
Chicago Cubs
| Player | H-AB | AB | R | H | RBI | HR | BB | K | #P | AVG | OBP | SLG |
|---|---|---|---|---|---|---|---|---|---|---|---|---|
 Pete Crow-Armstrong | 1-4 | 4 | 2 | 1 | 0 | 0 | 1 | 1 | 19 | .280 | .375 | .570 |
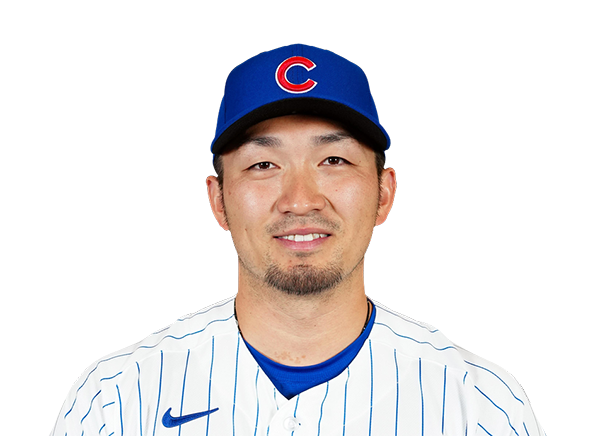 Seiya Suzuki | 0-5 | 5 | 0 | 0 | 0 | 0 | 0 | 0 | 17 | .270 | .365 | .481 |
 Michael Busch | 1-4 | 4 | 2 | 1 | 1 | 1 | 1 | 1 | 23 | .236 | .345 | .391 |
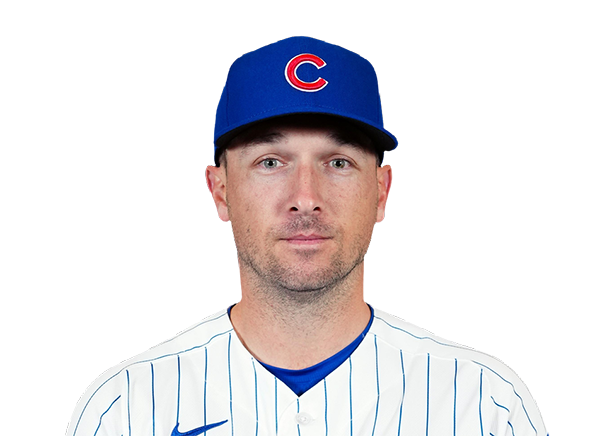 Alex Bregman | 2-4 | 4 | 1 | 2 | 0 | 0 | 1 | 0 | 19 | .262 | .347 | .446 |
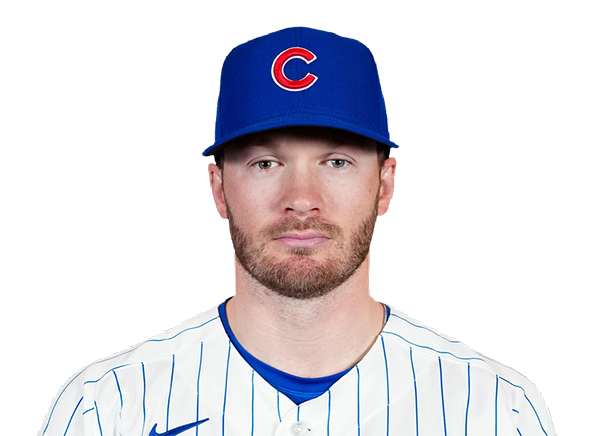 Ian Happ | 1-4 | 4 | 1 | 1 | 1 | 0 | 1 | 2 | 21 | .219 | .324 | .416 |
 Nico Hoerner | 3-4 | 4 | 0 | 3 | 1 | 0 | 0 | 0 | 18 | .263 | .318 | .359 |
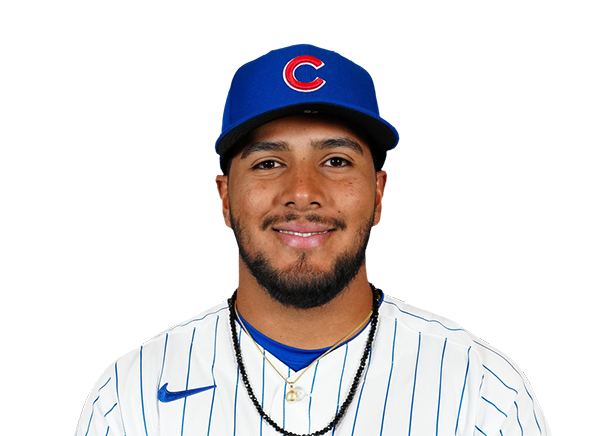 Pedro Ramirez | 0-3 | 3 | 0 | 0 | 2 | 0 | 0 | 1 | 14 | .277 | .340 | .424 |
 Michael Conforto | 1-2 | 2 | 0 | 1 | 0 | 0 | 2 | 0 | 26 | .234 | .328 | .472 |
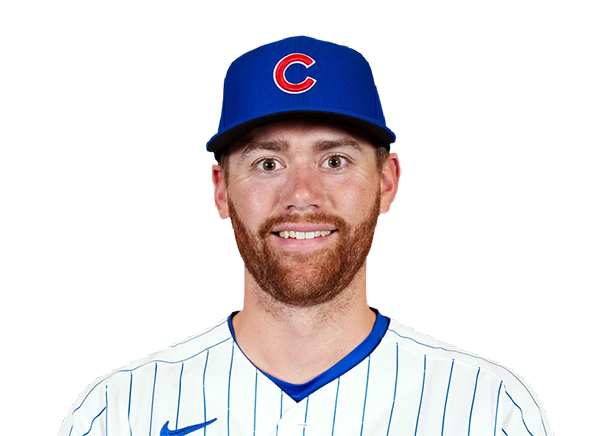 Carson Kelly | 0-4 | 4 | 0 | 0 | 0 | 0 | 0 | 2 | 18 | .260 | .340 | .388 |
Miami Marlins
| Player | H-AB | AB | R | H | RBI | HR | BB | K | #P | AVG | OBP | SLG |
|---|---|---|---|---|---|---|---|---|---|---|---|---|
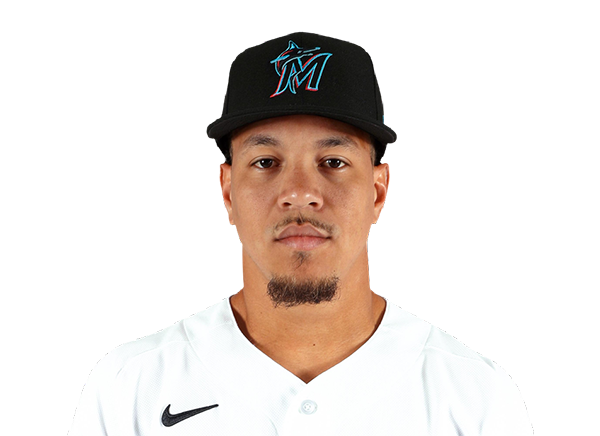 Heriberto Hernandez | 0-4 | 4 | 0 | 0 | 0 | 0 | 0 | 2 | 21 | .230 | .313 | .467 |
 Otto Lopez | 0-4 | 4 | 0 | 0 | 0 | 0 | 0 | 0 | 16 | .300 | .336 | .438 |
 Griffin Conine | 2-4 | 4 | 1 | 2 | 0 | 0 | 0 | 0 | 18 | .254 | .354 | .479 |
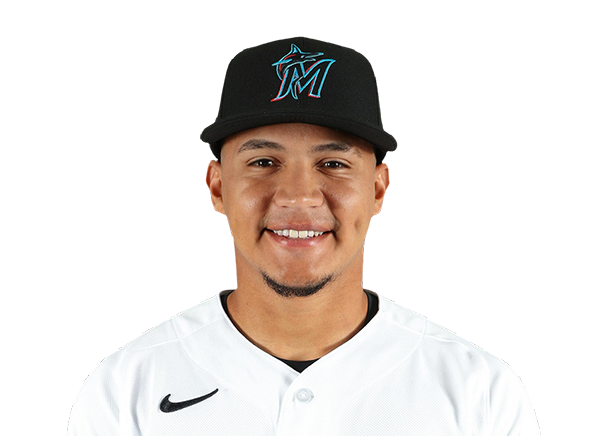 Javier Sanoja | 1-4 | 4 | 0 | 1 | 0 | 0 | 0 | 0 | 12 | .287 | .327 | .429 |
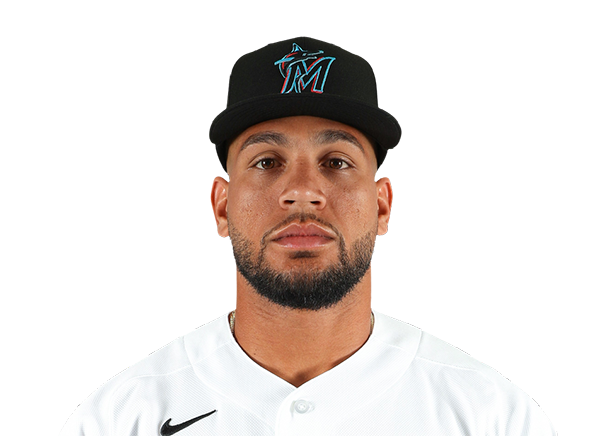 Agustin Ramirez | 0-4 | 4 | 0 | 0 | 0 | 0 | 0 | 0 | 13 | .225 | .319 | .331 |
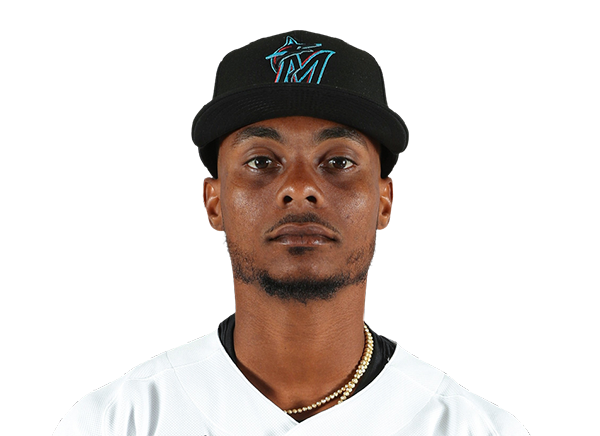 Esteury Ruiz | 0-4 | 4 | 0 | 0 | 1 | 0 | 0 | 3 | 21 | .230 | .351 | .402 |
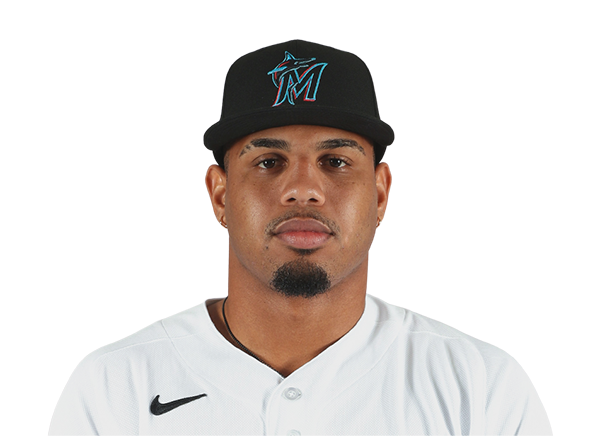 Deyvison De Los Santos | 1-2 | 2 | 0 | 1 | 0 | 0 | 0 | 0 | 7 | .364 | .364 | .545 |
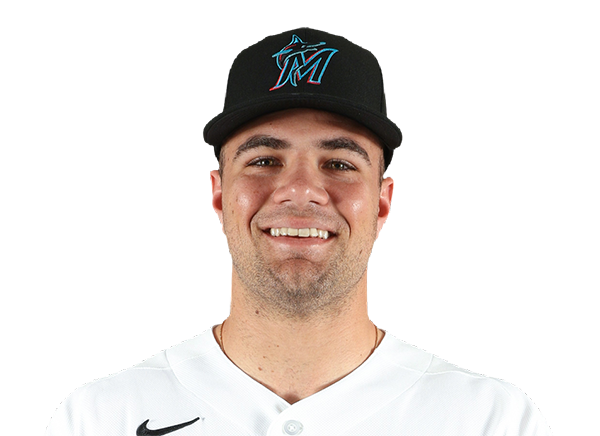 Jakob Marsee | 0-0 | 0 | 0 | 0 | 0 | 0 | 1 | 0 | 5 | .210 | .331 | .330 |
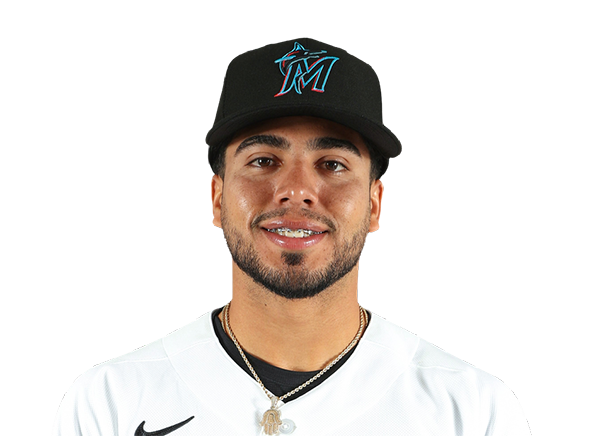 Jared Serna | 0-2 | 2 | 0 | 0 | 0 | 0 | 0 | 0 | 5 | .200 | .286 | .200 |
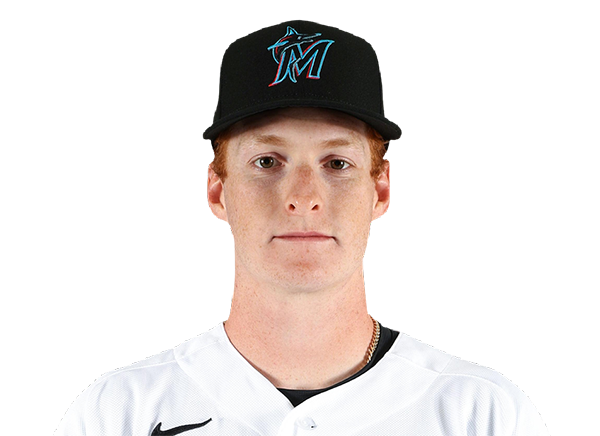 Owen Caissie | 0-0 | 0 | 0 | 0 | 0 | 0 | 1 | 0 | 8 | .223 | .288 | .416 |
 Graham Pauley | 0-0 | 0 | 0 | 0 | 0 | 0 | 0 | 0 | 0 | .198 | .230 | .345 |
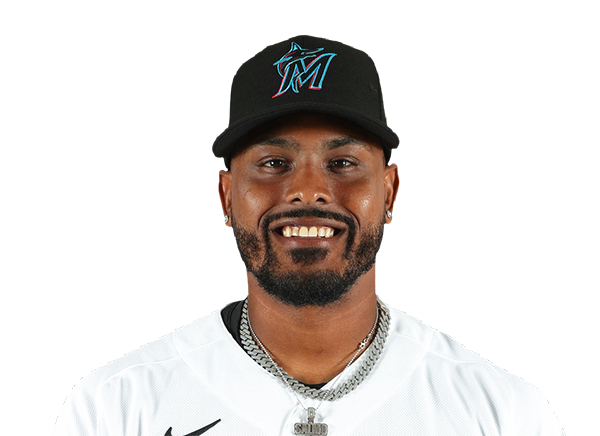 Brian Navarreto | 0-2 | 2 | 0 | 0 | 0 | 0 | 0 | 1 | 10 | .114 | .184 | .205 |
 Joe Mack | 0-1 | 1 | 0 | 0 | 0 | 0 | 0 | 1 | 4 | .233 | .285 | .405 |
Chicago Cubs
| Player | IP | H | R | ER | BB | K | HR | PC-ST | ERA | PC |
|---|---|---|---|---|---|---|---|---|---|---|
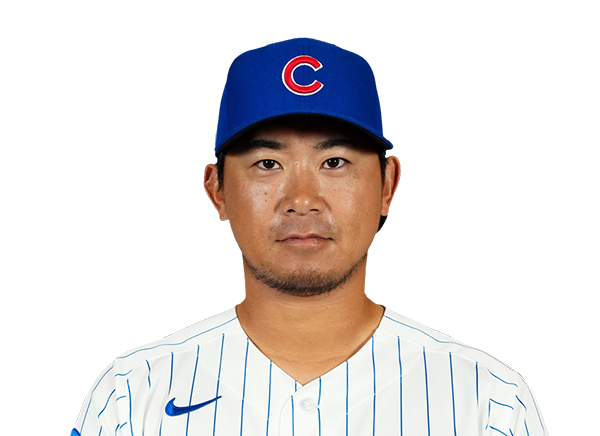 Shota Imanaga | 6.0 | 3 | 1 | 1 | 0 | 4 | 0 | 94-64 | 3.91 | 94 |
 Aaron Civale | 3.0 | 1 | 0 | 0 | 2 | 3 | 0 | 46-28 | 4.37 | 46 |
Miami Marlins
| Player | IP | H | R | ER | BB | K | HR | PC-ST | ERA | PC |
|---|---|---|---|---|---|---|---|---|---|---|
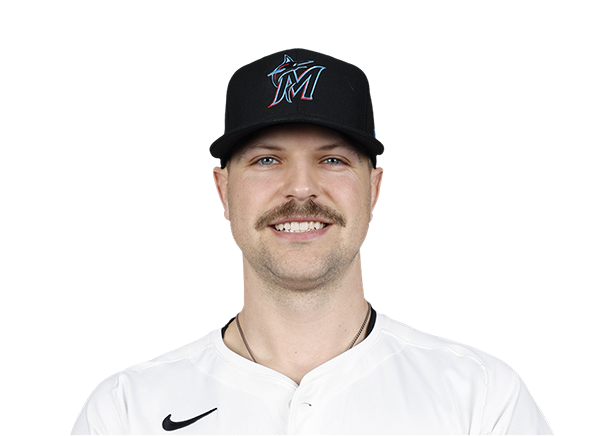 Janson Junk | 5.0 | 3 | 1 | 1 | 1 | 4 | 0 | 75-50 | 4.00 | 75 |
 Jack Ralston | 0.1 | 0 | 3 | 3 | 3 | 0 | 0 | 17-2 | 5.68 | 17 |
 Josh Ekness | 0.2 | 2 | 0 | 0 | 1 | 0 | 0 | 17-10 | 2.61 | 17 |
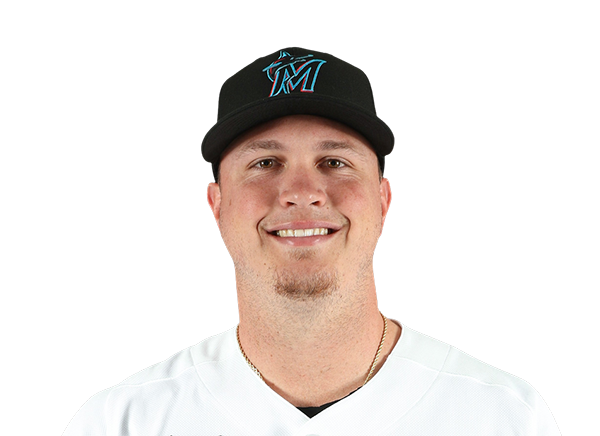 Bradley Blalock | 3.0 | 4 | 2 | 2 | 1 | 3 | 1 | 66-50 | 6.00 | 66 |
H2H / Season Series
MIA1–6
CHC
Last 5 Games
| Date | Opponent | Result |
|---|---|---|
| Sep 4 | @ MIA | W6–1 |
| Sep 3 |  vs MIL | W2–1 |
| Sep 2 | vs MIL | L5–9 |
| Sep 1 | vs MIL | L4–9 |
| Aug 31 | vs MIL | W17–3 |
| Date | Opponent | Result |
|---|---|---|
| Sep 4 | vs CHC | L1–6 |
| Sep 3 |  @ KC | L3–7 |
| Sep 2 | @ KC | W9–6 |
| Sep 1 | @ KC | W6–3 |
| Aug 31 |  @ WSH | L3–6 |
Standings
American League
| Team | W | L | PCT | GB | DIFF | STRK |
|---|---|---|---|---|---|---|
1 Rays | 83 | 57 | .593 | - | +45 | L2 |
2 White Sox | 73 | 67 | .521 | 10 | +39 | L2 |
3 Astros | 72 | 69 | .511 | 11.5 | -38 | W2 |
4 Yankees | 80 | 60 | .571 | 3 | +115 | W2 |
5 Red Sox | 76 | 65 | .539 | 7.5 | +78 | W1 |
6 Guardians | 71 | 70 | .504 | 12.5 | -10 | W1 |
7 Rangers | 70 | 71 | .496 | 13.5 | -42 | W1 |
8 Blue Jays | 70 | 71 | .496 | 13.5 | -41 | W2 |
9 Orioles | 69 | 72 | .489 | 14.5 | -21 | L3 |
10 Twins | 67 | 73 | .479 | 16 | -38 | L1 |
11 Mariners | 66 | 75 | .468 | 17.5 | -68 | L1 |
12 Tigers | 64 | 76 | .457 | 19 | +46 | L1 |
| 13Royals | 63 | 78 | .447 | 20.5 | -85 | W1 |
14 Athletics | 55 | 86 | .390 | 28.5 | -191 | W2 |
15 Angels | 53 | 87 | .379 | 30 | -80 | L2 |
National League
| Team | W | L | PCT | GB | DIFF | STRK |
|---|---|---|---|---|---|---|
| 1Brewers | 87 | 54 | .617 | - | +171 | L1 |
2 Braves | 83 | 57 | .593 | 3.5 | +118 | W1 |
3 Dodgers | 83 | 57 | .593 | 3.5 | +147 | W1 |
4 Phillies | 79 | 61 | .564 | 7.5 | +36 | L1 |
| 5Cubs | 79 | 62 | .560 | 8 | +133 | W1 |
6 Diamondbacks | 74 | 67 | .525 | 13 | -1 | W1 |
7 Padres | 73 | 67 | .521 | 13.5 | +10 | L2 |
| 8Marlins | 71 | 70 | .504 | 16 | +14 | L1 |
9 Cardinals | 70 | 71 | .496 | 17 | -9 | L1 |
10 Pirates | 69 | 72 | .489 | 18 | +29 | W1 |
11 Reds | 67 | 73 | .479 | 19.5 | -108 | W2 |
| 12Nationals | 67 | 75 | .472 | 20.5 | +14 | L1 |
13 Mets | 63 | 77 | .450 | 23.5 | -50 | W1 |
14 Giants | 58 | 83 | .411 | 29 | -73 | L1 |
15 Rockies | 54 | 86 | .386 | 32.5 | -140 | W2 |
CHC
VS
MIA
Pitchers
Shota Imanaga
Catchers
Carson Kelly
Infielders
Michael Busch
Alex Bregman
Nico Hoerner
Pedro Ramirez
Outfielders
Pete Crow-Armstrong
Seiya Suzuki
Ian Happ
Designated Hitters
Michael Conforto
Pitchers
Janson Junk
Catchers
Brian Navarreto
Infielders
Otto Lopez
Javier Sanoja
Deyvison De Los Santos
Jared Serna
Outfielders
Heriberto Hernandez
Griffin Conine
Esteury Ruiz
Designated Hitters
Agustin Ramirez
Cubs
VS
Marlins
Batting
142
Team Games Played
142
4892
At Bats
4716
1229
Hits
1166
716
Runs Batted In
587
199
Home Runs
144
102
Stolen Bases
146
.251
Batting Average
.247
759
Runs
616
239
Doubles
219
22
Triples
30
2109
Total Bases
1877
598
Walks
486
1202
Strikeouts
1167
.339
On Base Percentage
.325
.431
Slugging Percentage
.398
.770
OBP Pct + SLG Pct
.723
142
Games Played
142
142
Games Started
142
71
Hit By Pitch
77
0.0
Wins Above Replacement
0.0
0.0
Offensive Wins Above Replacement
0.0
18
Caught Stealing
43
1
Is Qualified
1
741.2
Runs Created
634.0
5.2
Runs Created Per 27 Outs
4.6
.107
Walks Per Plate Appearance
.091
0.50
Walk To Strikeout Ratio
0.42
.180
Isolated Power
.151
.319
Secondary Average
.276
3.97
Pitches Per Plate Appearance
3.82
460
Extra Base Hits
393
5608
Plate Appearances
5345
24.6
At Bats Per Home Run
32.8
7
Sacrifice Hit
21
39
Sacrifice Flies
44
Pitching
142
Team Games Played
142
46
Quality Starts
46
80
Wins
71
62
Losses
71
31
Saves
31
50
Holds
80
1172
Hits
1086
587
Earned runs
550
213
Home Runs
142
425
Walks
480
1099
Strikeouts
1149
7.8
Strikeouts Per 9 Innings
8.3
145.0
Pitches Per Start
143.7
1.26
Walks Plus Hits Per Inning Pitched
1.26
4.16
Earned Run Average
3.97
62
Losses
71
1269.2
Innings pitched
1246.2
.563
Win Percentage
.500
55
Save Opportunities
50
.244
Opponent Batting Average
.232
.312
Opponent's On-base pct.
.311
.417
Opponent's Slugging pct.
.376
.728
Opponent's OPB Pct + SLG Pct
.686
4797
At Bats
4683
168
Doubles
203
10
Triples
22
55
Batters Hit
69
77
Stolen Bases
117
142
Games Played
142
0
Complete Games
1
6
Shutouts
13
31
Wild Pitches
44
600
Runs Batted In
569
3
Balks
4
1269.2
Innings pitched
1246.2
7.8
Strikeouts Per 9 Innings
8.3
28
Caught Stealing
37
142
Games Started
142
0.0
Wins Above Replacement
0.0
1
Is Qualified
1
621
Runs
607
587
Earned Runs
550
1999
Total Bases
1759
Fielding
142
Team Games Played
142
1270
Full Innings
1247
5207
Total Chances
5016
3809
Putouts
3740
1346
Assists
1186
52
Errors
90
239
Double Plays
219
0.990
Fielding Percentage
0.982
36.5
Range Factor
35.6
0.0
Zone Rating
0.0
142
Games Played
142
0
Games Started
0
0.0
Defensive Wins Above Replacement
0.0
1
Qualified
1