

Cubs vs Marlins Live Score (5 Sep, 2026)
Game Information
Stage
STD
Season
2026
First Pitch
Sat, Sep 5, 4:10 pm
Venue
loanDepot park
Location
Miami, Florida
Venue Type
Indoor
Broadcast
MLB.TV
Attendance
26,141
Live Situation
1Balls
1Strikes
0Outs
—Pitcher
—At Bat
Pitch Sequence
1
BALL
Sweeper
84 MPH
2
STRIKE FOUL
Sinker
97 MPH
3
BALL IN PLAY
Sweeper
85 MPH
Injury Report



Team Stats
 CHC
MIA

6
Runs
5
13
Hits
6
0
Errors
0
1
Home Runs
2
6
Walks
7
9
Strikeouts
7
Player Box Score
Chicago Cubs
| Player | H-AB | AB | R | H | RBI | HR | BB | K | #P | AVG | OBP | SLG |
|---|---|---|---|---|---|---|---|---|---|---|---|---|
 Pete Crow-Armstrong |
1-4 | 4 | 0 | 1 | 1 | 0 | 1 | 2 | 23 | .279 | .375 | .568 |
 Seiya Suzuki |
1-3 | 3 | 1 | 1 | 0 | 0 | 2 | 1 | 24 | .270 | .368 | .480 |
 Michael Busch |
2-5 | 5 | 1 | 2 | 1 | 0 | 0 | 1 | 16 | .237 | .345 | .393 |
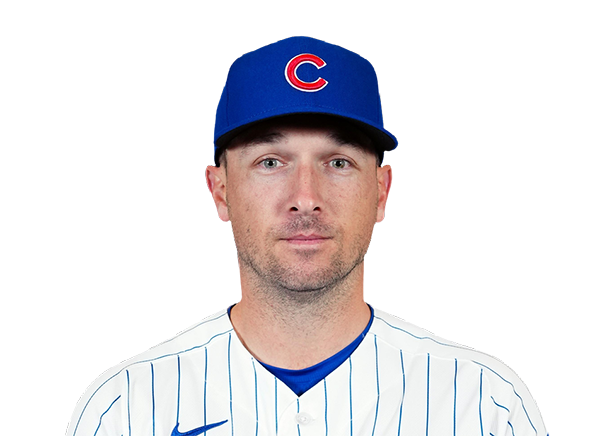 Alex Bregman |
0-3 | 3 | 0 | 0 | 0 | 0 | 1 | 1 | 20 | .260 | .348 | .443 |
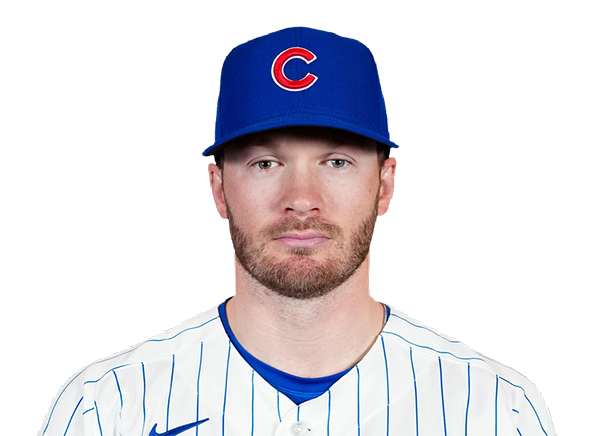 Ian Happ |
2-4 | 4 | 0 | 2 | 2 | 0 | 1 | 1 | 30 | .221 | .326 | .416 |
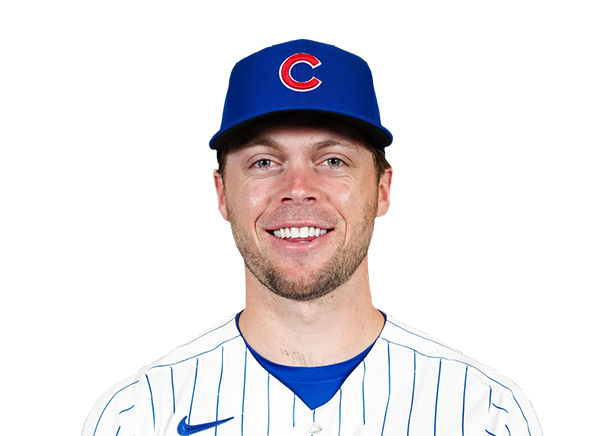 Nico Hoerner |
3-5 | 5 | 0 | 3 | 1 | 0 | 0 | 1 | 18 | .266 | .320 | .362 |
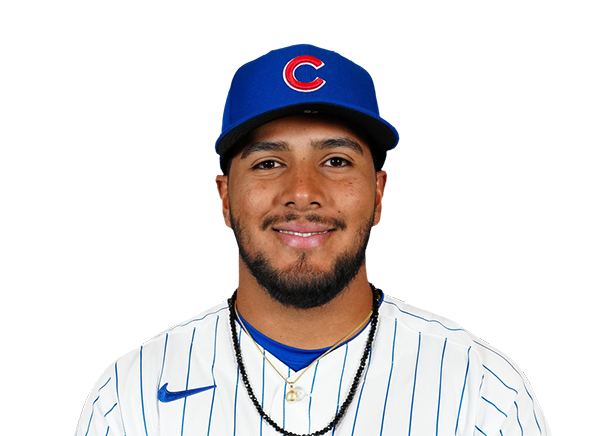 Pedro Ramirez |
0-5 | 5 | 0 | 0 | 0 | 0 | 0 | 1 | 16 | .269 | .332 | .412 |
 Michael Conforto |
2-3 | 3 | 2 | 2 | 1 | 1 | 0 | 1 | 18 | .240 | .332 | .489 |
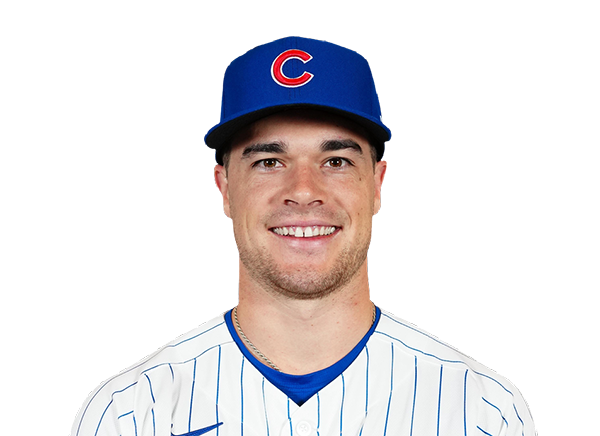 Matt Shaw |
0-1 | 1 | 0 | 0 | 0 | 0 | 1 | 0 | 8 | .248 | .333 | .448 |
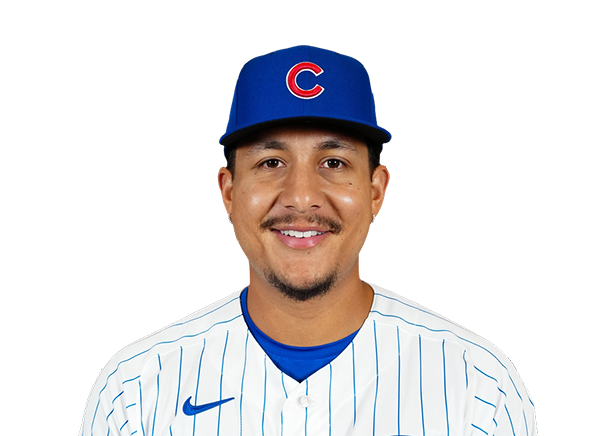 Miguel Amaya |
2-3 | 3 | 2 | 2 | 0 | 0 | 0 | 0 | 11 | .236 | .344 | .364 |
Miami Marlins
| Player | H-AB | AB | R | H | RBI | HR | BB | K | #P | AVG | OBP | SLG |
|---|---|---|---|---|---|---|---|---|---|---|---|---|
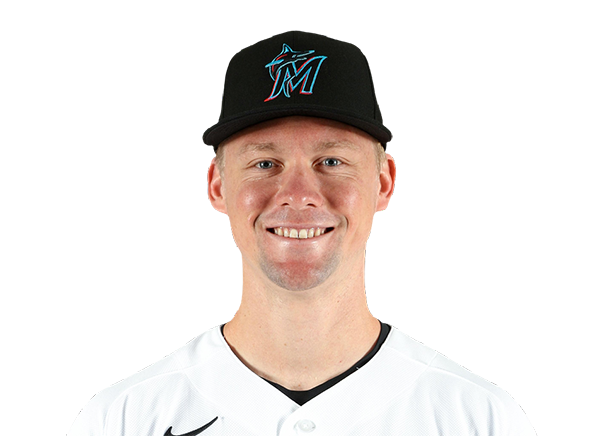 Kyle Stowers |
2-4 | 4 | 1 | 2 | 1 | 1 | 1 | 1 | 17 | .250 | .336 | .479 |
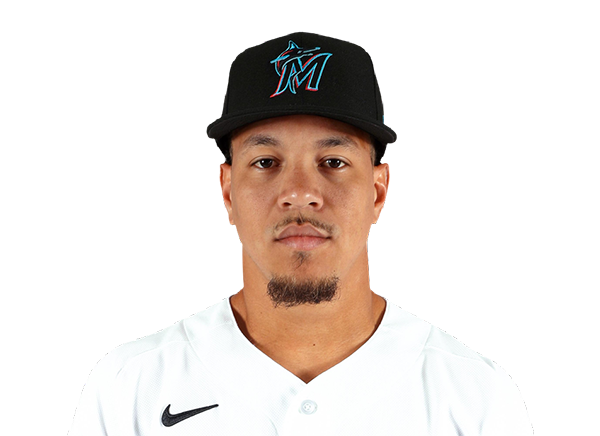 Heriberto Hernandez |
0-4 | 4 | 0 | 0 | 0 | 0 | 0 | 2 | 13 | .227 | .312 | .462 |
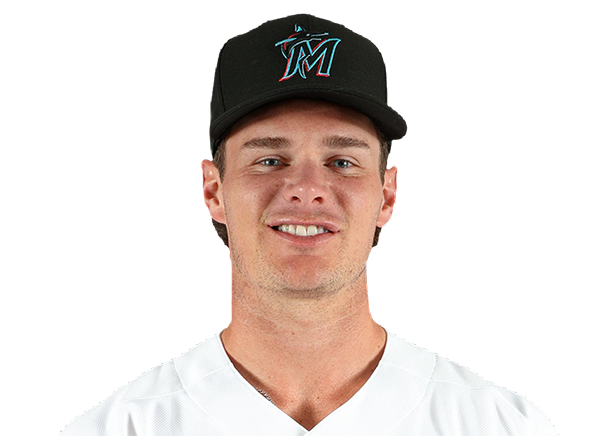 Griffin Conine |
1-2 | 2 | 2 | 1 | 2 | 1 | 3 | 0 | 25 | .256 | .363 | .493 |
 Otto Lopez |
1-3 | 3 | 1 | 1 | 0 | 0 | 1 | 0 | 23 | .300 | .338 | .439 |
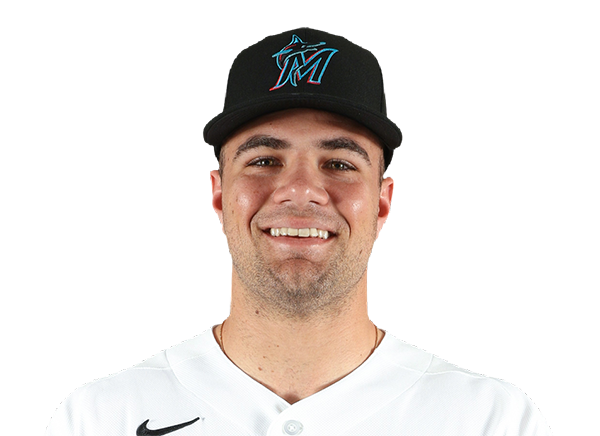 Jakob Marsee |
0-3 | 3 | 0 | 0 | 0 | 0 | 1 | 0 | 22 | .208 | .331 | .328 |
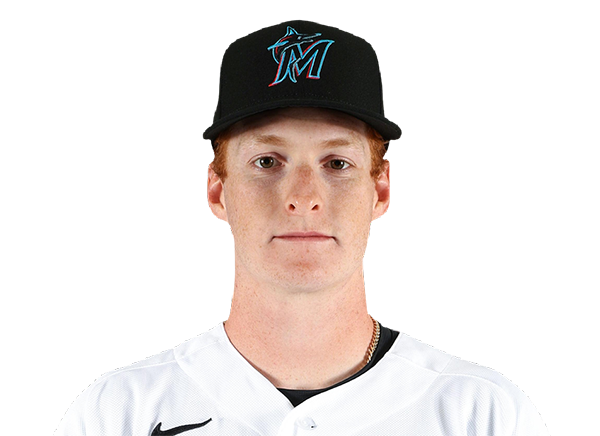 Owen Caissie |
0-3 | 3 | 0 | 0 | 1 | 0 | 0 | 1 | 12 | .220 | .285 | .412 |
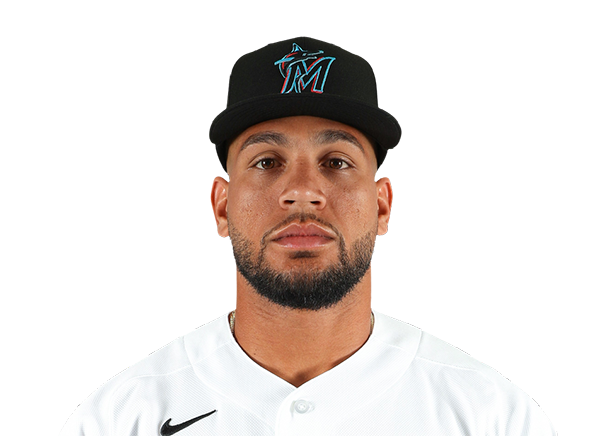 Agustin Ramirez |
0-1 | 1 | 0 | 0 | 0 | 0 | 0 | 1 | 3 | .223 | .317 | .330 |
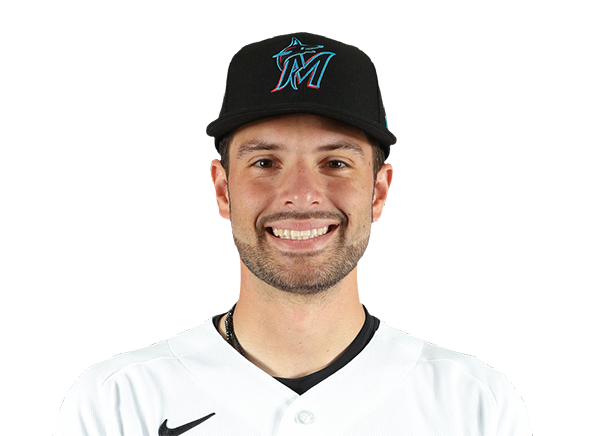 Joe Mack |
0-3 | 3 | 0 | 0 | 1 | 0 | 0 | 1 | 10 | .231 | .282 | .400 |
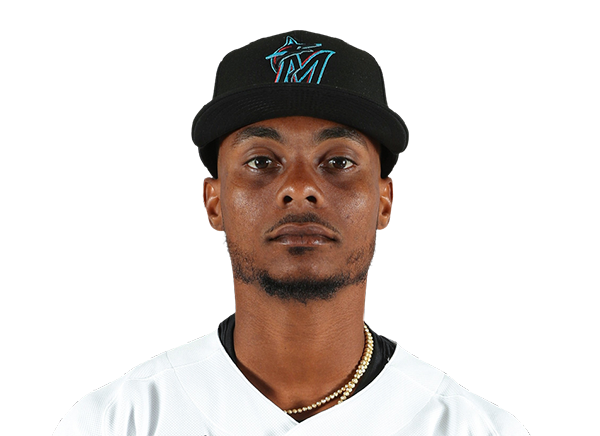 Esteury Ruiz |
1-1 | 1 | 0 | 1 | 0 | 0 | 0 | 0 | 1 | .234 | .354 | .411 |
 Graham Pauley |
0-2 | 2 | 0 | 0 | 0 | 0 | 1 | 1 | 12 | .195 | .232 | .339 |
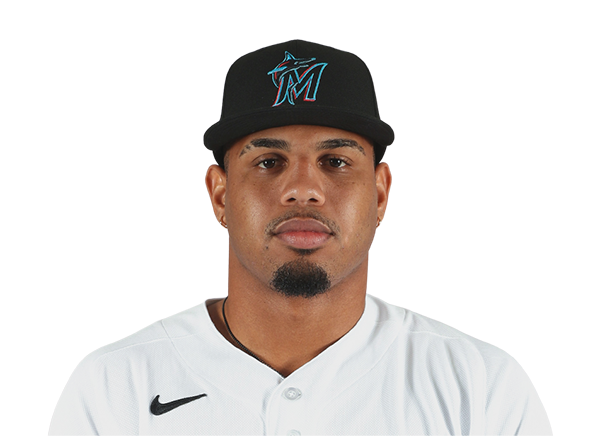 Deyvison De Los Santos |
0-1 | 1 | 0 | 0 | 0 | 0 | 0 | 0 | 3 | .333 | .333 | .500 |
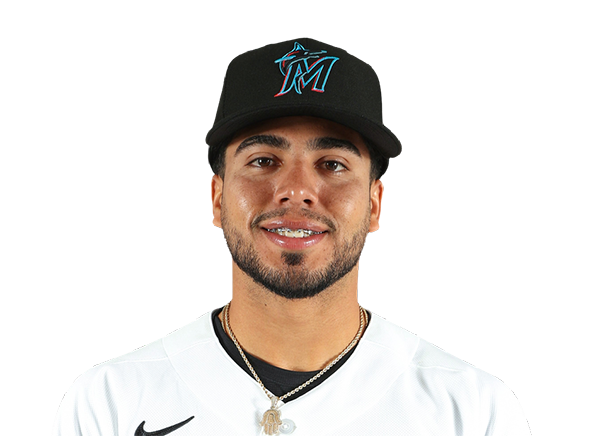 Jared Serna |
0-0 | 0 | 0 | 0 | 0 | 0 | 0 | 0 | 0 | .200 | .286 | .200 |
 Javier Sanoja |
1-4 | 4 | 1 | 1 | 0 | 0 | 0 | 0 | 14 | .286 | .326 | .427 |
Chicago Cubs
| Player | IP | H | R | ER | BB | K | HR | PC-ST | ERA | PC |
|---|---|---|---|---|---|---|---|---|---|---|
 Javier Assad |
4.2 | 3 | 3 | 3 | 5 | 3 | 0 | 88-51 | 3.58 | 88 |
 Caleb Thielbar |
1.1 | 1 | 1 | 1 | 1 | 2 | 1 | 27-16 | 5.04 | 27 |
 Trent Thornton |
0.2 | 1 | 1 | 1 | 0 | 0 | 1 | 13-6 | 3.55 | 13 |
 Ryan Rolison |
0.2 | 1 | 0 | 0 | 0 | 1 | 0 | 8-6 | 2.89 | 8 |
 Ryan Zeferjahn |
1.2 | 0 | 0 | 0 | 1 | 1 | 0 | 19-11 | 4.06 | 19 |
Miami Marlins
| Player | IP | H | R | ER | BB | K | HR | PC-ST | ERA | PC |
|---|---|---|---|---|---|---|---|---|---|---|
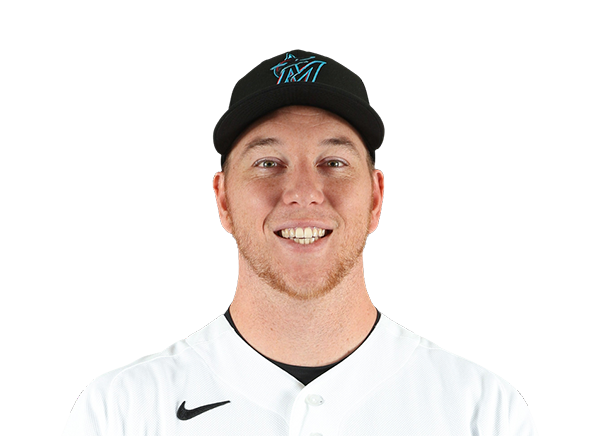 Ryan Gusto |
4.2 | 10 | 5 | 5 | 2 | 5 | 1 | 100-67 | 4.23 | 100 |
 Victor Vodnik |
0.2 | 1 | 1 | 1 | 0 | 0 | 0 | 12-6 | 5.03 | 12 |
 Calvin Faucher |
0.2 | 1 | 0 | 0 | 1 | 1 | 0 | 18-12 | 3.73 | 18 |
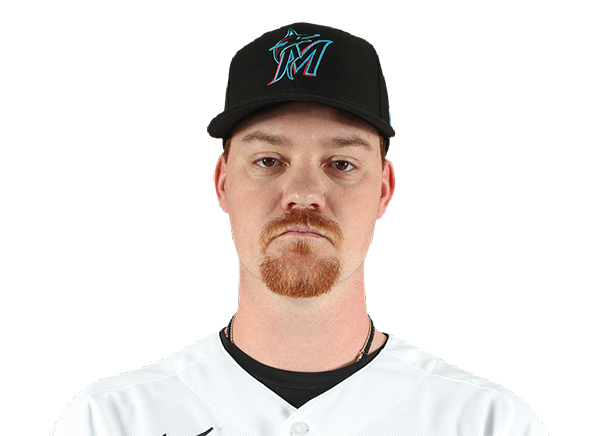 Dax Fulton |
2.0 | 1 | 0 | 0 | 1 | 1 | 0 | 26-17 | 3.86 | 26 |
 Tyler Zuber |
1.0 | 0 | 0 | 0 | 2 | 2 | 0 | 28-14 | 4.36 | 28 |
H2H / Season Series
MIA5–6
CHC
MIA1–6
CHC
Last 5 Games
| Date | Opponent | Result |
|---|---|---|
| Sep 5 | @ MIA | W6–5 |
| Sep 4 | @ MIA | W6–1 |
| Sep 3 |  vs MIL | W2–1 |
| Sep 2 | vs MIL | L5–9 |
| Sep 1 | vs MIL | L4–9 |
| Date | Opponent | Result |
|---|---|---|
| Sep 4 | vs CHC | L1–6 |
| Sep 3 |  @ KC | L3–7 |
| Sep 2 | @ KC | W9–6 |
| Sep 1 | @ KC | W6–3 |
| Aug 31 |  @ WSH | L3–6 |
Standings
American League
| Team | W | L | PCT | GB | DIFF | STRK |
|---|---|---|---|---|---|---|
1 Rays | 84 | 57 | .596 | - | +46 | W1 |
2 White Sox | 74 | 67 | .525 | 10 | +42 | W1 |
3 Astros | 73 | 69 | .514 | 11.5 | -36 | W3 |
4 Yankees | 80 | 61 | .567 | 4 | +114 | L1 |
5 Red Sox | 77 | 65 | .542 | 7.5 | +79 | W2 |
6 Guardians | 72 | 70 | .507 | 12.5 | -9 | W2 |
7 Blue Jays | 71 | 71 | .500 | 13.5 | -34 | W3 |
8 Rangers | 70 | 72 | .493 | 14.5 | -43 | L1 |
9 Orioles | 69 | 73 | .486 | 15.5 | -22 | L4 |
10 Twins | 67 | 74 | .475 | 17 | -41 | L2 |
11 Mariners | 66 | 76 | .465 | 18.5 | -69 | L2 |
12 Tigers | 64 | 77 | .454 | 20 | +45 | L2 |
| 13Royals | 63 | 79 | .444 | 21.5 | -92 | L1 |
14 Athletics | 56 | 86 | .394 | 28.5 | -190 | W3 |
15 Angels | 53 | 88 | .376 | 31 | -81 | L3 |
National League
| Team | W | L | PCT | GB | DIFF | STRK |
|---|---|---|---|---|---|---|
| 1Brewers | 88 | 54 | .620 | - | +174 | W1 |
2 Braves | 84 | 57 | .596 | 3.5 | +121 | W2 |
3 Dodgers | 84 | 57 | .596 | 3.5 | +149 | W2 |
| 4Cubs | 80 | 62 | .563 | 8 | +138 | W2 |
5 Phillies | 79 | 62 | .560 | 8.5 | +33 | L2 |
6 Padres | 74 | 67 | .525 | 13.5 | +11 | W1 |
7 Diamondbacks | 74 | 68 | .521 | 14 | -3 | L1 |
| 8Marlins | 71 | 71 | .500 | 17 | +9 | L2 |
9 Cardinals | 71 | 71 | .500 | 17 | -8 | W1 |
10 Pirates | 70 | 72 | .493 | 18 | +30 | W2 |
11 Reds | 67 | 74 | .475 | 20.5 | -111 | L1 |
| 12Nationals | 67 | 76 | .469 | 21.5 | +12 | L2 |
13 Mets | 64 | 77 | .454 | 23.5 | -46 | W2 |
14 Giants | 58 | 84 | .408 | 30 | -77 | L2 |
15 Rockies | 54 | 87 | .383 | 33.5 | -141 | L1 |
CHC
VS
MIA
Pitchers
Javier Assad
Catchers
Miguel Amaya
Infielders
Michael Busch
Alex Bregman
Nico Hoerner
Pedro Ramirez
Outfielders
Pete Crow-Armstrong
Seiya Suzuki
Ian Happ
Designated Hitters
Michael Conforto
Pitchers
Ryan Gusto
Catchers
Joe Mack
Infielders
Griffin Conine
Otto Lopez
Graham Pauley
Javier Sanoja
Outfielders
Heriberto Hernandez
Jakob Marsee
Owen Caissie
Designated Hitters
Kyle Stowers
Cubs
VS
Marlins
Batting
143
Team Games Played
143
4928
At Bats
4747
1242
Hits
1172
722
Runs Batted In
592
200
Home Runs
146
102
Stolen Bases
146
.252
Batting Average
.247
765
Runs
621
241
Doubles
221
22
Triples
30
2127
Total Bases
1891
604
Walks
493
1211
Strikeouts
1174
.340
On Base Percentage
.325
.432
Slugging Percentage
.398
.772
OBP Pct + SLG Pct
.724
143
Games Played
143
143
Games Started
143
72
Hit By Pitch
79
0.0
Wins Above Replacement
0.0
0.0
Offensive Wins Above Replacement
0.0
19
Caught Stealing
43
1
Is Qualified
1
749.0
Runs Created
639.3
5.3
Runs Created Per 27 Outs
4.6
.107
Walks Per Plate Appearance
.092
0.50
Walk To Strikeout Ratio
0.42
.180
Isolated Power
.151
.319
Secondary Average
.277
3.97
Pitches Per Plate Appearance
3.82
463
Extra Base Hits
397
5652
Plate Appearances
5385
24.6
At Bats Per Home Run
32.5
8
Sacrifice Hit
21
39
Sacrifice Flies
44
Pitching
143
Team Games Played
143
46
Quality Starts
46
81
Wins
71
62
Losses
72
32
Saves
31
51
Holds
80
1178
Hits
1099
592
Earned runs
556
215
Home Runs
143
432
Walks
486
1106
Strikeouts
1158
7.8
Strikeouts Per 9 Innings
8.3
145.1
Pitches Per Start
144.0
1.26
Walks Plus Hits Per Inning Pitched
1.26
4.17
Earned Run Average
3.99
62
Losses
72
1278.2
Innings pitched
1255.2
.566
Win Percentage
.497
56
Save Opportunities
50
.244
Opponent Batting Average
.233
.312
Opponent's On-base pct.
.312
.417
Opponent's Slugging pct.
.377
.729
Opponent's OPB Pct + SLG Pct
.688
4828
At Bats
4719
170
Doubles
205
10
Triples
22
57
Batters Hit
70
77
Stolen Bases
117
143
Games Played
143
0
Complete Games
1
6
Shutouts
13
31
Wild Pitches
44
605
Runs Batted In
575
3
Balks
4
1278.2
Innings pitched
1255.2
7.8
Strikeouts Per 9 Innings
8.3
28
Caught Stealing
38
143
Games Started
143
0.0
Wins Above Replacement
0.0
1
Is Qualified
1
626
Runs
613
592
Earned Runs
556
2013
Total Bases
1777
Fielding
143
Team Games Played
143
1279
Full Innings
1256
5246
Total Chances
5054
3836
Putouts
3767
1358
Assists
1197
52
Errors
90
241
Double Plays
221
0.990
Fielding Percentage
0.982
36.6
Range Factor
35.6
0.0
Zone Rating
0.0
143
Games Played
143
0
Games Started
0
0.0
Defensive Wins Above Replacement
0.0
1
Qualified
1