

Cubs vs Nationals Live Score (12 Aug, 2026)
Game Information
Stage
Standard
Season
2026
First Pitch
Wed, Aug 12, 6:45 pm
Venue
Nationals Park
Location
Washington, District of Columbia
Attendance
21,116
Inning Scores
Home Runs
Pete Crow-Armstrong
27 HR
.285 AVG
72 RBI

James Wood
30 HR
.265 AVG
73 RBI
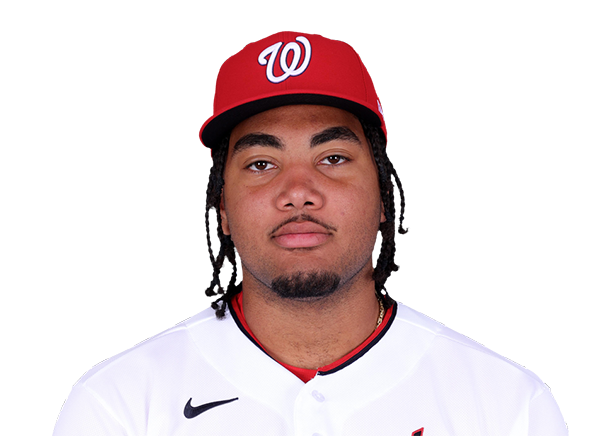
Batting Average
Pete Crow-Armstrong
.285 AVG
.386 OBP
.546 SLG
CJ Abrams
.286 AVG
.358 OBP
.547 SLG

Runs Batted In
Pete Crow-Armstrong
72 RBI
27 HR
.285 AVG
CJ Abrams
91 RBI
29 HR
.286 AVG
Earned Run Average
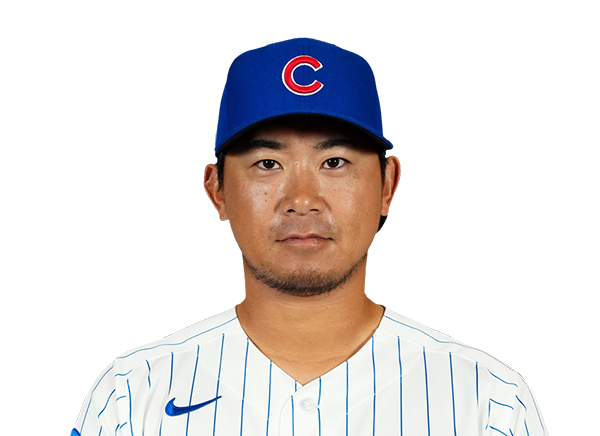
Shota Imanaga
3.74 ERA
8 W
130 K
Cade Cavalli
3.57 ERA
9 W
141 K
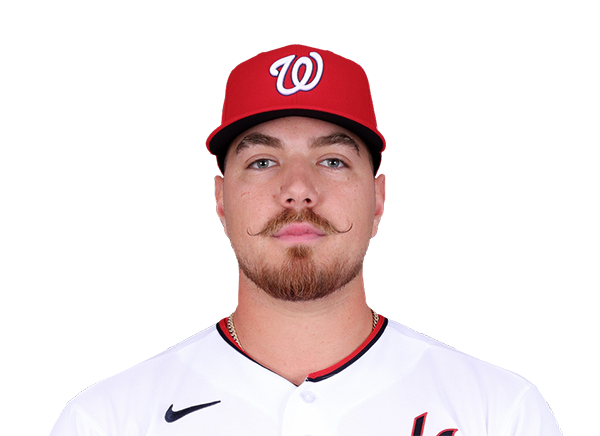
Wins
Shota Imanaga
8 W
3.74 ERA
130 K
Cade Cavalli
9 W
3.57 ERA
141 K
Strikeouts
Shota Imanaga
130 K
8 W
3.74 ERA
Cade Cavalli
141 K
9 W
3.57 ERA
Injury Report
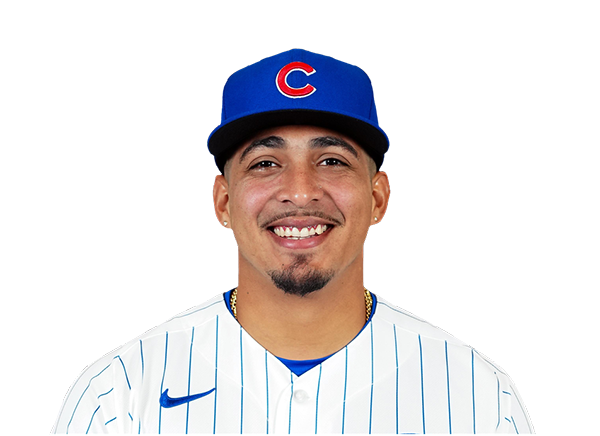

Team Stats
 CHC
WSH

Array
Runs
Array
13
Hits
11
2
Errors
1
—
Home Runs
—
—
Walks
—
—
Strikeouts
—
Standings
American League
| Team | W | L | PCT | GB | DIFF | STRK |
|---|---|---|---|---|---|---|
1 Rays | 76 | 53 | .589 | - | +42 | L3 |
2 White Sox | 67 | 62 | .519 | 9 | +42 | L1 |
3 Astros | 65 | 65 | .500 | 11.5 | -43 | L1 |
4 Yankees | 73 | 56 | .566 | 3 | +95 | L1 |
5 Red Sox | 70 | 59 | .543 | 6 | +98 | W2 |
6 Rangers | 64 | 66 | .492 | 12.5 | -48 | L1 |
7 Guardians | 64 | 66 | .492 | 12.5 | -14 | W3 |
8 Blue Jays | 64 | 67 | .489 | 13 | -50 | W1 |
9 Twins | 63 | 67 | .485 | 13.5 | -47 | L2 |
10 Orioles | 63 | 67 | .485 | 13.5 | -33 | W2 |
11 Mariners | 62 | 68 | .477 | 14.5 | -44 | W2 |
12 Tigers | 61 | 68 | .473 | 15 | +77 | L4 |
13 Royals | 57 | 74 | .435 | 20 | -95 | W7 |
14 Angels | 52 | 78 | .400 | 24.5 | -68 | W1 |
15 Athletics | 50 | 80 | .385 | 26.5 | -188 | W1 |
National League
| Team | W | L | PCT | GB | DIFF | STRK |
|---|---|---|---|---|---|---|
1 Brewers | 81 | 49 | .623 | - | +163 | W3 |
2 Dodgers | 79 | 51 | .608 | 2 | +147 | W5 |
3 Braves | 75 | 55 | .577 | 6 | +108 | L2 |
| 4Cubs | 74 | 56 | .569 | 7 | +98 | L3 |
5 Phillies | 72 | 58 | .554 | 9 | +25 | W8 |
6 Padres | 70 | 60 | .538 | 11 | +9 | W2 |
7 Diamondbacks | 68 | 62 | .523 | 13 | +7 | L1 |
8 Marlins | 66 | 64 | .508 | 15 | +17 | W2 |
9 Cardinals | 66 | 65 | .504 | 15.5 | 0 | L2 |
10 Pirates | 63 | 68 | .481 | 18.5 | +29 | L2 |
11 Reds | 62 | 68 | .477 | 19 | -92 | W1 |
| 12Nationals | 61 | 70 | .466 | 20.5 | +14 | L3 |
13 Mets | 59 | 71 | .454 | 22 | -39 | W1 |
14 Giants | 52 | 77 | .403 | 28.5 | -79 | L3 |
15 Rockies | 50 | 79 | .388 | 30.5 | -131 | L5 |
CHC
VS
WSH
Pitchers
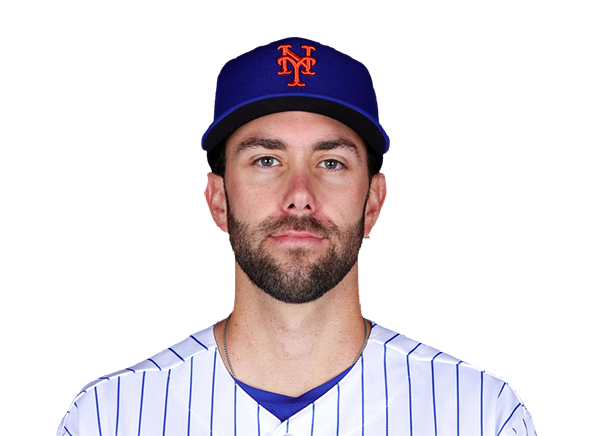
David Peterson
Catchers
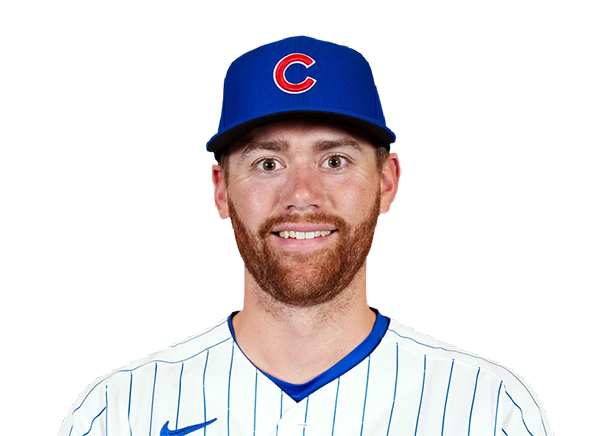
Carson Kelly
Infielders

Michael Busch

Nico Hoerner
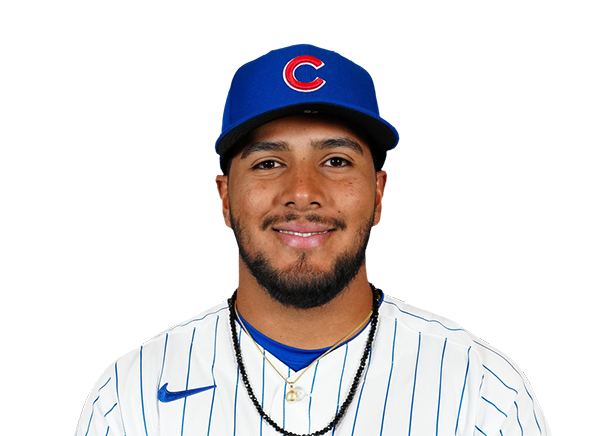
Pedro Ramirez

Dansby Swanson
Outfielders
Pete Crow-Armstrong
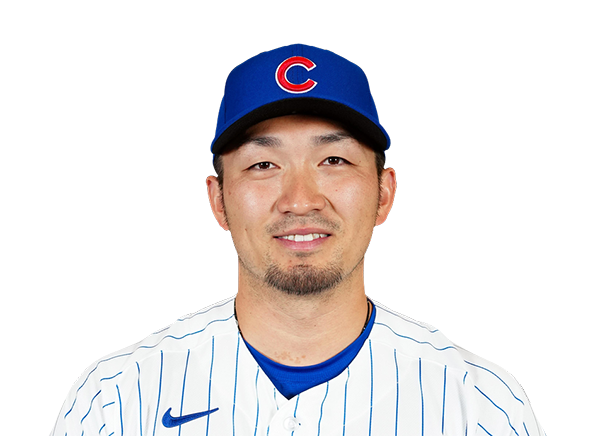
Seiya Suzuki

Tyrone Taylor
Designated Hitters
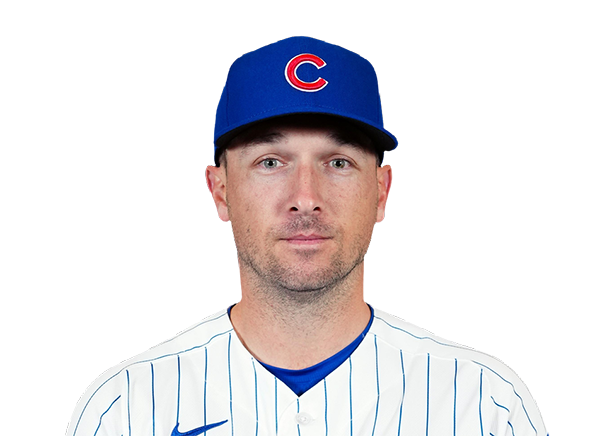
Alex Bregman
Pitchers

Jackson Kent
Catchers
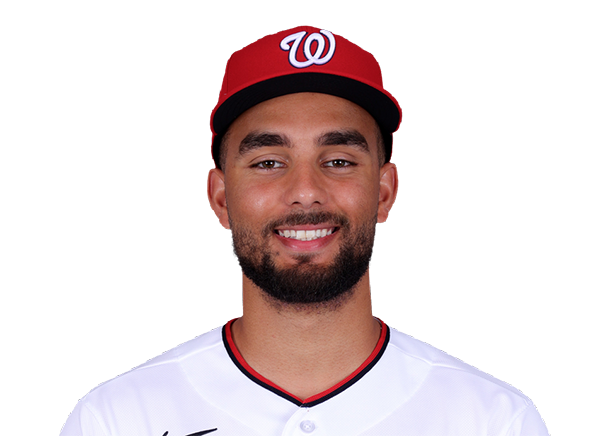
Harry Ford
Infielders
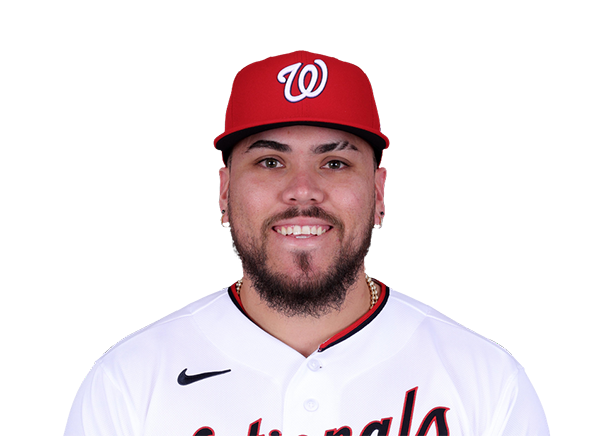
Andres Chaparro
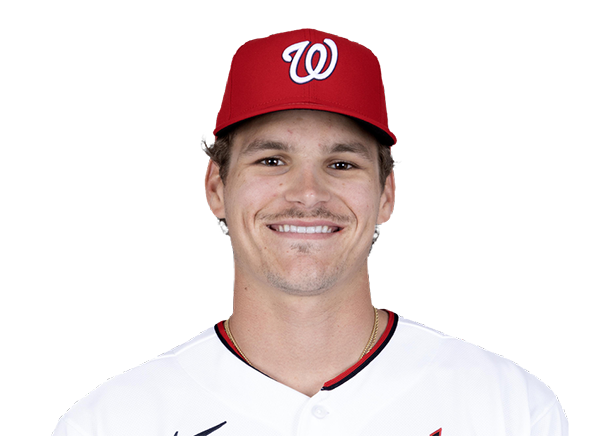
Brady House
CJ Abrams
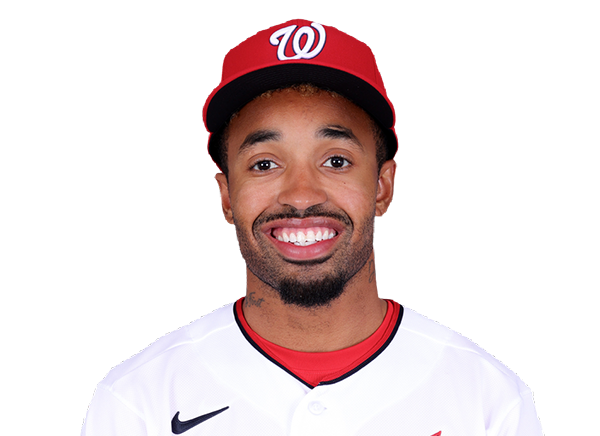
Nasim Nunez
Outfielders

Dylan Crews
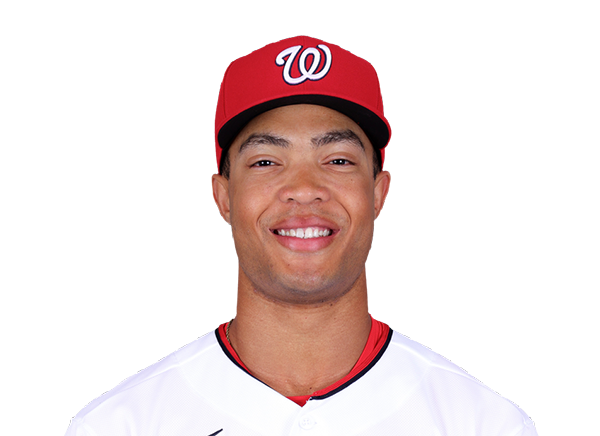
Andrew Pinckney
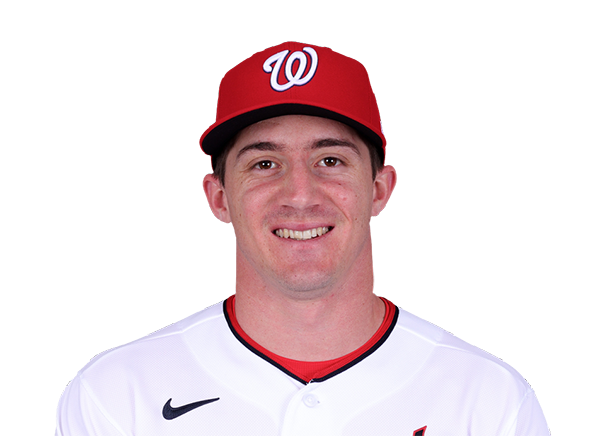
Jacob Young
Designated Hitters
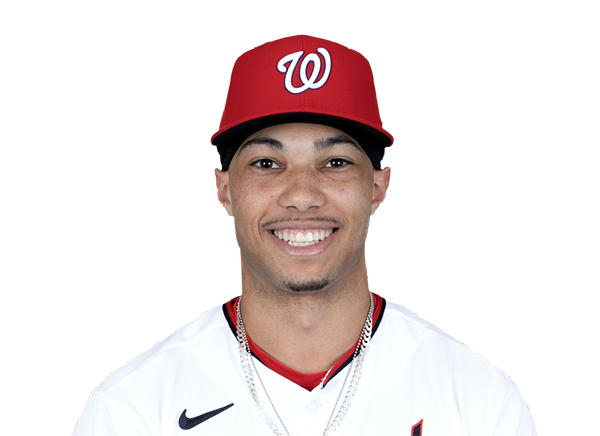
Daylen Lile
Cubs
VS
Nationals
Batting
121
Team Games Played
122
4170
At Bats
4189
1044
Hits
1056
597
Runs Batted In
626
155
Home Runs
176
91
Stolen Bases
133
.250
Batting Average
.252
634
Runs
655
205
Doubles
212
20
Triples
25
1754
Total Bases
1846
519
Walks
429
1041
Strikeouts
1014
.340
On Base Percentage
.328
.421
Slugging Percentage
.441
.761
OBP Pct + SLG Pct
.769
121
Games Played
122
121
Games Started
122
64
Hit By Pitch
59
0.0
Wins Above Replacement
0.0
0.0
Offensive Wins Above Replacement
0.0
17
Caught Stealing
29
1
Is Qualified
1
621.7
Runs Created
625.0
5.2
Runs Created Per 27 Outs
5.1
.108
Walks Per Plate Appearance
.091
0.50
Walk To Strikeout Ratio
0.42
.170
Isolated Power
.189
.312
Secondary Average
.316
3.97
Pitches Per Plate Appearance
3.81
380
Extra Base Hits
413
4792
Plate Appearances
4722
26.9
At Bats Per Home Run
23.8
5
Sacrifice Hit
14
33
Sacrifice Flies
28
Pitching
121
Team Games Played
122
37
Quality Starts
27
71
Wins
59
50
Losses
63
28
Saves
33
44
Holds
63
1001
Hits
1090
490
Earned runs
576
181
Home Runs
172
357
Walks
428
929
Strikeouts
922
7.7
Strikeouts Per 9 Innings
7.6
144.6
Pitches Per Start
151.7
1.26
Walks Plus Hits Per Inning Pitched
1.39
4.08
Earned Run Average
4.76
50
Losses
63
1081.2
Innings pitched
1088.2
.587
Win Percentage
.484
47
Save Opportunities
64
.245
Opponent Batting Average
.260
.311
Opponent's On-base pct.
.334
.417
Opponent's Slugging pct.
.434
.729
Opponent's OPB Pct + SLG Pct
.768
4085
At Bats
4200
141
Doubles
199
10
Triples
8
45
Batters Hit
65
67
Stolen Bases
89
121
Games Played
122
0
Complete Games
0
4
Shutouts
3
27
Wild Pitches
42
500
Runs Batted In
617
1
Balks
1
1081.2
Innings pitched
1088.2
7.7
Strikeouts Per 9 Innings
7.6
24
Caught Stealing
27
121
Games Started
122
0.0
Wins Above Replacement
0.0
1
Is Qualified
1
519
Runs
639
490
Earned Runs
576
1705
Total Bases
1821
Fielding
121
Team Games Played
122
1082
Full Innings
1089
4420
Total Chances
4490
3245
Putouts
3266
1129
Assists
1135
46
Errors
89
205
Double Plays
212
0.990
Fielding Percentage
0.980
36.4
Range Factor
36.4
0.0
Zone Rating
0.0
121
Games Played
122
0
Games Started
0
0.0
Defensive Wins Above Replacement
0.0
1
Qualified
1