

Cubs vs Nationals Live Score (13 Aug, 2026)
Game Information
Stage
Standard
Season
2026
First Pitch
Thu, Aug 13, 4:05 pm
Venue
Nationals Park
Location
Washington, District of Columbia
Attendance
21,463
Inning Scores
Home Runs
Pete Crow-Armstrong
27 HR
.284 AVG
73 RBI

James Wood
30 HR
.265 AVG
73 RBI
Batting Average
Pete Crow-Armstrong
.284 AVG
.384 OBP
.544 SLG
CJ Abrams
.284 AVG
.358 OBP
.544 SLG

Runs Batted In
Pete Crow-Armstrong
73 RBI
27 HR
.284 AVG
CJ Abrams
91 RBI
29 HR
.284 AVG
Earned Run Average
Shota Imanaga
3.74 ERA
8 W
130 K
Cade Cavalli
3.57 ERA
9 W
141 K
Wins
Shota Imanaga
8 W
3.74 ERA
130 K
Cade Cavalli
9 W
3.57 ERA
141 K
Strikeouts
Shota Imanaga
130 K
8 W
3.74 ERA
Cade Cavalli
141 K
9 W
3.57 ERA
Injury Report
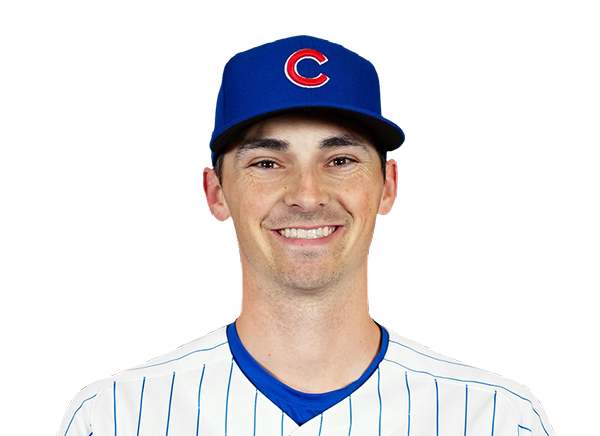
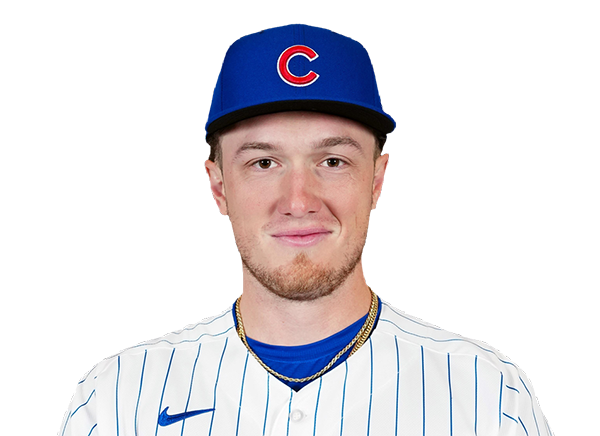
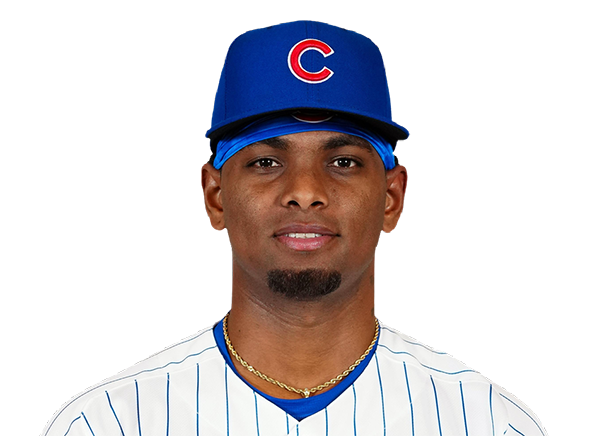
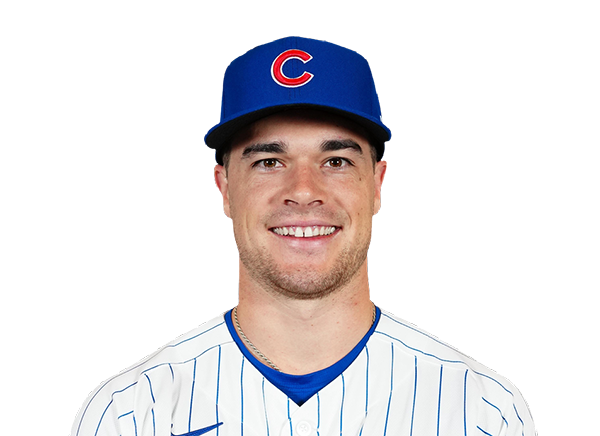
Team Stats
 CHC
WSH

Array
Runs
Array
1
Hits
10
0
Errors
0
—
Home Runs
—
—
Walks
—
—
Strikeouts
—
Standings
American League
| Team | W | L | PCT | GB | DIFF | STRK |
|---|---|---|---|---|---|---|
1 Rays | 78 | 54 | .591 | - | +44 | L1 |
2 White Sox | 69 | 63 | .523 | 9 | +38 | W1 |
3 Astros | 66 | 66 | .500 | 12 | -42 | W1 |
4 Yankees | 74 | 57 | .565 | 3.5 | +98 | L1 |
5 Red Sox | 73 | 59 | .553 | 5 | +105 | W5 |
6 Guardians | 67 | 66 | .504 | 11.5 | -5 | W6 |
7 Rangers | 66 | 67 | .496 | 12.5 | -41 | L1 |
8 Orioles | 64 | 68 | .485 | 14 | -23 | W1 |
9 Mariners | 64 | 69 | .481 | 14.5 | -51 | W2 |
10 Twins | 64 | 69 | .481 | 14.5 | -53 | L1 |
11 Blue Jays | 64 | 69 | .481 | 14.5 | -57 | L2 |
12 Tigers | 62 | 70 | .470 | 16 | +73 | W1 |
13 Royals | 59 | 74 | .444 | 19.5 | -89 | W9 |
14 Athletics | 52 | 81 | .391 | 26.5 | -188 | W1 |
15 Angels | 52 | 81 | .391 | 26.5 | -74 | L3 |
National League
| Team | W | L | PCT | GB | DIFF | STRK |
|---|---|---|---|---|---|---|
1 Brewers | 81 | 51 | .614 | - | +160 | L2 |
2 Dodgers | 80 | 52 | .606 | 1 | +150 | L1 |
3 Braves | 77 | 55 | .583 | 4 | +111 | W2 |
| 4Cubs | 76 | 57 | .571 | 5.5 | +121 | L1 |
5 Phillies | 73 | 60 | .549 | 8.5 | +17 | L2 |
6 Padres | 71 | 62 | .534 | 10.5 | +14 | L2 |
7 Diamondbacks | 70 | 63 | .526 | 11.5 | +3 | W1 |
8 Marlins | 67 | 66 | .504 | 14.5 | +15 | L2 |
9 Cardinals | 66 | 67 | .496 | 15.5 | -14 | L4 |
10 Pirates | 65 | 69 | .485 | 17 | +27 | W2 |
11 Reds | 62 | 71 | .466 | 19.5 | -101 | L3 |
| 12Nationals | 62 | 72 | .463 | 20 | +18 | L1 |
13 Mets | 60 | 72 | .455 | 21 | -39 | W1 |
14 Giants | 54 | 78 | .409 | 27 | -73 | W2 |
15 Rockies | 51 | 81 | .386 | 30 | -144 | W1 |
CHC
VS
WSH
Pitchers
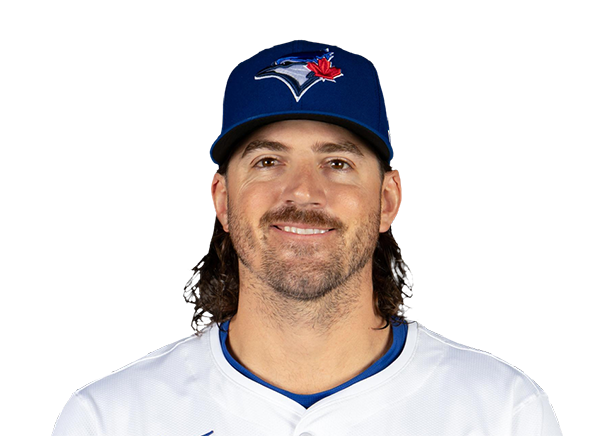
Kevin Gausman
Catchers
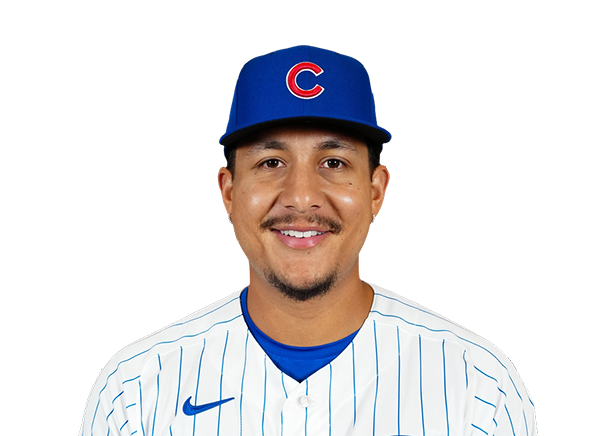
Miguel Amaya
Infielders

Michael Busch
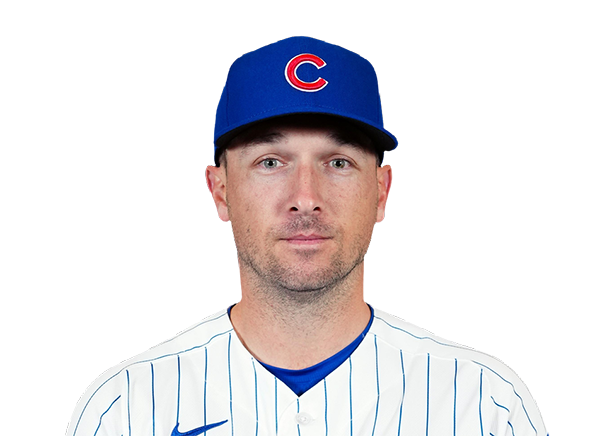
Alex Bregman
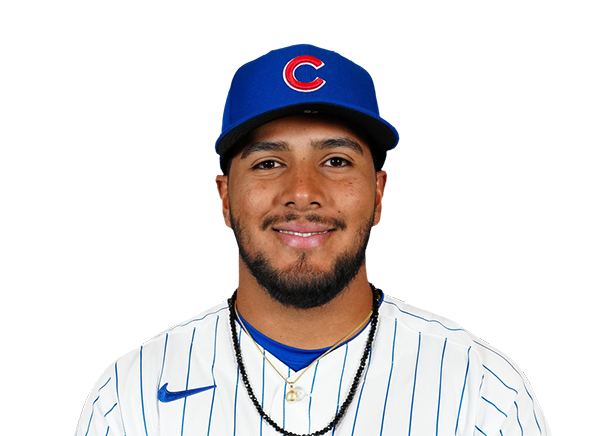
Pedro Ramirez

Dansby Swanson
Outfielders
Pete Crow-Armstrong
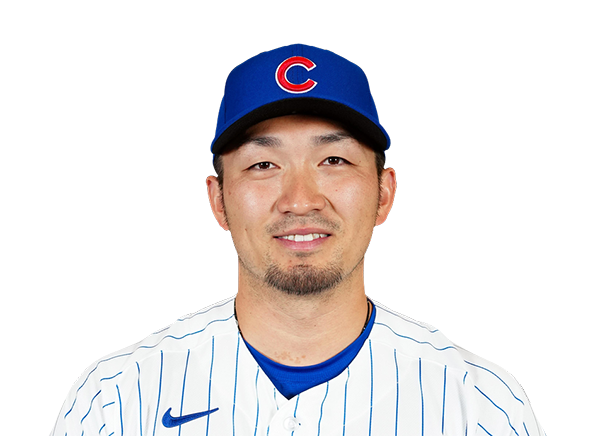
Seiya Suzuki
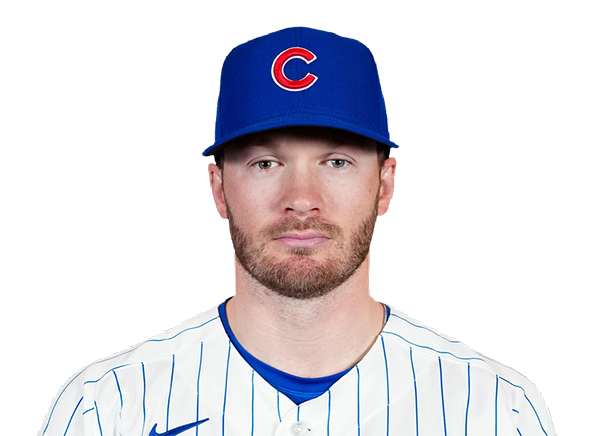
Ian Happ
Designated Hitters

Michael Conforto
Pitchers
Cade Cavalli
Catchers
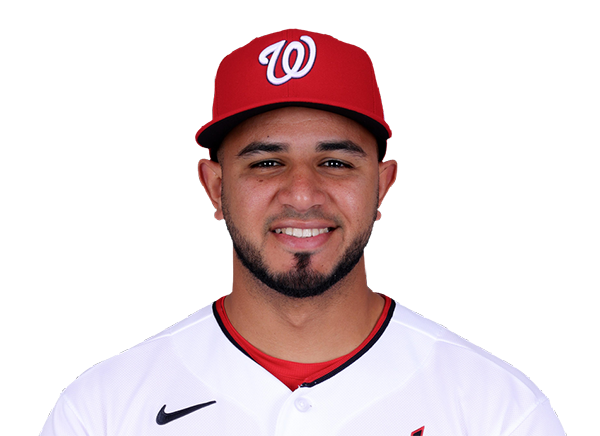
Keibert Ruiz
Infielders
CJ Abrams
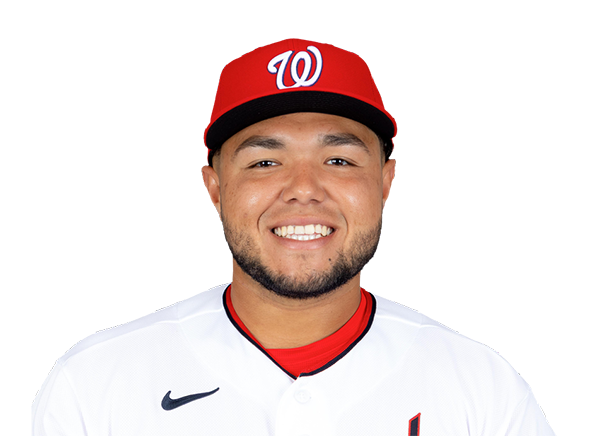
Abimelec Ortiz
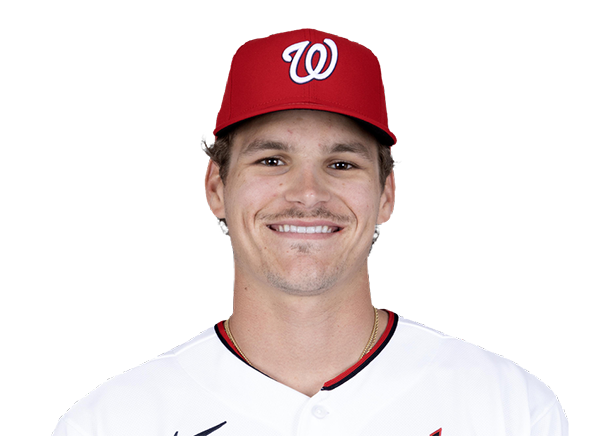
Brady House
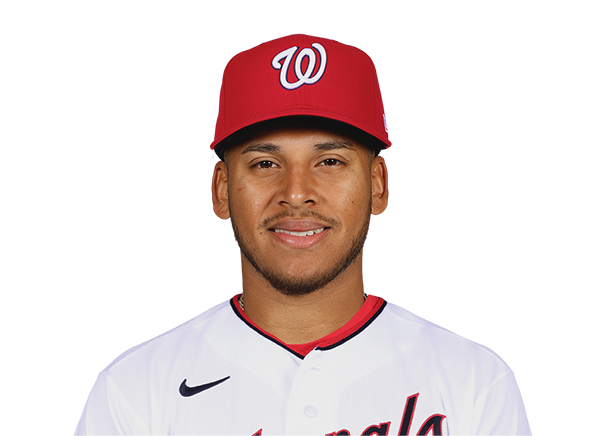
Jorbit Vivas
Outfielders

Dylan Crews
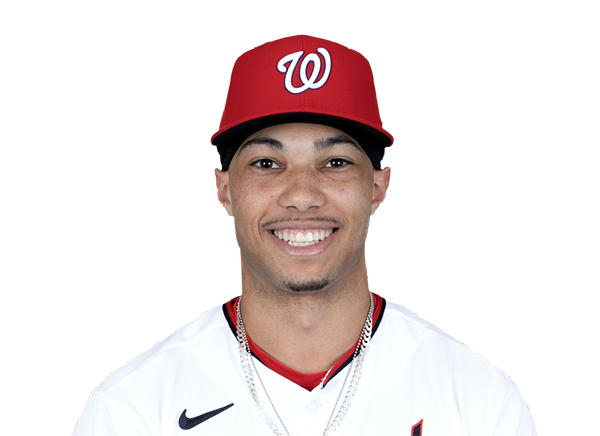
Daylen Lile
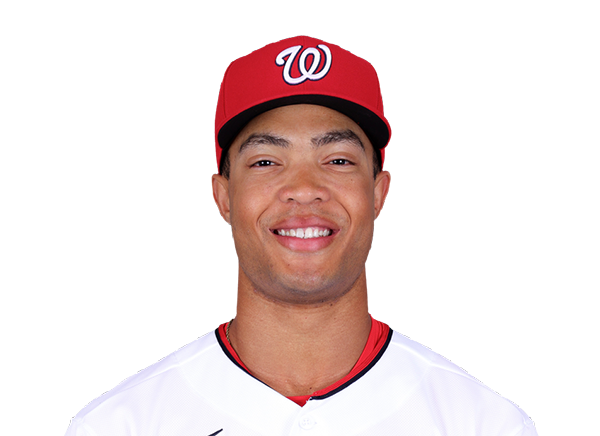
Andrew Pinckney
Designated Hitters
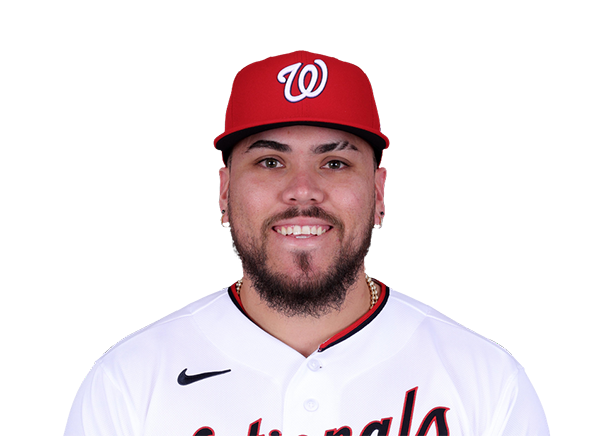
Andres Chaparro
Cubs
VS
Nationals
Batting
122
Team Games Played
123
4197
At Bats
4222
1045
Hits
1066
597
Runs Batted In
633
155
Home Runs
177
91
Stolen Bases
134
.249
Batting Average
.252
634
Runs
662
205
Doubles
213
20
Triples
25
1755
Total Bases
1860
521
Walks
430
1052
Strikeouts
1022
.339
On Base Percentage
.328
.418
Slugging Percentage
.441
.757
OBP Pct + SLG Pct
.769
122
Games Played
123
122
Games Started
123
64
Hit By Pitch
59
0.0
Wins Above Replacement
0.0
0.0
Offensive Wins Above Replacement
0.0
17
Caught Stealing
29
1
Is Qualified
1
619.5
Runs Created
629.7
5.1
Runs Created Per 27 Outs
5.2
.108
Walks Per Plate Appearance
.090
0.50
Walk To Strikeout Ratio
0.42
.169
Isolated Power
.188
.311
Secondary Average
.315
3.97
Pitches Per Plate Appearance
3.81
380
Extra Base Hits
415
4821
Plate Appearances
4757
27.1
At Bats Per Home Run
23.9
5
Sacrifice Hit
14
33
Sacrifice Flies
29
Pitching
122
Team Games Played
123
37
Quality Starts
28
71
Wins
60
51
Losses
63
28
Saves
33
44
Holds
63
1011
Hits
1091
497
Earned runs
576
182
Home Runs
172
358
Walks
430
937
Strikeouts
933
7.7
Strikeouts Per 9 Innings
7.6
144.5
Pitches Per Start
151.4
1.26
Walks Plus Hits Per Inning Pitched
1.39
4.10
Earned Run Average
4.72
51
Losses
63
1089.2
Innings pitched
1097.2
.582
Win Percentage
.488
47
Save Opportunities
64
.246
Opponent Batting Average
.258
.311
Opponent's On-base pct.
.333
.417
Opponent's Slugging pct.
.431
.729
Opponent's OPB Pct + SLG Pct
.764
4118
At Bats
4227
142
Doubles
199
10
Triples
8
45
Batters Hit
65
68
Stolen Bases
89
122
Games Played
123
0
Complete Games
0
4
Shutouts
4
27
Wild Pitches
42
507
Runs Batted In
617
1
Balks
1
1089.2
Innings pitched
1097.2
7.7
Strikeouts Per 9 Innings
7.6
24
Caught Stealing
27
122
Games Started
123
0.0
Wins Above Replacement
0.0
1
Is Qualified
1
526
Runs
639
497
Earned Runs
576
1719
Total Bases
1822
Fielding
122
Team Games Played
123
1090
Full Innings
1098
4450
Total Chances
4524
3269
Putouts
3293
1135
Assists
1142
46
Errors
89
205
Double Plays
213
0.990
Fielding Percentage
0.980
36.4
Range Factor
36.4
0.0
Zone Rating
0.0
122
Games Played
123
0
Games Started
0
0.0
Defensive Wins Above Replacement
0.0
1
Qualified
1