

Cubs vs Padres Live Score (1 Oct, 2026)
Game Information
Stage
RD16
Season
2026
First Pitch
Wed, Sep 30, 10:00 pm
Venue
Petco Park
Location
San Diego, California
Venue Type
Outdoor
Broadcast
Peacock
Attendance
47,513
Live Situation
0Balls
0Strikes
0Outs
—Pitcher
—At Bat
Pitch Sequence
1
BALL IN PLAY
Four-seam FB
101 MPH
Injury Report
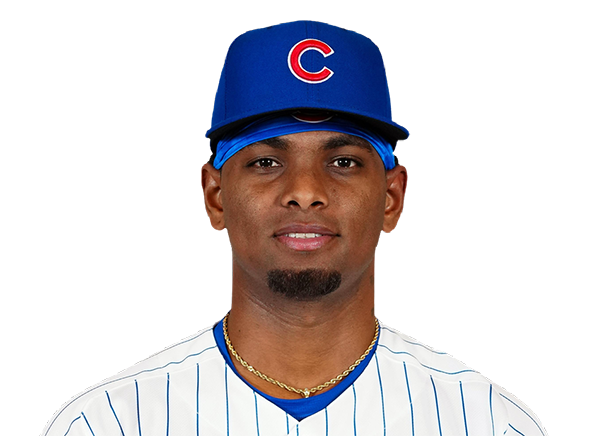
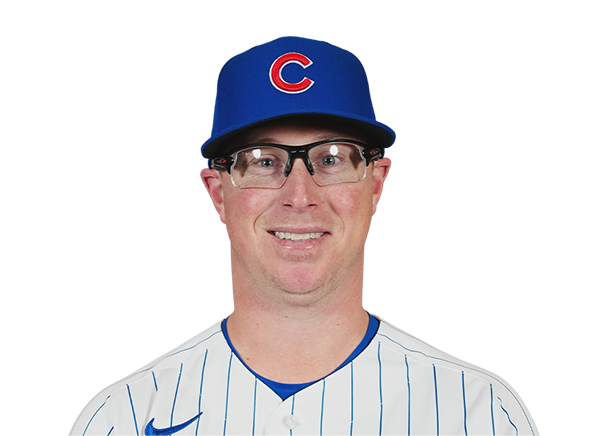
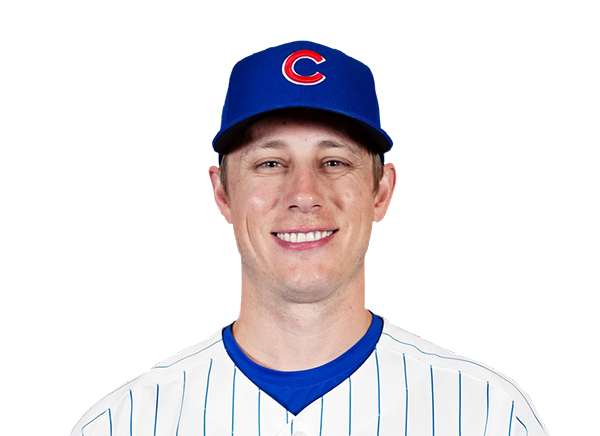
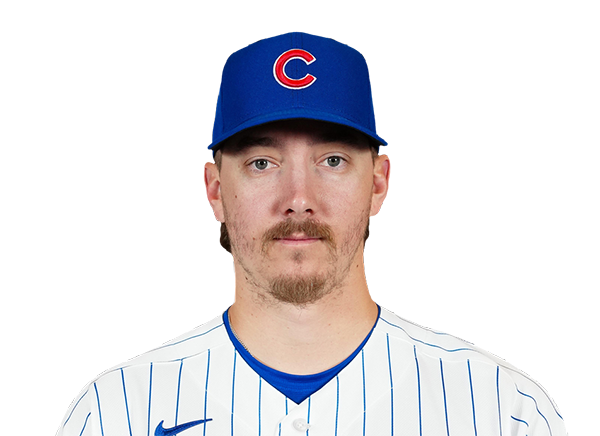
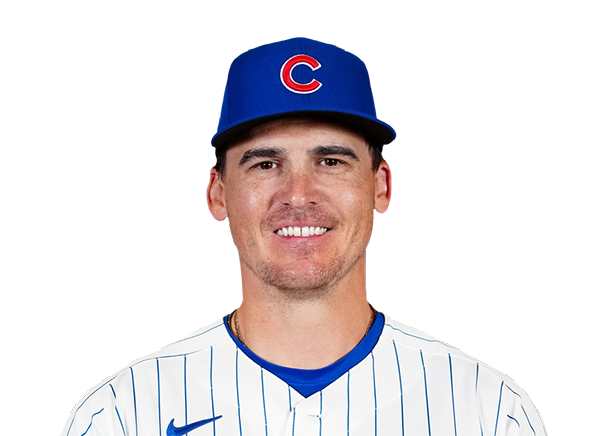
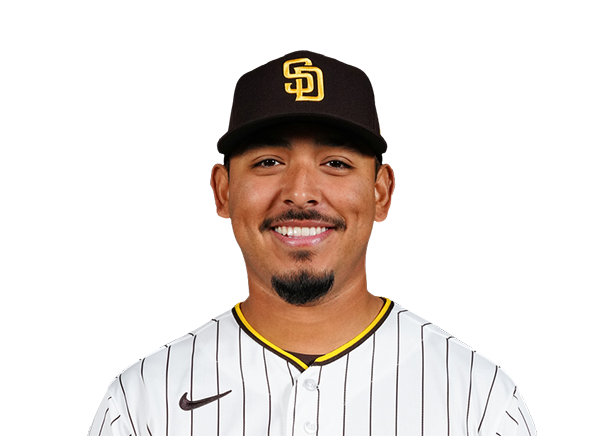
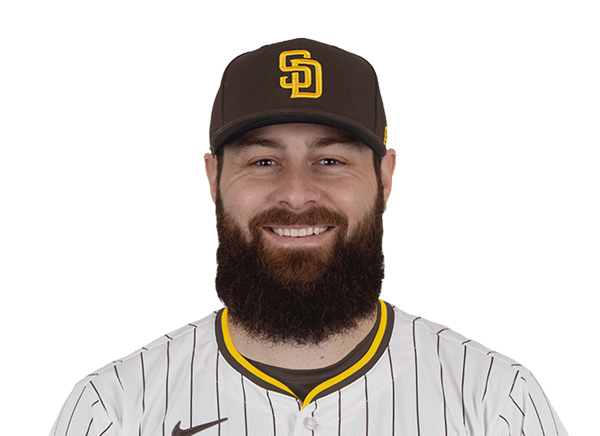


Team Stats
 CHC
SD

1
Runs
4
5
Hits
8
0
Errors
0
0
Home Runs
1
3
Walks
1
8
Strikeouts
6
Player Box Score
Chicago Cubs
| Player | H-AB | AB | R | H | RBI | HR | BB | K | #P | AVG | OBP | SLG |
|---|---|---|---|---|---|---|---|---|---|---|---|---|
 Pete Crow-Armstrong |
0-4 | 4 | 0 | 0 | 0 | 0 | 0 | 1 | 17 | .000 | .125 | .000 |
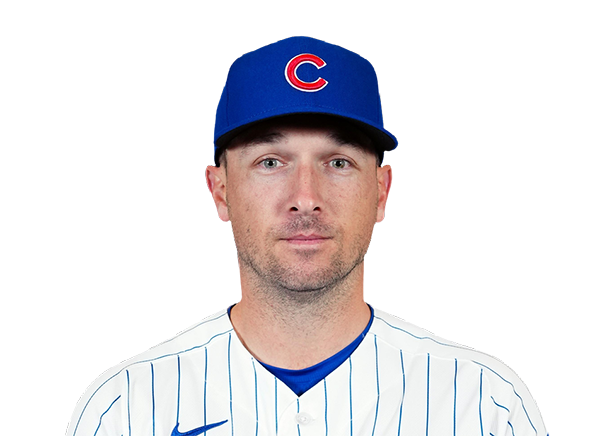 Alex Bregman |
0-4 | 4 | 0 | 0 | 0 | 0 | 0 | 1 | 21 | .000 | .000 | .000 |
 Michael Busch |
0-2 | 2 | 0 | 0 | 0 | 0 | 1 | 0 | 13 | .000 | .286 | .000 |
 Tyrone Taylor |
1-1 | 1 | 0 | 1 | 0 | 0 | 0 | 0 | 4 | 1.000 | 1.000 | 1.000 |
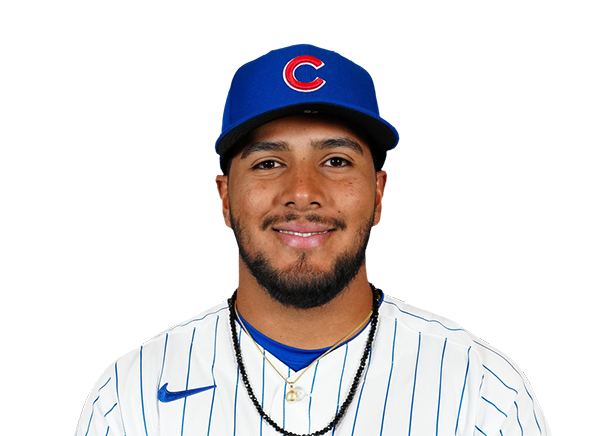 Pedro Ramirez |
0-0 | 0 | 0 | 0 | 0 | 0 | 0 | 0 | 0 | .000 | .000 | .000 |
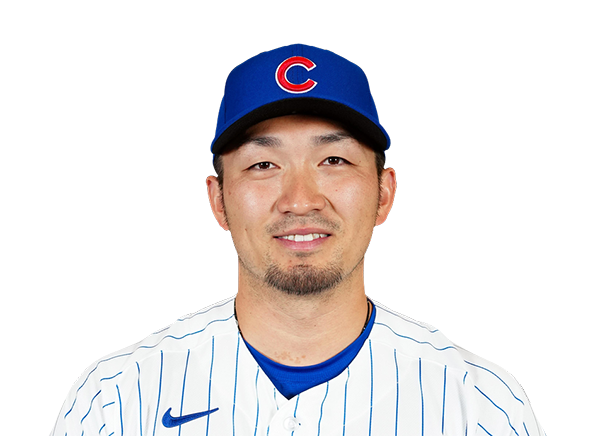 Seiya Suzuki |
1-4 | 4 | 1 | 1 | 0 | 0 | 0 | 2 | 17 | .286 | .375 | .286 |
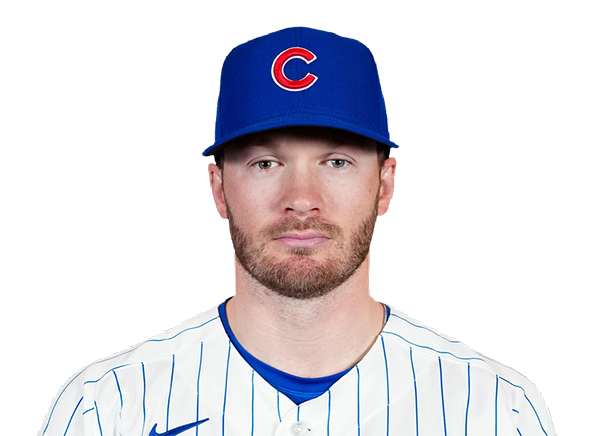 Ian Happ |
0-3 | 3 | 0 | 0 | 0 | 0 | 1 | 1 | 18 | .000 | .250 | .000 |
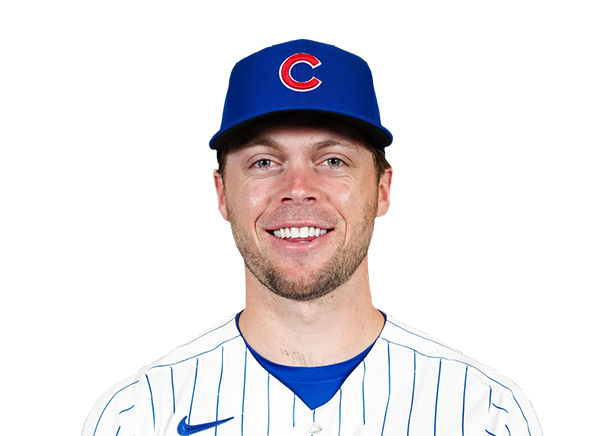 Nico Hoerner |
2-4 | 4 | 0 | 2 | 1 | 0 | 0 | 0 | 16 | .500 | .500 | .625 |
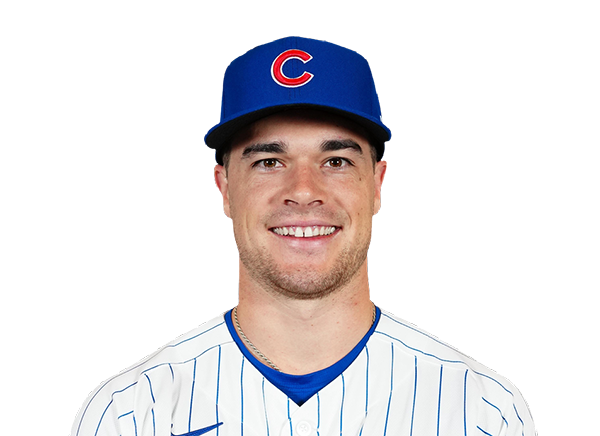 Matt Shaw |
0-2 | 2 | 0 | 0 | 0 | 0 | 1 | 1 | 15 | .000 | .333 | .000 |
 Michael Conforto |
0-1 | 1 | 0 | 0 | 0 | 0 | 0 | 1 | 6 | .000 | .000 | .000 |
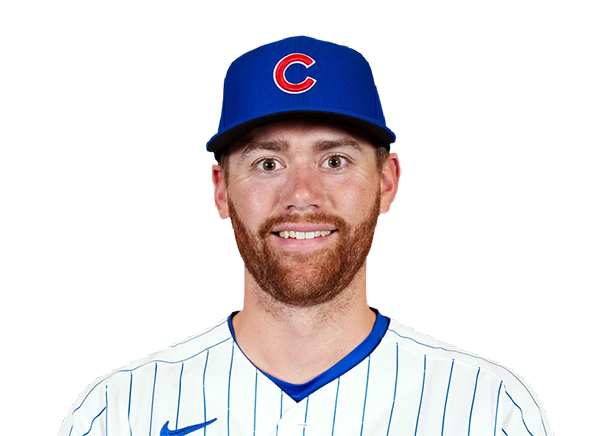 Carson Kelly |
1-3 | 3 | 0 | 1 | 0 | 0 | 0 | 0 | 7 | .167 | .286 | .167 |
 Dansby Swanson |
0-3 | 3 | 0 | 0 | 0 | 0 | 0 | 1 | 12 | .000 | .000 | .000 |
San Diego Padres
| Player | H-AB | AB | R | H | RBI | HR | BB | K | #P | AVG | OBP | SLG |
|---|---|---|---|---|---|---|---|---|---|---|---|---|
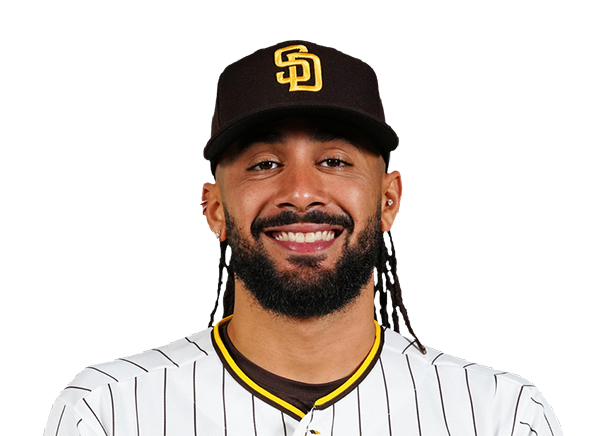 Fernando Tatis Jr. |
0-4 | 4 | 0 | 0 | 0 | 0 | 0 | 1 | 24 | .286 | .375 | .714 |
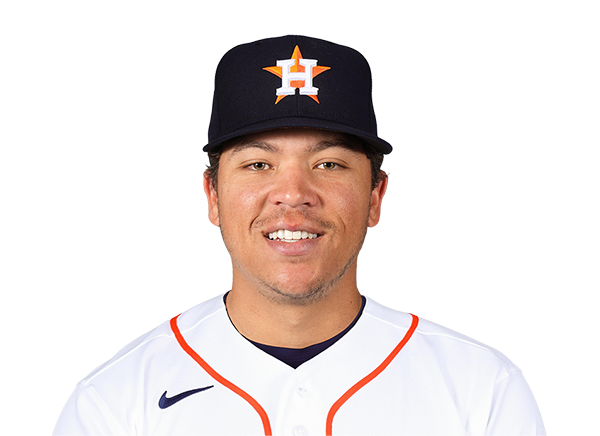 Dustin Harris |
0-4 | 4 | 0 | 0 | 0 | 0 | 0 | 0 | 10 | .167 | .167 | .167 |
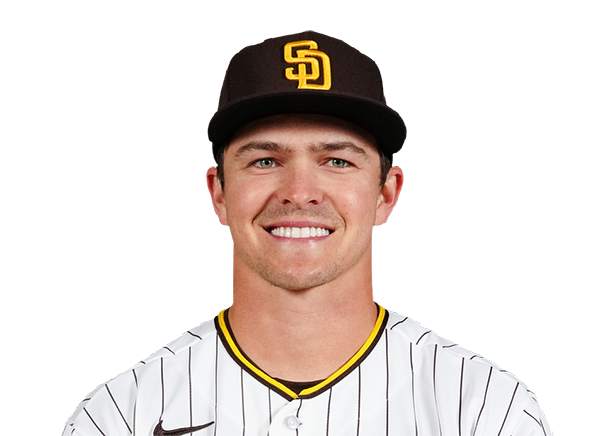 Jase Bowen |
0-0 | 0 | 0 | 0 | 0 | 0 | 0 | 0 | 0 | .000 | .000 | .000 |
 Manny Machado |
1-4 | 4 | 0 | 1 | 0 | 0 | 0 | 1 | 17 | .429 | .500 | 1.000 |
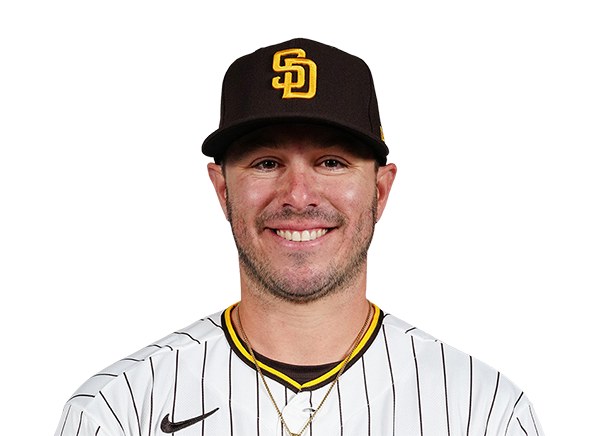 Ty France |
2-4 | 4 | 1 | 2 | 0 | 0 | 0 | 1 | 14 | .500 | .500 | .625 |
 Jackson Merrill |
2-3 | 3 | 1 | 2 | 0 | 0 | 1 | 1 | 22 | .571 | .625 | .571 |
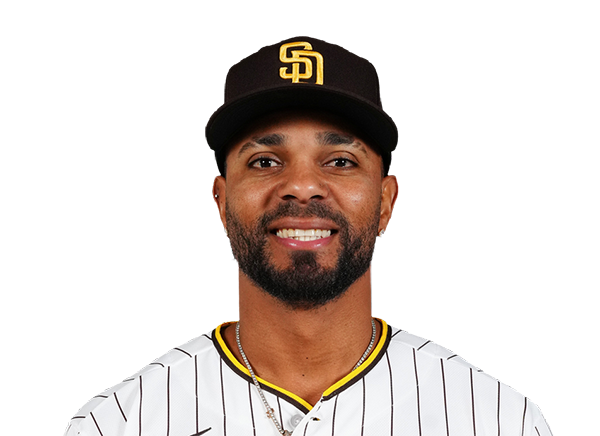 Xander Bogaerts |
2-4 | 4 | 1 | 2 | 1 | 0 | 0 | 0 | 19 | .500 | .500 | 1.000 |
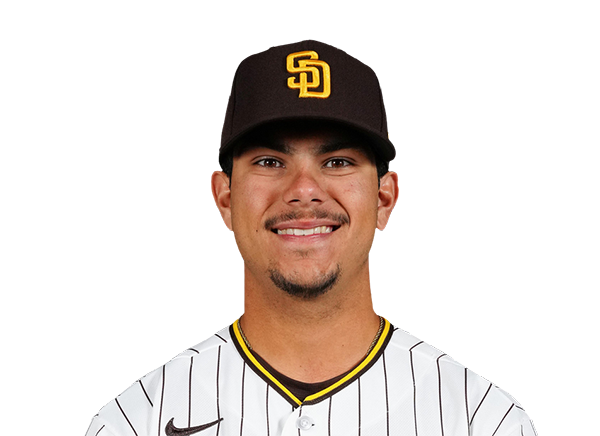 Ethan Salas |
0-1 | 1 | 0 | 0 | 1 | 0 | 0 | 1 | 6 | .000 | .000 | .000 |
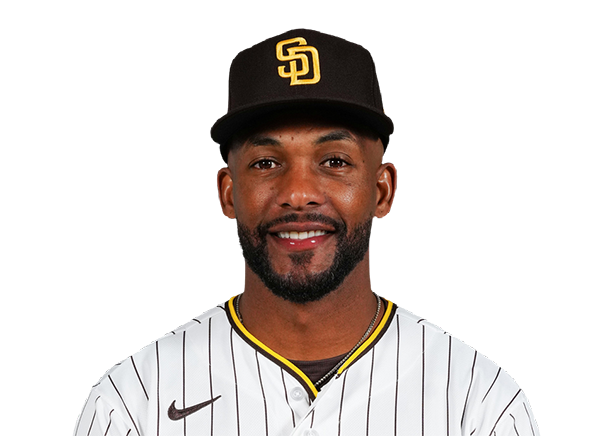 Miguel Andujar |
0-1 | 1 | 0 | 0 | 0 | 0 | 0 | 0 | 7 | .000 | .000 | .000 |
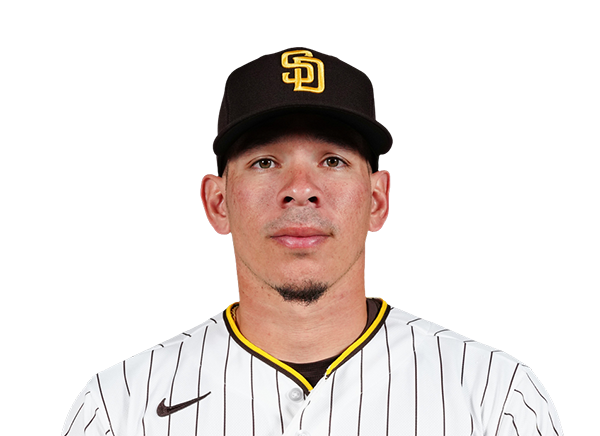 Freddy Fermin |
0-0 | 0 | 0 | 0 | 0 | 0 | 0 | 0 | 0 | .000 | .000 | .000 |
 Austin Hays |
0-1 | 1 | 0 | 0 | 0 | 0 | 0 | 0 | 4 | .000 | .000 | .000 |
 Gavin Sheets |
1-1 | 1 | 1 | 1 | 2 | 1 | 0 | 0 | 2 | 1.000 | 1.000 | 4.000 |
 Samad Taylor |
0-1 | 1 | 0 | 0 | 0 | 0 | 0 | 1 | 4 | .000 | .000 | .000 |
 Jake Cronenworth |
0-2 | 2 | 0 | 0 | 0 | 0 | 0 | 0 | 11 | .167 | .286 | .167 |
Chicago Cubs
| Player | IP | H | R | ER | BB | K | HR | PC-ST | ERA | PC |
|---|---|---|---|---|---|---|---|---|---|---|
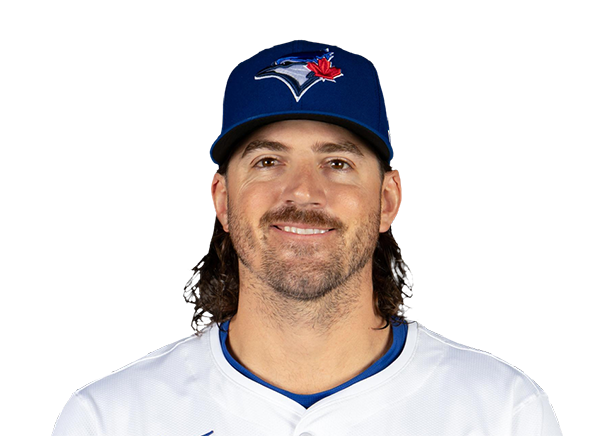 Kevin Gausman |
3.1 | 5 | 3 | 3 | 0 | 1 | 0 | 54-33 | 8.10 | 54 |
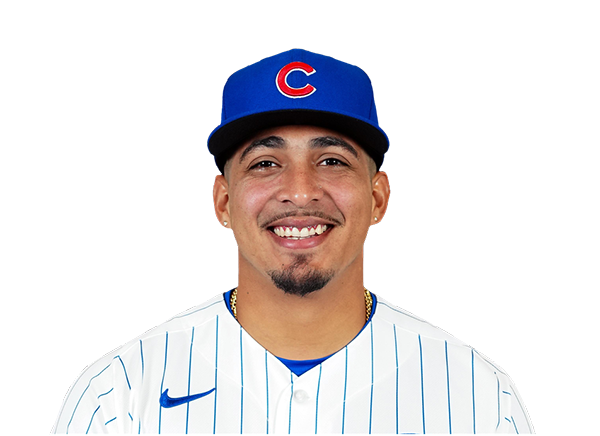 Daniel Palencia |
1.2 | 1 | 1 | 1 | 0 | 2 | 1 | 28-19 | 5.40 | 28 |
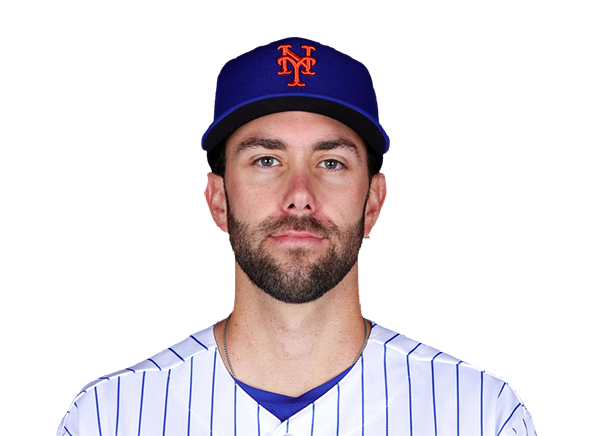 David Peterson |
1.2 | 1 | 0 | 0 | 0 | 1 | 0 | 28-17 | 0.00 | 28 |
 Ryan Zeferjahn |
1.1 | 1 | 0 | 0 | 1 | 2 | 0 | 30-19 | 0.00 | 30 |
San Diego Padres
| Player | IP | H | R | ER | BB | K | HR | PC-ST | ERA | PC |
|---|---|---|---|---|---|---|---|---|---|---|
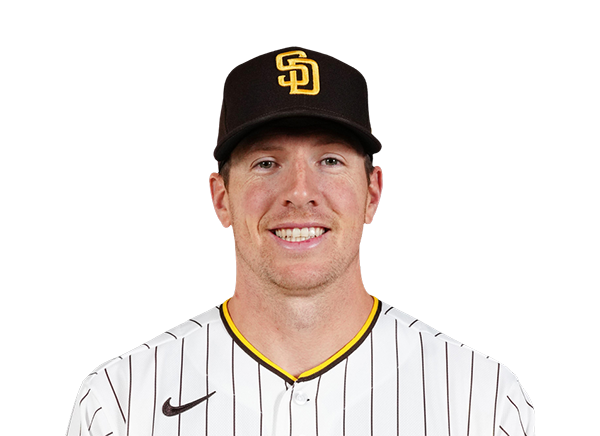 Nick Pivetta |
3.1 | 3 | 1 | 1 | 2 | 4 | 0 | 66-36 | 2.70 | 66 |
 Bradgley Rodriguez |
1.2 | 0 | 0 | 0 | 1 | 2 | 0 | 21-13 | 0.00 | 21 |
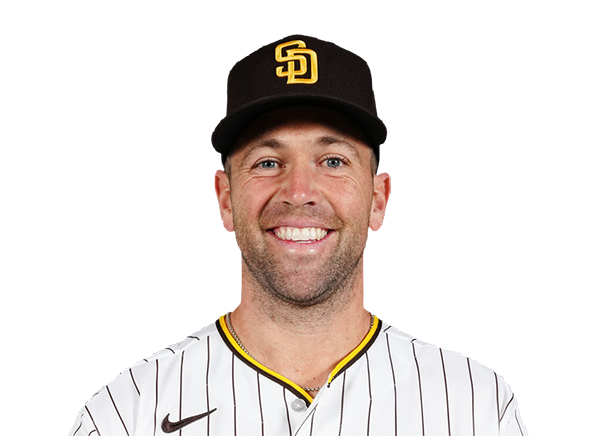 Jason Adam |
1.0 | 0 | 0 | 0 | 0 | 0 | 0 | 11-6 | 0.00 | 11 |
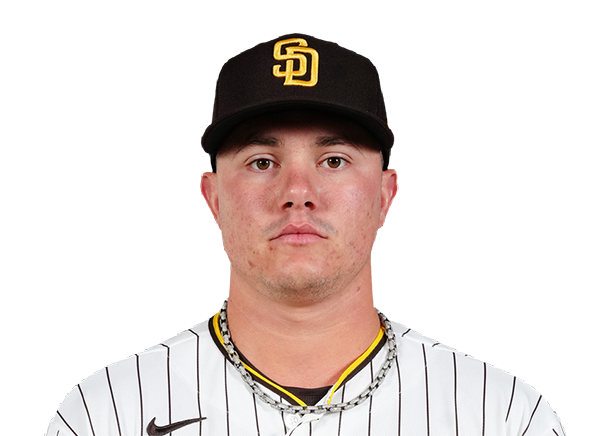 Adrian Morejon |
2.0 | 1 | 0 | 0 | 0 | 0 | 0 | 29-18 | 0.00 | 29 |
 Mason Miller |
1.0 | 1 | 0 | 0 | 0 | 2 | 0 | 19-13 | 0.00 | 19 |
H2H / Season Series
SD4–1
CHC
SD8–0
CHC
CHC23–3
SD
CHC9–7
SD
CHC3–2
SD
SD4–5
CHC
SD3–8
CHC
SD9–7
CHC
SD3–0
CHC
CHC6–5
SD
Last 5 Games
| Date | Opponent | Result |
|---|---|---|
| Sep 30 | @ SD | L1–4 |
| Sep 29 | @ SD | L0–8 |
| Date | Opponent | Result |
|---|---|---|
| Sep 30 | vs CHC | W4–1 |
| Sep 29 | vs CHC | W8–0 |
Standings
American League
| Team | W | L | PCT | GB | DIFF | STRK |
|---|---|---|---|---|---|---|
1 Rays | 98 | 64 | .605 | - | +86 | L1 |
2 Guardians | 85 | 77 | .525 | 13 | +11 | L1 |
3 Astros | 81 | 81 | .500 | 17 | -32 | W2 |
4 Yankees | 93 | 68 | .578 | 4.5 | +138 | W1 |
5 Red Sox | 87 | 75 | .537 | 11 | +78 | L1 |
6 White Sox | 84 | 78 | .519 | 14 | +56 | W1 |
7 Rangers | 80 | 82 | .494 | 18 | -46 | L1 |
8 Orioles | 79 | 82 | .491 | 18.5 | -21 | L1 |
9 Blue Jays | 79 | 83 | .488 | 19 | -46 | W1 |
10 Twins | 77 | 85 | .475 | 21 | -58 | W1 |
11 Tigers | 76 | 86 | .469 | 22 | +71 | L1 |
12 Mariners | 76 | 86 | .469 | 22 | -58 | W2 |
13 Royals | 69 | 93 | .426 | 29 | -120 | W1 |
14 Athletics | 64 | 98 | .395 | 34 | -238 | L2 |
15 Angels | 62 | 100 | .383 | 36 | -97 | L2 |
National League
| Team | W | L | PCT | GB | DIFF | STRK |
|---|---|---|---|---|---|---|
1 Brewers | 103 | 59 | .636 | - | +214 | W5 |
2 Dodgers | 100 | 62 | .617 | 3 | +201 | W3 |
3 Braves | 94 | 68 | .580 | 9 | +116 | L1 |
| 4Padres | 91 | 71 | .562 | 12 | +41 | W2 |
| 5Cubs | 89 | 73 | .549 | 14 | +147 | W1 |
6 Phillies | 88 | 74 | .543 | 15 | +15 | W1 |
7 Diamondbacks | 86 | 76 | .531 | 17 | +9 | L2 |
8 Pirates | 82 | 80 | .506 | 21 | +28 | W1 |
9 Marlins | 80 | 82 | .494 | 23 | +3 | W1 |
10 Cardinals | 77 | 85 | .475 | 26 | -29 | L4 |
11 Nationals | 77 | 85 | .475 | 26 | +6 | W1 |
12 Reds | 75 | 87 | .463 | 28 | -160 | L1 |
13 Mets | 74 | 88 | .457 | 29 | -32 | L1 |
14 Giants | 65 | 97 | .401 | 38 | -91 | L5 |
15 Rockies | 58 | 104 | .358 | 45 | -192 | L1 |
CHC
VS
SD
Pitchers
Kevin Gausman
Catchers
Carson Kelly
Infielders
Michael Busch
Nico Hoerner
Matt Shaw
Dansby Swanson
Outfielders
Pete Crow-Armstrong
Seiya Suzuki
Ian Happ
Designated Hitters
Alex Bregman
Pitchers
Nick Pivetta
Catchers
Ethan Salas
Infielders
Manny Machado
Ty France
Xander Bogaerts
Jake Cronenworth
Outfielders
Fernando Tatis Jr.
Dustin Harris
Jackson Merrill
Designated Hitters
Austin Hays
Cubs
VS
Padres
Batting
2
Team Games Played
2
62
At Bats
64
8
Hits
21
1
Runs Batted In
10
0
Home Runs
4
1
Stolen Bases
2
.129
Batting Average
.328
1
Runs
12
1
Doubles
3
0
Triples
0
9
Total Bases
36
7
Walks
3
19
Strikeouts
13
.229
On Base Percentage
.362
.145
Slugging Percentage
.563
.374
OBP Pct + SLG Pct
.925
2
Games Played
2
2
Games Started
2
1
Hit By Pitch
1
0.0
Wins Above Replacement
0.0
0.0
Offensive Wins Above Replacement
0.0
0
Caught Stealing
1
1
Is Qualified
1
1.2
Runs Created
12.1
0.6
Runs Created Per 27 Outs
6.9
.100
Walks Per Plate Appearance
.043
0.37
Walk To Strikeout Ratio
0.23
.016
Isolated Power
.234
.145
Secondary Average
.297
3.94
Pitches Per Plate Appearance
3.94
1
Extra Base Hits
7
70
Plate Appearances
69
0.0
At Bats Per Home Run
16.0
0
Sacrifice Hit
0
0
Sacrifice Flies
1
Pitching
2
Team Games Played
2
0
Quality Starts
1
0
Wins
2
2
Losses
0
0
Saves
1
0
Holds
2
21
Hits
8
11
Earned runs
1
4
Home Runs
0
3
Walks
7
13
Strikeouts
19
7.3
Strikeouts Per 9 Innings
9.5
136.0
Pitches Per Start
138.0
1.50
Walks Plus Hits Per Inning Pitched
0.83
6.19
Earned Run Average
0.50
2
Losses
0
16.0
Innings pitched
18.0
.000
Win Percentage
1.000
0
Save Opportunities
1
.328
Opponent Batting Average
.129
.362
Opponent's On-base pct.
.229
.563
Opponent's Slugging pct.
.145
.925
Opponent's OPB Pct + SLG Pct
.374
64
At Bats
62
3
Doubles
1
0
Triples
0
1
Batters Hit
1
2
Stolen Bases
1
2
Games Played
2
0
Complete Games
0
0
Shutouts
1
0
Wild Pitches
0
10
Runs Batted In
1
0
Balks
0
16.0
Innings pitched
18.0
7.3
Strikeouts Per 9 Innings
9.5
1
Caught Stealing
0
2
Games Started
2
0.0
Wins Above Replacement
0.0
1
Is Qualified
1
12
Runs
1
11
Earned Runs
1
36
Total Bases
9
Fielding
2
Team Games Played
2
144
Full Innings
162
67
Total Chances
66
48
Putouts
54
18
Assists
11
1
Errors
1
6
Double Plays
3
0.985
Fielding Percentage
0.985
4.1
Range Factor
3.6
0.0
Zone Rating
0.0
2
Games Played
2
0
Games Started
0
0.0
Defensive Wins Above Replacement
0.0
1
Qualified
1