

Cubs vs Phillies Live Score (15 Apr, 2026)
Game Information
Stage
Standard
Season
2026
First Pitch
Wed, Apr 15, 6:40 pm
Venue
Citizens Bank Park
Location
Philadelphia, Pennsylvania
Attendance
38,254
Live Situation
0Balls
2Strikes
0Outs
—Pitcher
—At Bat
Pitch Sequence
1
STRIKE LOOKING
Four-seam FB
95 MPH
2
STRIKE LOOKING
Sweeper
85 MPH
3
BALL IN PLAY
Four-seam FB
96 MPH
Injury Report
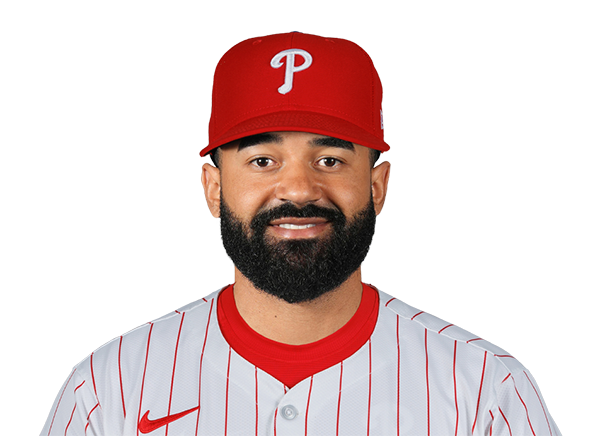
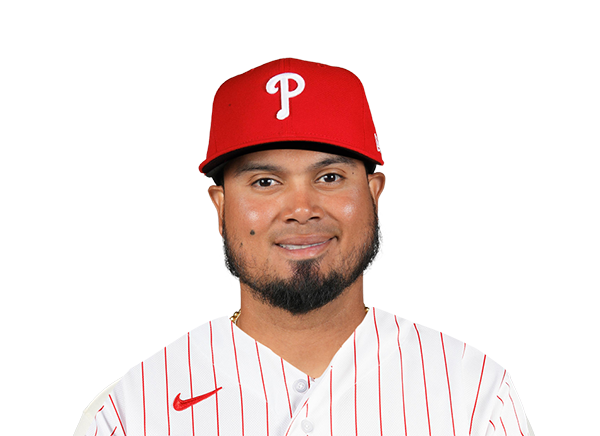
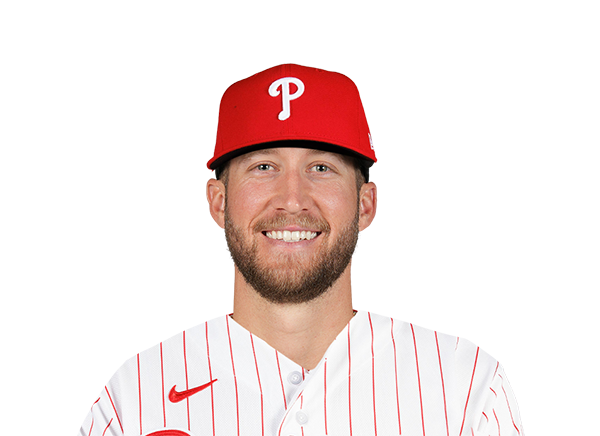
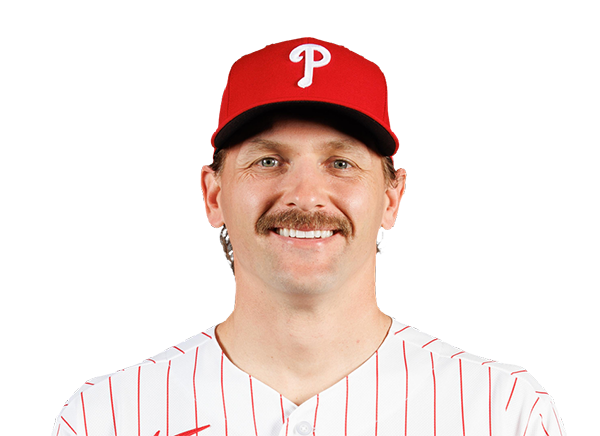
Team Stats
 CHC
PHI

11
Runs
2
15
Hits
5
0
Errors
1
2
Home Runs
2
2
Walks
1
8
Strikeouts
12
Player Box Score
Chicago Cubs
| Player | H-AB | AB | R | H | RBI | HR | BB | K | #P | AVG | OBP | SLG |
|---|---|---|---|---|---|---|---|---|---|---|---|---|
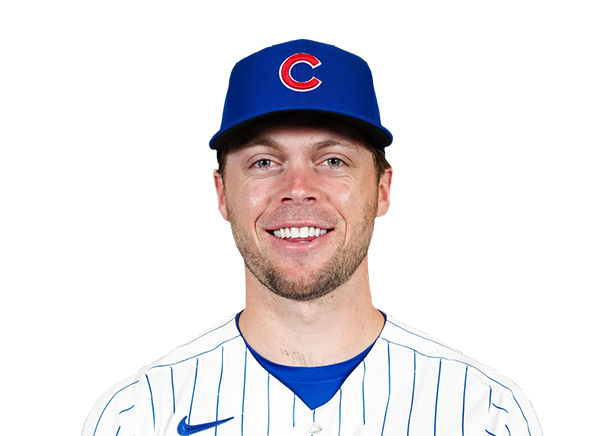 Nico Hoerner |
3-5 | 5 | 2 | 3 | 5 | 1 | 0 | 0 | 13 | .324 | .410 | .507 |
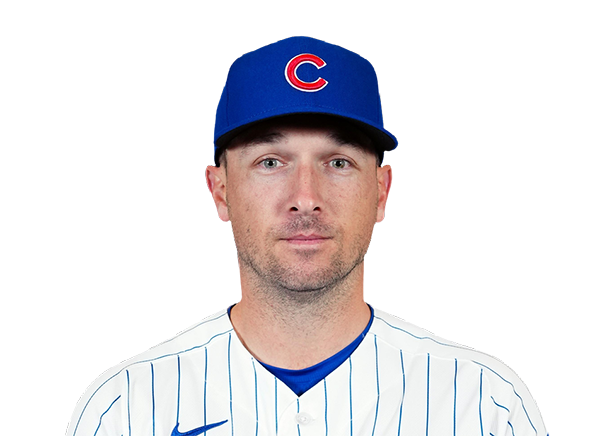 Alex Bregman |
1-4 | 4 | 1 | 1 | 0 | 0 | 1 | 3 | 27 | .243 | .321 | .338 |
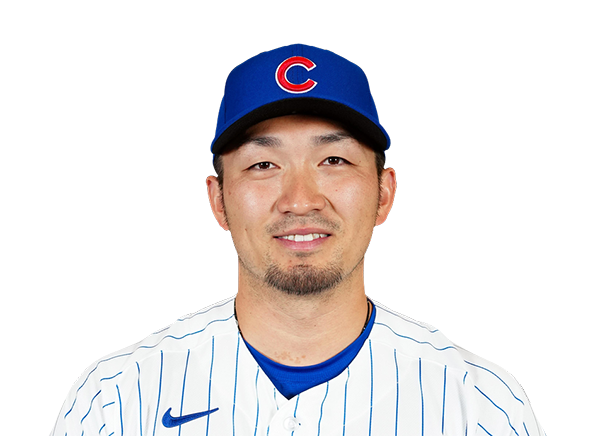 Seiya Suzuki |
2-4 | 4 | 1 | 2 | 0 | 0 | 1 | 1 | 21 | .261 | .393 | .261 |
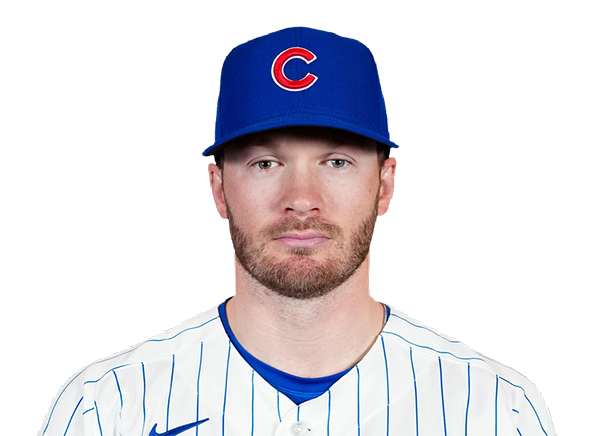 Ian Happ |
0-4 | 4 | 0 | 0 | 0 | 0 | 0 | 2 | 17 | .212 | .307 | .455 |
 Michael Busch |
0-5 | 5 | 0 | 0 | 0 | 0 | 0 | 1 | 17 | .148 | .254 | .180 |
 Dansby Swanson |
3-5 | 5 | 2 | 3 | 2 | 1 | 0 | 0 | 21 | .200 | .347 | .417 |
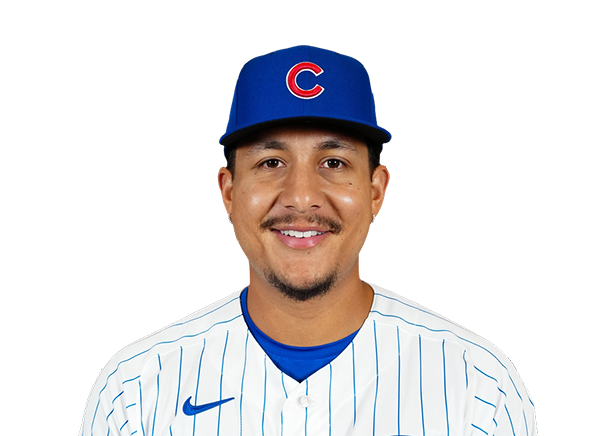 Miguel Amaya |
1-5 | 5 | 1 | 1 | 0 | 0 | 0 | 0 | 15 | .267 | .405 | .400 |
 Pete Crow-Armstrong |
2-4 | 4 | 1 | 2 | 0 | 0 | 0 | 1 | 12 | .236 | .276 | .306 |
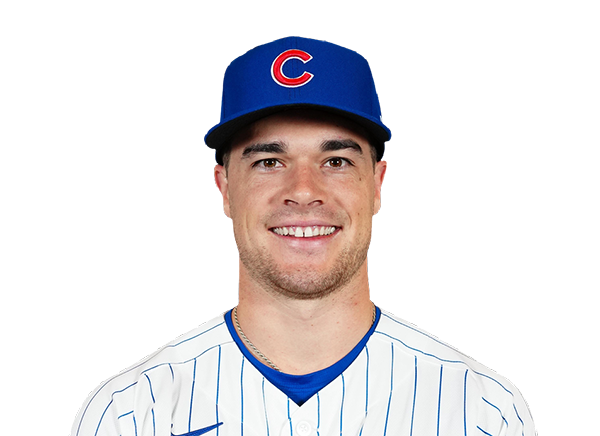 Matt Shaw |
3-4 | 4 | 3 | 3 | 2 | 0 | 0 | 0 | 20 | .245 | .283 | .449 |
Philadelphia Phillies
| Player | H-AB | AB | R | H | RBI | HR | BB | K | #P | AVG | OBP | SLG |
|---|---|---|---|---|---|---|---|---|---|---|---|---|
 Trea Turner |
1-2 | 2 | 1 | 1 | 1 | 1 | 1 | 1 | 11 | .260 | .308 | .397 |
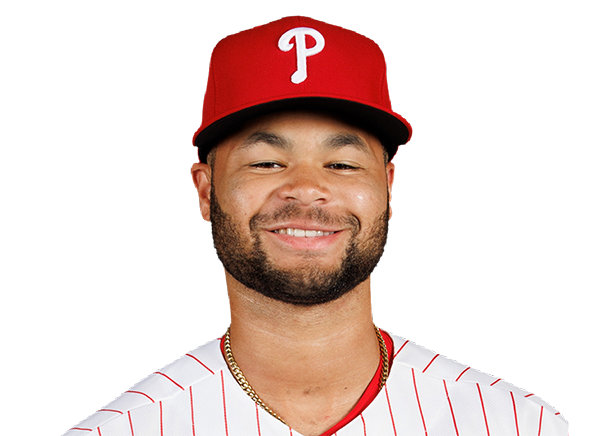 Justin Crawford |
0-1 | 1 | 0 | 0 | 0 | 0 | 0 | 0 | 1 | .283 | .345 | .396 |
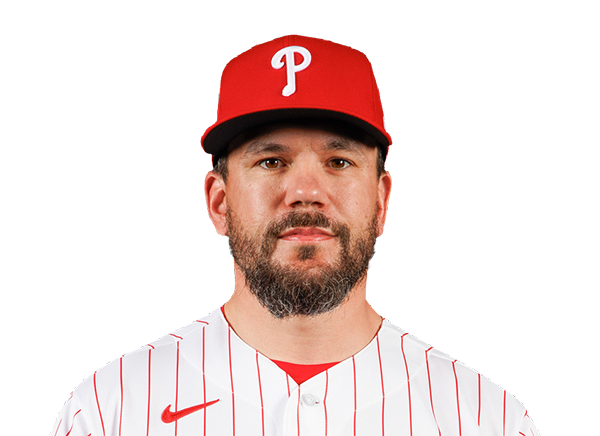 Kyle Schwarber |
0-4 | 4 | 0 | 0 | 0 | 0 | 0 | 3 | 21 | .222 | .380 | .556 |
 Bryce Harper |
1-4 | 4 | 1 | 1 | 1 | 1 | 0 | 2 | 14 | .258 | .355 | .515 |
 Adolis Garcia |
2-4 | 4 | 0 | 2 | 0 | 0 | 0 | 1 | 18 | .231 | .301 | .385 |
 Edmundo Sosa |
1-4 | 4 | 0 | 1 | 0 | 0 | 0 | 2 | 13 | .286 | .348 | .524 |
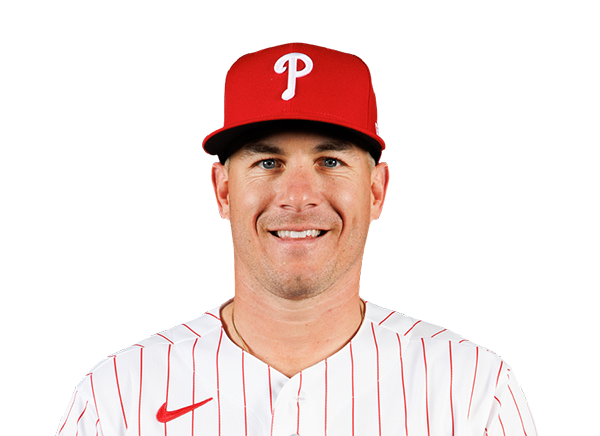 J.T. Realmuto |
0-2 | 2 | 0 | 0 | 0 | 0 | 0 | 1 | 14 | .273 | .373 | .386 |
 Rafael Marchan |
0-2 | 2 | 0 | 0 | 0 | 0 | 0 | 0 | 8 | .048 | .091 | .190 |
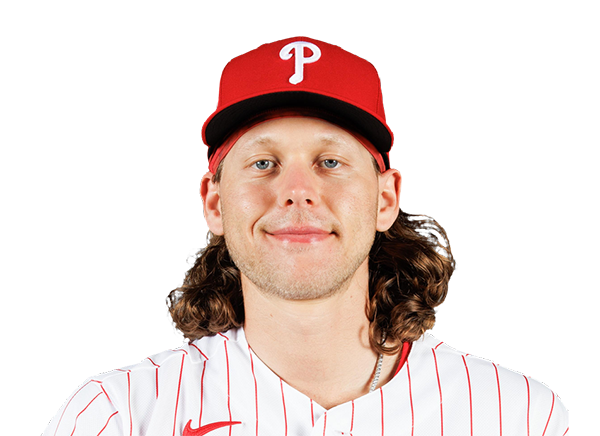 Alec Bohm |
0-3 | 3 | 0 | 0 | 0 | 0 | 0 | 0 | 9 | .145 | .217 | .210 |
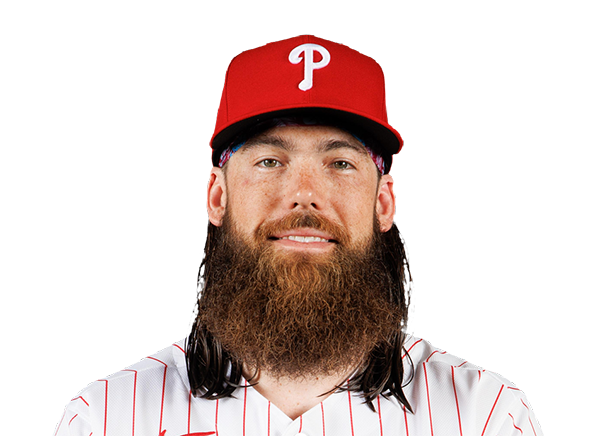 Brandon Marsh |
0-3 | 3 | 0 | 0 | 0 | 0 | 0 | 1 | 10 | .290 | .318 | .452 |
 Otto Kemp |
0-3 | 3 | 0 | 0 | 0 | 0 | 0 | 1 | 14 | .125 | .222 | .125 |
Chicago Cubs
| Player | IP | H | R | ER | BB | K | HR | PC-ST | ERA | PC |
|---|---|---|---|---|---|---|---|---|---|---|
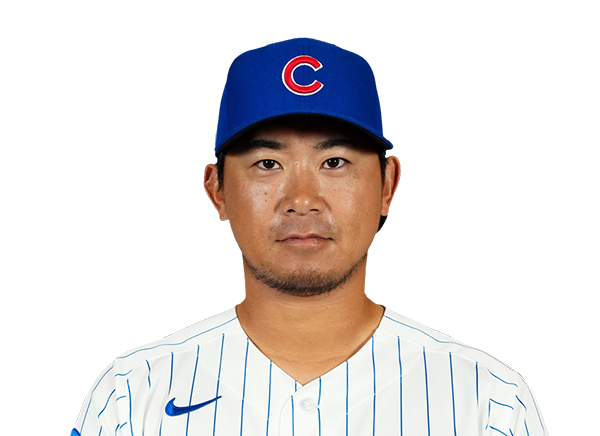 Shota Imanaga |
6.0 | 3 | 1 | 1 | 1 | 11 | 1 | 97-67 | 2.45 | 97 |
 Ben Brown |
2.0 | 0 | 0 | 0 | 0 | 0 | 0 | 17-12 | 3.07 | 17 |
 Luke Little |
1.0 | 2 | 1 | 1 | 0 | 1 | 1 | 19-14 | 9.00 | 19 |
Philadelphia Phillies
| Player | IP | H | R | ER | BB | K | HR | PC-ST | ERA | PC |
|---|---|---|---|---|---|---|---|---|---|---|
 Jesus Luzardo |
5.1 | 12 | 9 | 8 | 1 | 4 | 1 | 98-64 | 7.94 | 98 |
 Kyle Backhus |
1.2 | 3 | 1 | 1 | 0 | 3 | 1 | 41-28 | 7.71 | 41 |
 Jose Alvarado |
1.0 | 0 | 0 | 0 | 0 | 1 | 0 | 11-6 | 10.50 | 11 |
 Dylan Moore |
1.0 | 0 | 1 | 1 | 1 | 0 | 0 | 13-6 | 5.40 | 13 |
H2H / Season Series
CHC8–7
PHI
CHC7–2
PHI
CHC7–4
PHI
CHC5–1
PHI
PHI2–11
CHC
PHI4–10
CHC
PHI13–7
CHC
Last 5 Games
| Date | Opponent | Result |
|---|---|---|
| Aug 22 |  @ SEA | L4–5 |
| Aug 21 | @ SEA | L5–6 |
| Aug 19 |  vs CHW | L0–3 |
| Aug 18 | vs CHW | W4–3 |
| Aug 17 | vs CHW | W7–5 |
| Date | Opponent | Result |
|---|---|---|
| Aug 22 |  vs STL | W12–3 |
| Aug 21 | vs STL | W7–6 |
| Aug 19 |  vs MIA | W4–1 |
| Aug 18 | vs MIA | W6–4 |
| Aug 17 | vs MIA | W6–5 |
Standings
American League
| Team | W | L | PCT | GB | DIFF | STRK |
|---|---|---|---|---|---|---|
1 Rays | 76 | 53 | .589 | - | +42 | L3 |
| 2White Sox | 67 | 62 | .519 | 9 | +42 | L1 |
3 Astros | 65 | 65 | .500 | 11.5 | -43 | L1 |
4 Yankees | 73 | 56 | .566 | 3 | +95 | L1 |
5 Red Sox | 70 | 59 | .543 | 6 | +98 | W2 |
6 Rangers | 64 | 66 | .492 | 12.5 | -48 | L1 |
7 Guardians | 64 | 66 | .492 | 12.5 | -14 | W3 |
8 Blue Jays | 64 | 67 | .489 | 13 | -50 | W1 |
9 Twins | 63 | 67 | .485 | 13.5 | -47 | L2 |
10 Orioles | 63 | 67 | .485 | 13.5 | -33 | W2 |
| 11Mariners | 62 | 68 | .477 | 14.5 | -44 | W2 |
12 Tigers | 61 | 68 | .473 | 15 | +77 | L4 |
13 Royals | 57 | 74 | .435 | 20 | -95 | W7 |
14 Angels | 52 | 78 | .400 | 24.5 | -68 | W1 |
15 Athletics | 50 | 80 | .385 | 26.5 | -188 | W1 |
National League
| Team | W | L | PCT | GB | DIFF | STRK |
|---|---|---|---|---|---|---|
1 Brewers | 81 | 49 | .623 | - | +163 | W3 |
2 Dodgers | 79 | 51 | .608 | 2 | +147 | W5 |
3 Braves | 75 | 55 | .577 | 6 | +108 | L2 |
| 4Cubs | 74 | 56 | .569 | 7 | +98 | L3 |
| 5Phillies | 72 | 58 | .554 | 9 | +25 | W8 |
6 Padres | 70 | 60 | .538 | 11 | +9 | W2 |
7 Diamondbacks | 68 | 62 | .523 | 13 | +7 | L1 |
| 8Marlins | 66 | 64 | .508 | 15 | +17 | W2 |
| 9Cardinals | 66 | 65 | .504 | 15.5 | 0 | L2 |
10 Pirates | 63 | 68 | .481 | 18.5 | +29 | L2 |
11 Reds | 62 | 68 | .477 | 19 | -92 | W1 |
12 Nationals | 61 | 70 | .466 | 20.5 | +14 | L3 |
13 Mets | 59 | 71 | .454 | 22 | -39 | W1 |
14 Giants | 52 | 77 | .403 | 28.5 | -79 | L3 |
15 Rockies | 50 | 79 | .388 | 30.5 | -131 | L5 |
CHC
VS
PHI
Pitchers
Shota Imanaga
Ben Brown
Luke Little
Catchers
Miguel Amaya
Infielders
Nico Hoerner
Alex Bregman
Michael Busch
Dansby Swanson
Outfielders
Ian Happ
Pete Crow-Armstrong
Matt Shaw
Designated Hitters
Seiya Suzuki
Pitchers
Jesus Luzardo
Kyle Backhus
Jose Alvarado
Dylan Moore
Catchers
J.T. Realmuto
Rafael Marchan
Infielders
Trea Turner
Bryce Harper
Edmundo Sosa
Alec Bohm
Otto Kemp
Outfielders
Justin Crawford
Adolis Garcia
Brandon Marsh
Designated Hitters
Kyle Schwarber
Cubs
VS
Phillies
Batting
129
Team Games Played
129
4434
At Bats
4322
1101
Hits
1044
622
Runs Batted In
562
168
Home Runs
155
96
Stolen Bases
95
.248
Batting Average
.242
661
Runs
581
216
Doubles
185
20
Triples
21
1861
Total Bases
1736
546
Walks
416
1111
Strikeouts
1086
.337
On Base Percentage
.313
.420
Slugging Percentage
.402
.757
OBP Pct + SLG Pct
.715
129
Games Played
129
129
Games Started
129
65
Hit By Pitch
53
0.0
Wins Above Replacement
0.0
0.0
Offensive Wins Above Replacement
0.0
17
Caught Stealing
16
1
Is Qualified
1
652.7
Runs Created
558.4
5.1
Runs Created Per 27 Outs
4.4
.107
Walks Per Plate Appearance
.086
0.49
Walk To Strikeout Ratio
0.38
.171
Isolated Power
.160
.312
Secondary Average
.275
3.97
Pitches Per Plate Appearance
3.89
404
Extra Base Hits
361
5086
Plate Appearances
4849
26.4
At Bats Per Home Run
27.9
6
Sacrifice Hit
11
34
Sacrifice Flies
44
Pitching
129
Team Games Played
129
39
Quality Starts
55
74
Wins
71
55
Losses
58
29
Saves
35
47
Holds
57
1065
Hits
1103
531
Earned runs
524
193
Home Runs
152
389
Walks
393
989
Strikeouts
1272
7.7
Strikeouts Per 9 Innings
10.0
144.8
Pitches Per Start
149.5
1.26
Walks Plus Hits Per Inning Pitched
1.31
4.14
Earned Run Average
4.12
55
Losses
58
1154.1
Innings pitched
1145.2
.574
Win Percentage
.550
49
Save Opportunities
52
.244
Opponent Batting Average
.250
.312
Opponent's On-base pct.
.318
.417
Opponent's Slugging pct.
.406
.729
Opponent's OPB Pct + SLG Pct
.724
4357
At Bats
4405
152
Doubles
186
10
Triples
22
50
Batters Hit
57
69
Stolen Bases
76
129
Games Played
129
0
Complete Games
1
5
Shutouts
15
28
Wild Pitches
32
543
Runs Batted In
538
2
Balks
3
1154.1
Innings pitched
1145.2
7.7
Strikeouts Per 9 Innings
10.0
25
Caught Stealing
34
129
Games Started
129
0.0
Wins Above Replacement
0.0
1
Is Qualified
1
562
Runs
565
531
Earned Runs
524
1816
Total Bases
1789
Fielding
129
Team Games Played
129
1154
Full Innings
1146
4725
Total Chances
4558
3463
Putouts
3437
1214
Assists
1056
48
Errors
65
216
Double Plays
185
0.990
Fielding Percentage
0.986
36.5
Range Factor
35.3
0.0
Zone Rating
0.0
129
Games Played
129
0
Games Started
0
0.0
Defensive Wins Above Replacement
0.0
1
Qualified
1